PyQt地图
一、问题引入
最近在做一个PyQt的地图实时轨迹绘制的项目,在这个过程中遇到过一些问题,比如PyQt如何加载除地图,如何在地图上根据经纬度变化面画轨迹等等。
二、加载地图
首先就是地图加载的问题,我前后采用了两种方法来加载地图,包括离线文件方式加载和动态渲染方式加载。
1.离线文件方式加载地图
离线文件方式的思路就是首先保存一份地图的离线文件,然后再在PyQt的窗口中加载出来。
from PyQt5.QtCore import *
from PyQt5.QtWidgets import *
from PyQt5.QtWebEngineWidgets import *
import sys
import os
import folium

class MainWindow(QMainWindow):
    def __init__(self):
        super(QMainWindow, self).__init__()
        self.setWindowTitle('地图显示')
        self.resize(1000, 640)

        layout = QVBoxLayout()

        self.qwebengine = QWebEngineView(self)
        layout.addWidget(self.qwebengine)

        self.container = QWidget(self)
        self.container.setLayout(layout)
        self.setCentralWidget(self.container)
        self.generate_map()

    def generate_map(self):
        location = [126.632628,45.743215]
        location.reverse()
        # 调用高德地图http://webrd02.is.autonavi.com/appmaptile?lang=zh_cn&size=1&scale=1&style=7&x={x}&y={y}&z={z}
        Map = folium.Map(location,
                         zoom_start=16,
                         control_scale=True,
                         tiles='http://webrd02.is.autonavi.com/appmaptile?lang=zh_cn&size=1&scale=1&style=7&x={x}&y={y}&z={z}',
                         attr='default')
        Map.add_child(folium.LatLngPopup())  # 显示鼠标点击点经纬度
        Map.add_child(folium.ClickForMarker(popup='Waypoint'))  # 将鼠标点击点添加到地图上

        # 标记一个实心圆
        folium.CircleMarker(
            location,
            radius=1,
            popup='popup',
            color='#DC143C',  # 圈的颜色
            fill=True,
            fill_color='#6495E'  # 填充颜色
        ).add_to(Map)
        Map.save("map.html")
        # 在QWebEngineView中加载网址
        path = "file:\\" + os.getcwd() + "\\map.html"
        path = path.replace('\\', '/')
        self.qwebengine.load(QUrl(path))

if __name__ == '__main__':
    app = QApplication(sys.argv)
    win = MainWindow()
    win.show()
    sys.exit(app.exec_())
运行结果
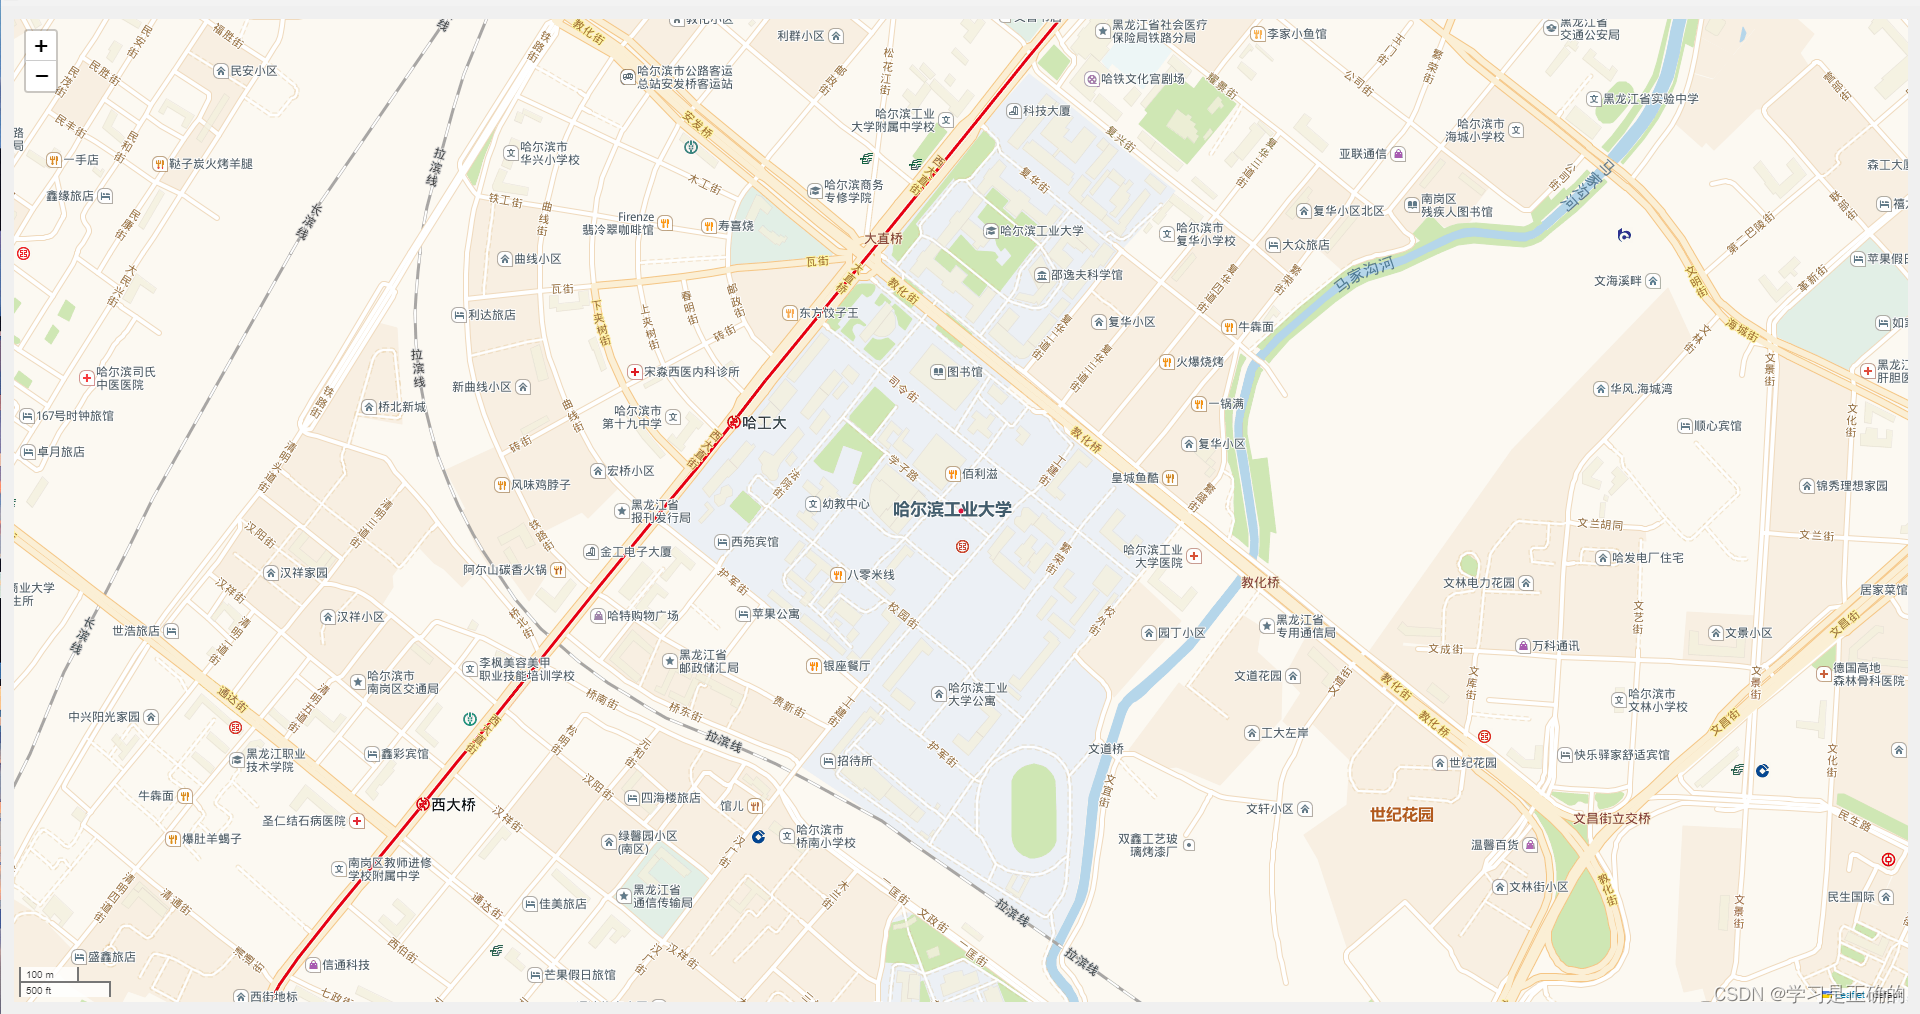
这种方法的思路很简单,但是过程比较繁琐,而且不好对地图添加轨迹,因为每次都要重新加载离线文件,会产生很明显的地图刷新效果,影响观感。
所以有另一种思路:不保存离线地图文件,直接将地图文件数据导入到PyQt的窗口进行显示,后续再利用JavaScrip语句操作地图数据,进行轨迹绘制,能很好的解决离线刷新的问题。
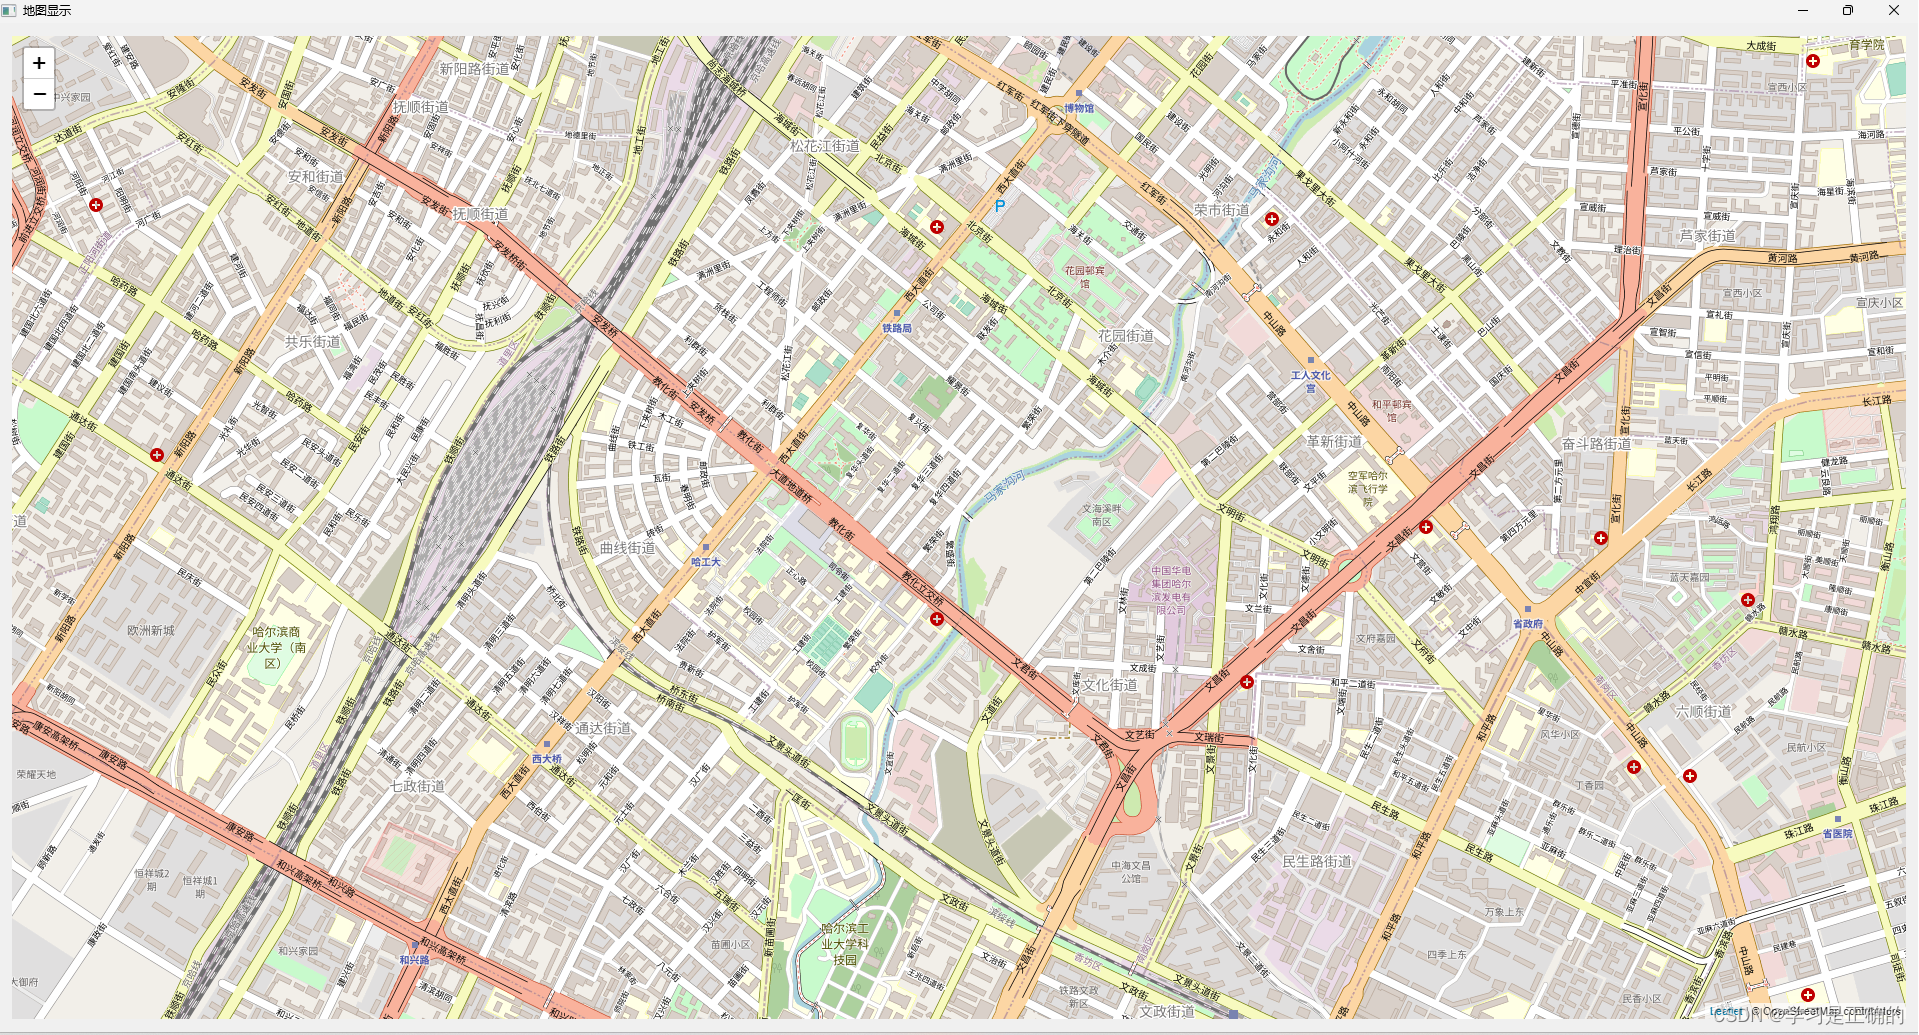
2.动态渲染方式
动态渲染的方式是利用leaflet和JavaScrip语句进行的,需要先下载leafle相关文件,下载地址https://leafletjs.com/,下载完成后需要将文件夹内部的文件复制到项目里面。
import sys
from PyQt5.QtWidgets import QApplication, QMainWindow, QVBoxLayout, QWidget
from PyQt5.QtWebEngineWidgets import QWebEngineView
from PyQt5.QtCore import QUrl

class RealTimeMapApp(QMainWindow):
    def __init__(self):
        super(RealTimeMapApp, self).__init__()
        self.setWindowTitle('地图显示')
        self.resize(800, 600)

        layout = QVBoxLayout()

        self.qwebengine = QWebEngineView(self)
        layout.addWidget(self.qwebengine)

        self.container = QWidget(self)
        self.container.setLayout(layout)
        self.setCentralWidget(self.container)

        self.qwebengine.setHtml(self.generate_map_html(), baseUrl=QUrl.fromLocalFile('.'))

    def generate_map_html(self):
        html = """
        <!DOCTYPE html>
        <html>
        <head>
            <meta charset="utf-8" />
            <title>Real-time Map</title>
            <style>
                body, html, #map {
                    height: 100%;
                    margin: 0;
                }
            </style>
            <!-- 引入 Leaflet 的 CSS 和 JavaScript 文件 -->
            <link rel="stylesheet" href="https://unpkg.com/[email protected]/dist/leaflet.css">
            <script src="https://unpkg.com/[email protected]/dist/leaflet.js"></script>
        </head>
        <body>
            <div id="map" style="width: 100%; height: 100vh;"></div>
            <script>
                var mymap = L.map('map').setView([45.743215, 126.632628], 15);
                L.tileLayer('https://{s}.tile.openstreetmap.org/{z}/{x}/{y}.png', {
                    attribution: '© OpenStreetMap contributors'
                }).addTo(mymap);
            </script>
        </body>
        </html>
        """
        return html

if __name__ == '__main__':
    app = QApplication(sys.argv)
    win = RealTimeMapApp()
    win.show()
    sys.exit(app.exec_())
运行结果:
三、轨迹绘制
加载完图片后就需要进行轨迹绘制了,因为采用第一种方式会有刷新的效果,因此这里不再展示第一种方式的轨迹绘制效果。
利用第二种方式加载完成地图后,根据经纬度列表,就能在地图上画出轨迹图了。这里采用随机路径的方法进行绘制,如果手头上有路径经纬度数据,也可以用手头的数据进行路径轨迹绘制。
import sys
from PyQt5.QtWidgets import QApplication, QMainWindow, QVBoxLayout, QWidget
from PyQt5.QtWebEngineWidgets import QWebEngineView
from PyQt5.QtCore import QTimer, QUrl
import random

class RealTimeMapApp(QMainWindow):
    def __init__(self):
        super(RealTimeMapApp, self).__init__()
        self.setWindowTitle('实时地图轨迹')
        self.resize(800, 600)

        layout = QVBoxLayout()

        self.qwebengine = QWebEngineView(self)
        layout.addWidget(self.qwebengine)

        self.container = QWidget(self)
        self.container.setLayout(layout)
        self.setCentralWidget(self.container)

        self.qwebengine.setHtml(self.generate_map_html(), baseUrl=QUrl.fromLocalFile('.'))

        self.new_point = None
        self.old_point = None
        self.old_label = None  # 用于保存旧点的经纬度标签对象

        self.timer = QTimer(self)
        self.timer.timeout.connect(self.update_map)
        self.timer.start(1000)  # 每秒更新一次地图

    def generate_map_html(self):
        html = """
        <!DOCTYPE html>
        <html>
        <head>
            <meta charset="utf-8" />
            <title>Real-time Map</title>
            <style>
                body, html, #map {
                    height: 100%;
                    margin: 0;
                }
            </style>
            <!-- 引入 Leaflet 的 CSS 和 JavaScript 文件 -->
            <link rel="stylesheet" href="https://unpkg.com/[email protected]/dist/leaflet.css">
            <script src="https://unpkg.com/[email protected]/dist/leaflet.js"></script>
        </head>
        <body>
            <div id="map" style="width: 100%; height: 100vh;"></div>
            <script>
                var mymap = L.map('map').setView([45.743215, 126.632628], 14);
                L.tileLayer('https://{s}.tile.openstreetmap.org/{z}/{x}/{y}.png', {
                    attribution: '© OpenStreetMap contributors'
                }).addTo(mymap);
                var pathMarkers = L.layerGroup().addTo(mymap);

                var newMarkerIcon = L.icon({
                    iconUrl: 'C:/Users/22285/Desktop/test_python/leaflet/images/marker-icon.png',  // 用于新的轨迹点(注意修改路径)
                    iconSize: [16, 16],
                    iconAnchor: [8, 8]
                });

                var oldMarkerOptions = {
                    radius: 5,
                    fillColor: 'blue',
                    color: 'blue',
                    fillOpacity: 1
                };

                var oldMarker;  // 声明在外部以持久保存旧点的图标对象

                function addPoint(lat, lng, isNew) {
                    var latlng = new L.LatLng(lat, lng);
                    if (isNew) {
                        if (oldMarker) {
                            pathMarkers.removeLayer(oldMarker);  // 删除旧点的图标
                            mymap.removeLayer(oldLabel);  // 删除旧点的经纬度标签
                        }
                        oldMarker = L.marker(latlng, { icon: newMarkerIcon }).addTo(pathMarkers);
var label = L.divIcon({
  className: 'label',
  html: `<div style="white-space: nowrap; margin-left: 1em;">Lat: ${lat.toFixed(7)} Lng: ${lng.toFixed(7)}</div>`
});


                        var newLabel = L.marker(latlng, { icon: label }).addTo(pathMarkers);
                        oldLabel = newLabel;  // 保存旧点的经纬度标签对象
                    } else {
                        var marker = L.circleMarker(latlng, oldMarkerOptions).addTo(pathMarkers);
                    }
                    mymap.panTo(latlng);
                }
            </script>
        </body>
        </html>
        """
        return html

    def update_map(self):
        new_point = [45.743215 + random.uniform(-0.01, 0.01), 126.632628 + random.uniform(-0.01, 0.01)]
        if self.new_point is not None:
            self.old_point = self.new_point  # 保存上一个新点的坐标
        self.new_point = new_point

        # 使用 JavaScript 添加新的轨迹点到地图上x
        javascript = f"addPoint({

      new_point[0]}, {

      new_point[1]}, true);"
        self.qwebengine.page().runJavaScript(javascript)

        if self.old_point is not None:
            # 使用 JavaScript 添加旧的轨迹点到地图上,并连接成线
            lineCoordinates = "[[" + f"{

      self.old_point[0]},{

      self.old_point[1]}], [{

      new_point[0]},{

      new_point[1]}]]"
            javascript = f"var line = L.polyline({

      lineCoordinates}, {

     {color: 'red'}}).addTo(mymap);"
            self.qwebengine.page().runJavaScript(javascript)


if __name__ == '__main__':
    app = QApplication(sys.argv)
    win = RealTimeMapApp()
    win.show()
    sys.exit(app.exec_())
注意:图标路径需修改。
运行结果:
PyQt地图轨迹绘制
注意:第二种加载方式需要外网。