在《内存、性能问题分析的利器——valgraind》一文中我们简单介绍了下valgrind工具集,本文将使用memcheck工具分析各种内存问题。(转载请指明出于breaksoftware的csdn博客)
本文所有的代码都是使用g++ -O0 -g mem_error.c -o mem_erro编译;分析都是使用valgrind --tool=memcheck ./mem_error指定(除非特殊说明)。
写违例
#include <stdlib.h>

int main() {
    const int array_count = 4;
    int* p = malloc(array_count * sizeof(int));
    p[array_count] = 0; // Illegal read
    free(p);
    return 0;
}
上述代码只分配了4个int型大小的空间,但是第6行要往该空间之后的空间写入数据,这就造成了写违例。使用valgrind分析会显示
==18100== Invalid write of size 4
==18100==    at 0x400658: main (mem_error.c:6)
==18100==  Address 0x51e0050 is 0 bytes after a block of size 16 alloc'd
==18100==    at 0x4C27BC3: malloc (vg_replace_malloc.c:299)
==18100==    by 0x40063F: main (mem_error.c:5)
第一行显示有4个字节被违例写入,第三行显示写入的位置在分配的16个字节之后。
读违例
#include <stdlib.h>

int main() {
    const int array_count = 4;
    int* p = malloc(array_count * sizeof(int));
    int error_num = p[array_count]; // Illegal read
    free(p);
    return 0;
}
错误的位置和上例一样,区别在于这次是读取不合法的地址的数据。使用valgrind分析显示
==31461== Invalid read of size 4
==31461==    at 0x400658: main (mem_error.c:6)
==31461==  Address 0x51e0050 is 0 bytes after a block of size 16 alloc'd
==31461==    at 0x4C27BC3: malloc (vg_replace_malloc.c:299)
==31461==    by 0x40063F: main (mem_error.c:5)
第一行显示有4个字节被违例读取,第三行显示读取的位置在分配的16个字节之后。
使用未初始化变量
这是初学C/C++编程的人非常容易犯的错误。
#include <stdlib.h>
#include <stdio.h>

int main() {
    const int array_count = 4;
    int* p = malloc(array_count * sizeof(int));
    printf("%d",  p[array_count - 1]);
    free(p);

    int undefine_num;
    printf("%d", undefine_num);
    return 0;
}
第7行和第11行分别访问了堆上、栈上未初始化的变量。valgrind分析显示
==24104== Conditional jump or move depends on uninitialised value(s)
==24104==    at 0x4E79F7F: vfprintf (in /home/opt/gcc-4.8.2.bpkg-r4/gcc-4.8.2.bpkg-r4/lib64/libc-2.18.so)
==24104==    by 0x4E837A8: printf (in /home/opt/gcc-4.8.2.bpkg-r4/gcc-4.8.2.bpkg-r4/lib64/libc-2.18.so)
==24104==    by 0x4006BA: main (mem_error.c:7)
==24104==
==24104== Conditional jump or move depends on uninitialised value(s)
==24104==    at 0x4E79E37: vfprintf (in /home/opt/gcc-4.8.2.bpkg-r4/gcc-4.8.2.bpkg-r4/lib64/libc-2.18.so)
==24104==    by 0x4E837A8: printf (in /home/opt/gcc-4.8.2.bpkg-r4/gcc-4.8.2.bpkg-r4/lib64/libc-2.18.so)
==24104==    by 0x4006DA: main (mem_error.c:11)
==24104==
虽然这个报告已经非常详细,但是我们还可以给valgrind增加--track-origins=yes,以打印问题出现在哪个结构上。当然这也会导致valgrind分析的比较慢
==29911== Conditional jump or move depends on uninitialised value(s)
==29911==    at 0x4E79F7F: vfprintf (in /home/opt/gcc-4.8.2.bpkg-r4/gcc-4.8.2.bpkg-r4/lib64/libc-2.18.so)
==29911==    by 0x4E837A8: printf (in /home/opt/gcc-4.8.2.bpkg-r4/gcc-4.8.2.bpkg-r4/lib64/libc-2.18.so)
==29911==    by 0x4006BA: main (mem_error.c:7)
==29911==  Uninitialised value was created by a heap allocation
==29911==    at 0x4C27BC3: malloc (vg_replace_malloc.c:299)
==29911==    by 0x40068F: main (mem_error.c:6)
==29911==
==29911== Conditional jump or move depends on uninitialised value(s)
==29911==    at 0x4E79E37: vfprintf (in /home/opt/gcc-4.8.2.bpkg-r4/gcc-4.8.2.bpkg-r4/lib64/libc-2.18.so)
==29911==    by 0x4E837A8: printf (in /home/opt/gcc-4.8.2.bpkg-r4/gcc-4.8.2.bpkg-r4/lib64/libc-2.18.so)
==29911==    by 0x4006DA: main (mem_error.c:11)
==29911==  Uninitialised value was created by a stack allocation
==29911==    at 0x400670: main (mem_error.c:4)
在系统函数中使用未初始化变量
我们看一个稍微复杂点的例子。下例中,test函数操作的是一个未初始化的变量,所以其结果是不可预知的。
#include <stdlib.h>
#include <stdio.h>

void test(int n) {
    n = n + 1;
}

int main() {
    const int array_count = 4;
    int* p = malloc(array_count * sizeof(int));
    test(p[array_count - 1]);
    free(p);
    return 0;
}
valgrind并不知道上述代码的作者想表达什么,所以它并没有报错
==28259== Command: ./mem_error
==28259==
==28259==
==28259== HEAP SUMMARY:
==28259==     in use at exit: 0 bytes in 0 blocks
==28259==   total heap usage: 1 allocs, 1 frees, 16 bytes allocated
==28259==
==28259== All heap blocks were freed -- no leaks are possible
==28259==
==28259== For counts of detected and suppressed errors, rerun with: -v
==28259== ERROR SUMMARY: 0 errors from 0 contexts (suppressed: 0 from 0)
但是如果错误调用是针对系统函数。valgrind是知道系统函数的输入要求的,于是就可以判定这种行为违例。我们稍微改下代码
#include <stdlib.h>
#include <stdio.h>

void test(int n) {
    n = n + 1;
    write(stdout, "xxx", n);
}

int main() {
    const int array_count = 4;
    int* p = malloc(array_count * sizeof(int));
    test(p[array_count - 1]);
    free(p);
    return 0;
}
valgrind就会分析出第6行系统方法write的第三个参数未初始化。
==4344== Syscall param write(count) contains uninitialised byte(s)
==4344==    at 0x4F0BED0: __write_nocancel (in /home/opt/gcc-4.8.2.bpkg-r4/gcc-4.8.2.bpkg-r4/lib64/libc-2.18.so)
==4344==    by 0x4006CA: test (mem_error.c:6)
==4344==    by 0x40070D: main (mem_error.c:12)
释放空间出错
我们可能重复释放同一段空间,或者给释放函数传入不是堆上的地址,或者使用了不对称的方法申请释放函数。这类错误发生在free,delete,delete[]和realloc上。
反复free同一段空间
#include <stdlib.h>

int main() {
    const int array_count = 4;
    int* p = malloc(array_count * sizeof(int));
    free(p);
    free(p);
    return 0;
}
使用valgrind分析,报告显示第7行释放了第6行已经释放了的空间,这个空间是在第5行申请的。
==6537== Invalid free() / delete / delete[] / realloc()
==6537==    at 0x4C28CBD: free (vg_replace_malloc.c:530)
==6537==    by 0x40065B: main (mem_error.c:7)
==6537==  Address 0x51e0040 is 0 bytes inside a block of size 16 free'd
==6537==    at 0x4C28CBD: free (vg_replace_malloc.c:530)
==6537==    by 0x40064F: main (mem_error.c:6)
==6537==  Block was alloc'd at
==6537==    at 0x4C27BC3: malloc (vg_replace_malloc.c:299)
==6537==    by 0x40063F: main (mem_error.c:5)
释放一个不是堆的空间
#include <stdlib.h>

int main() {
    int n = 1;
    int* p = &n;
    free(p);
    return 0;
}
valgrind会报告错误的释放栈上空间
==32411== Invalid free() / delete / delete[] / realloc()
==32411==    at 0x4C28CBD: free (vg_replace_malloc.c:530)
==32411==    by 0x4005F2: main (mem_error.c:6)
==32411==  Address 0x1fff000234 is on thread 1's stack
==32411==  in frame #1, created by main (mem_error.c:3)
申请释放方法不对称
对称的方法是指:
- new使用delete释放
- new[]使用delete[]释放
- alloc类函数,如malloc,realloc等使用free释放
#include <stdlib.h>

int main() {
    int* p = new int(1);
    free(p);
    return 0;
}
valgrind可以分析出这种不对称调用——new申请空间,free释放空间。
==5666== Mismatched free() / delete / delete []
==5666==    at 0x4C28CBD: free (vg_replace_malloc.c:530)
==5666==    by 0x400737: main (mem_error.c:5)
==5666==  Address 0x59fc040 is 0 bytes inside a block of size 4 alloc'd
==5666==    at 0x4C281E3: operator new(unsigned long) (vg_replace_malloc.c:334)
==5666==    by 0x400721: main (mem_error.c:4)
空间覆盖
当我们操作内存时,可能会发生内存覆盖。
#include <stdlib.h>
#include <string.h>

int main() {
    const int array_size = 8;
    char p[array_size] = {0};
    memcpy(p + 1, p, sizeof(char) * array_size);
    return 0;
}
这段代码的目的空间覆盖了源空间
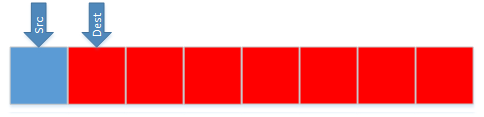
valgrind分析的报告也说明了这个错误
==25991== Source and destination overlap in memcpy(0x1fff000231, 0x1fff000230, 8)
==25991==    at 0x4C2BFEC: memcpy@@GLIBC_2.14 (vg_replace_strmem.c:1022)
==25991==    by 0x4006E2: main (mem_error.c:7)
可疑的参数
在C/C++中,有符号数的负数的二进制最高位是0x1。如果把一个负数看成一个无符号类型的数,则可以表达出极大数,比如0xFFFFFFFF(无符号值4294967295,有符号值-1),因为它们的底层二进制值是一致的。
有事我们在调用内存分配时,不小心将空间大小设置为一个负数,就要求申请一个极大的空间,这明显是有问题的。
#include <stdlib.h>

int main() {
    const int array_size = -1;
    void* p = malloc(array_size);
    free(p);
    return 0;
}
这个时候valgrind就会检测出参数可疑
==3364== Argument 'size' of function malloc has a fishy (possibly negative) value: -1
==3364==    at 0x4C27BC3: malloc (vg_replace_malloc.c:299)
==3364==    by 0x40070A: main (mem_error.c:5)
内存泄露
内存泄露是比较常见的问题,往往也是非常难以排查的问题。
#include <stdlib.h>

int main() {
    const int array_size = 32;
    void* p = malloc(array_size);
    return 0;
}
这次我们给valgrind增加选项--leak-check=full以显示出详细信息
valgrind --tool=memcheck --leak-check=full ./mem_error
valgrind分析出第5行分配的空间没有释放。其中definitely lost是指“确认泄露”,
==17393== HEAP SUMMARY:
==17393==     in use at exit: 32 bytes in 1 blocks
==17393==   total heap usage: 1 allocs, 0 frees, 32 bytes allocated
==17393==
==17393== 32 bytes in 1 blocks are definitely lost in loss record 1 of 1
==17393==    at 0x4C27BC3: malloc (vg_replace_malloc.c:299)
==17393==    by 0x4006B8: main (mem_error.c:5)
==17393==
==17393== LEAK SUMMARY:
==17393==    definitely lost: 32 bytes in 1 blocks
==17393==    indirectly lost: 0 bytes in 0 blocks
==17393==      possibly lost: 0 bytes in 0 blocks
==17393==    still reachable: 0 bytes in 0 blocks
==17393==         suppressed: 0 bytes in 0 blocks