一、echarts两个图表展示在同一行
① 效果图
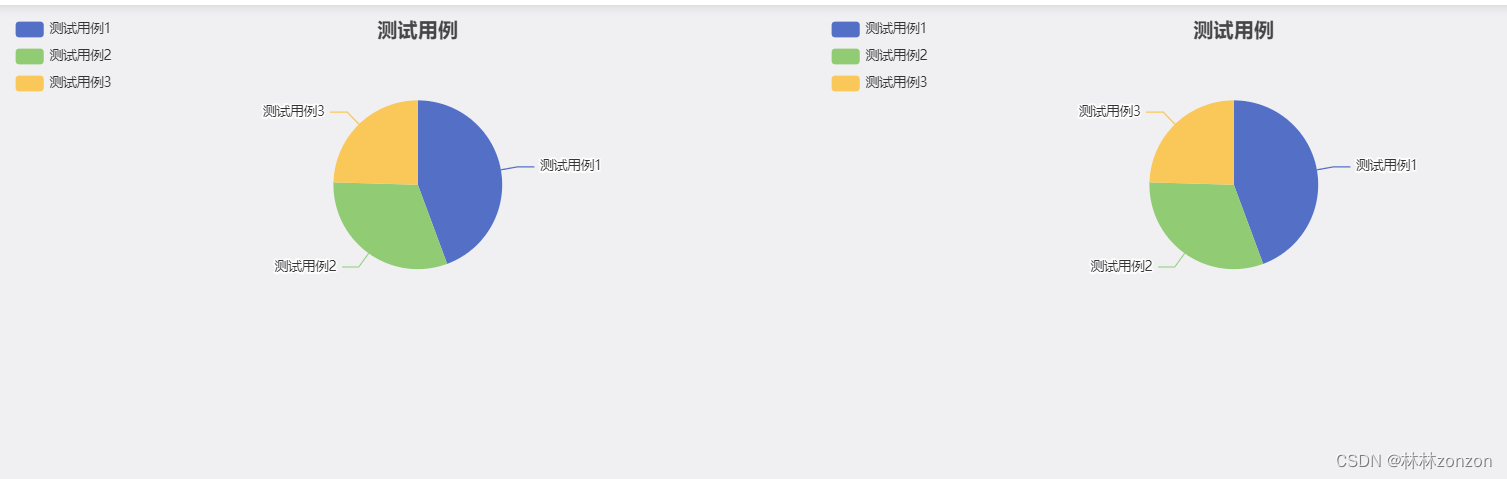
② div样式设置:用一个div包住图表,样式设置为 float: left; overflow: hidden;
    <div style="width: 50%; float: left; overflow: hidden">
      <div id="echart" style="width: 100%; height: 300px"></div>
    </div>
    <div style="width: 50%; float: left; overflow: hidden">
      <div id="echart1" style="width: 100%; height: 300px"></div>
    </div>
二、在el-dialog中展示echarts图表
① 效果图
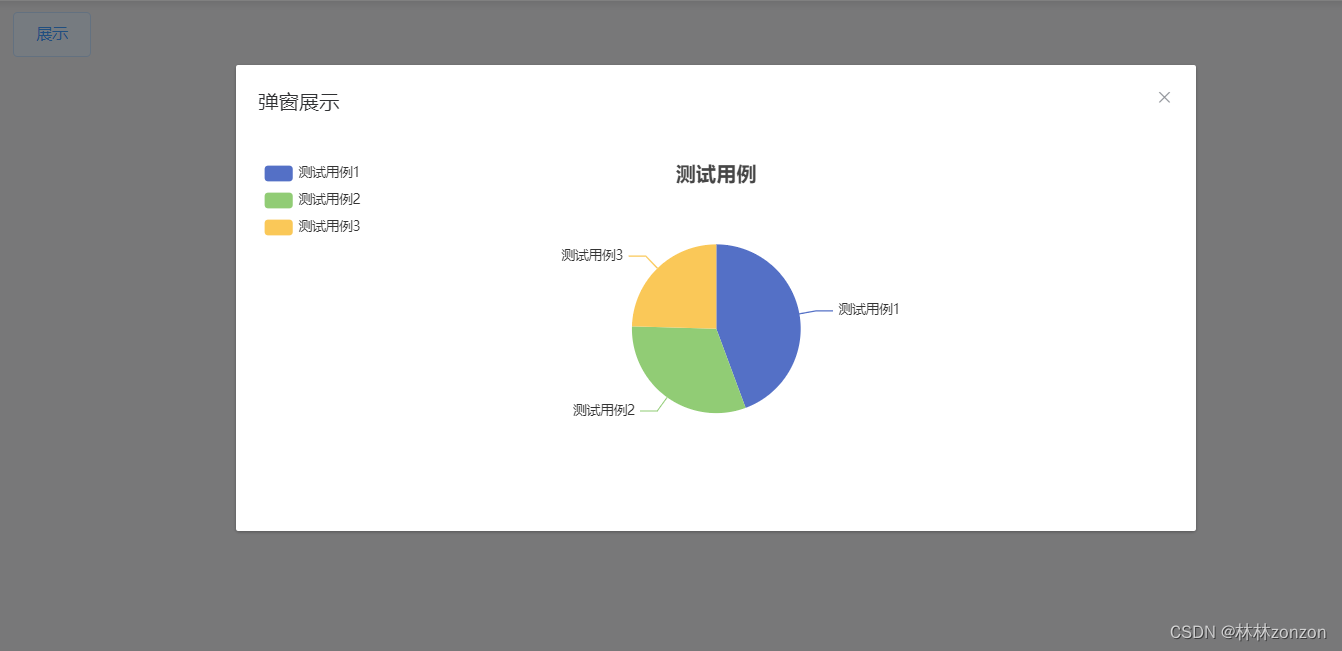
② el-dialog代码设置
    <el-dialog title="弹窗展示" :visible.sync="isShow" @open="open()">
      <div id="echart" style="width: 100%; height: 300px"></div>
    </el-dialog>
③ open函数设置
    open() {
      this.$nextTick(() => {
        //  执行echarts方法
        this.drawChart();
      });
    },

     drawChart() {
      const myChart = this.$echarts.init(document.getElementById("echart"));
      myChart.setOption(this.option);
    },
这里写个定时器也可以达到同样的效果
    open() {
      setTimeout(() => {
        this.drawChart();
      }, 0);
    },
④ 完整代码展示
<template>
  <div>
    <el-button @click="isShow = true">展示</el-button>
    <el-dialog title="弹窗展示" :visible.sync="isShow" @open="open()">
      <div id="echart" style="width: 100%; height: 300px"></div>
    </el-dialog>
  </div>
</template>

<script>
export default {
  data() {
    return {
      option: {
        title: {
          text: "测试用例",
          left: "center",
        },
        tooltip: {
          trigger: "item",
        },
        legend: {
          orient: "vertical",
          left: "left",
        },
        series: [
          {
            name: "数量",
            type: "pie",
            radius: "50%",
            data: [
              { value: 1048, name: "测试用例1" },
              { value: 735, name: "测试用例2" },
              { value: 580, name: "测试用例3" },
            ],
            emphasis: {
              itemStyle: {
                shadowBlur: 10,
                shadowOffsetX: 0,
                shadowColor: "rgba(0, 0, 0, 0.5)",
              },
            },
          },
        ],
      },
      isShow: false,
    };
  },
  methods: {
    drawChart() {
      const myChart = this.$echarts.init(document.getElementById("echart"));
      myChart.setOption(this.option);
    },
    open() {
      this.$nextTick(() => {
        //  执行echarts方法
        this.drawChart();
      });
    },
  },
};
</script>

<style scoped lang="less">
</style>