前言:在React中有专门提供可视化的工具 AntV ,但是仅仅靠该可视化,有时候远远不能完成项目开发的要求,所以考虑引入使用最常见的 Echarts 可视化工具,而在 React 中引入就需要将其封装为组件的形式进行使用,本节简单的介绍该如何封装 Echarts,工具官网如下:Apache ECharts
一、在 React 中先创建空组件
class Gauge2 extends Component{

}
export default Gauge2;
准备存放 Echarts 中需要的图形属性和数据。
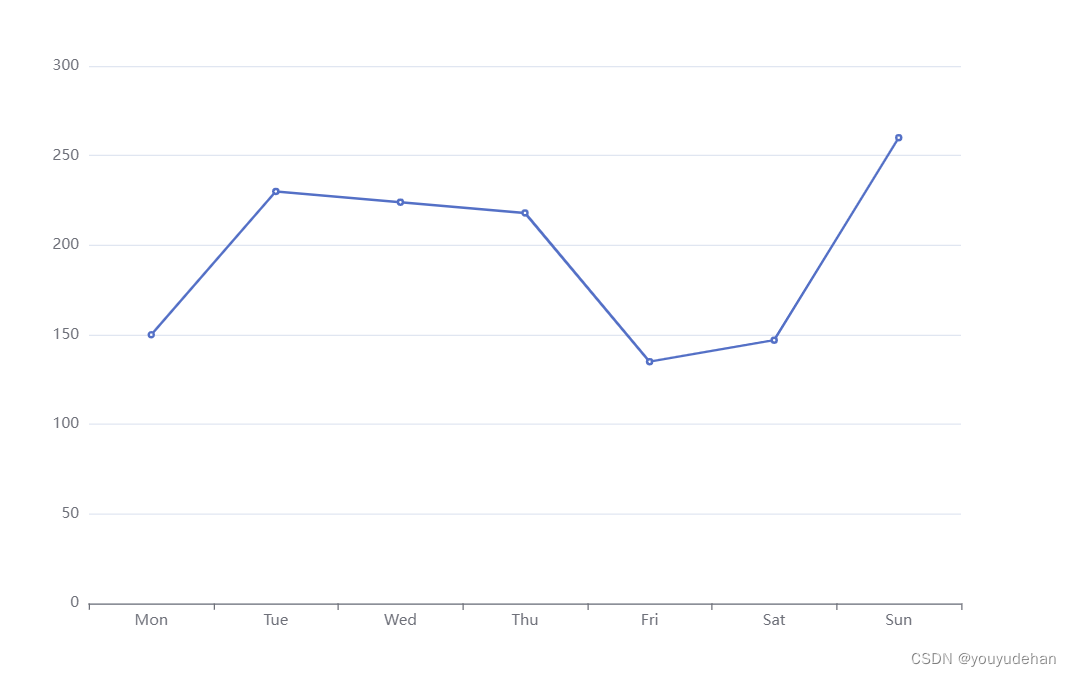
二、在 Echarts 中选定合适的图形,并按需引入依赖。 (以基本的折线图为例)
import React, { Component } from "react";
import * as echarts from "echarts";
import "echarts-gl";  //该依赖可不要
//以上依赖的前提是你需要下载 Echarts 的
class Gauge2 extends Component{

}
export default Gauge2;
三、引入数据在组件中 完整代码
import React, { Component } from "react";
import * as echarts from "echarts";
import "echarts-gl";  //该依赖可不要
//以上依赖的前提是你需要下载 Echarts 在 React 中
class Gauge2 extends Component{
     componentDidMount() {   //初始化组件,只执行一次
        this.initEcharts();
      }
     componentDidUpdate(){   // 组件更新时也会调用。
        this.initEcharts();
     }
      initEcharts() {
        const myChart = echarts.init(
          document.getElementById("main") as HTMLElement
        );
        myChart.setOption({  //下列数据可以直接按照可视化图里面的东西进行替换
            xAxis: {
                type: 'category',
                data: ['Mon', 'Tue', 'Wed', 'Thu', 'Fri', 'Sat', 'Sun']
              },
              yAxis: {
                type: 'value'
              },
              series: [
                {
                  data: [150, 230, 224, 218, 135, 147, 260],
                  type: 'line'
                }
              ]
        });
    }
    render(): React.ReactNode{   //挂载
        return <div id="main" style={

   {width:'100px',height:'100px'}}></div>
    }
}
export default Gauge2;
效果图:
最后:如果需要引入其他的图形,可以直接将 myChart.setOption({}) 里面的数据进行替换即可,复制粘贴下图中内容即可:
