需求分析
项目需要在监控主页动态监视房间内的温度和湿度,业主希望使用不同的颜色来区分不同的温湿度范围,其中温度范围-20℃ ~ 50℃,湿度范围0RH% ~ 100RH%。
实现效果
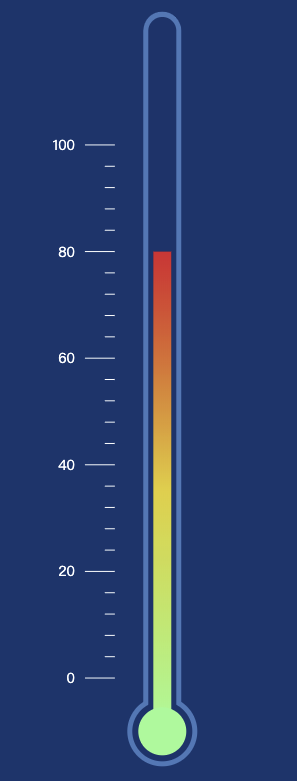
最终效果如下图所示:

其中温度范围渐变色从蓝色到红色,湿度范围渐变色从绿色到蓝色
npm版本和参考demo
项目采用Ant Design Pro V 2.0开发,所用的package版本如下:
npm版本如下:
    "antd": "^3.26.18",
    "echarts": "^4.8.0",
    "echarts-for-react": "^2.0.16",
参考demo:温度计ECharts
实现步骤
由于demo给的温度计Option范围和刻度和需求不符合,经过一番研究做了改进,下面给出温度计的实现Option。
温度计
其中最重要的是series[0].data和series[6].data的填充,前者对应温度计条状的高度,后者对应温度计刻度的划分和高度。
 var TP_value = 50;
 var kd = [];
 var Gradient = [];
 var leftColor = '';
 var showValue = '';
 var boxPosition = [65, 0];
 var TP_txt = ''
 // 刻度使用柱状图模拟,短设置1,长的设置3;构造一个数据
     for (let i = 0, len = 80; i <= len; i += 1) {


      if (i < 10) {


        kd.push('');
      } else if ((i - 10) % 10 === 0) {


        kd.push('-3');
      } else {


        kd.push('-1');
      }
    }

 //中间线的渐变色和文本内容
 if (TP_value > 20) {


     TP_txt = '温度偏高';
     Gradient.push({


         offset: 0,
         color: '#93FE94'
     }, {


         offset: 0.5,
         color: '#E4D225'
     }, {


         offset: 1,
         color: '#E01F28'
     })
 } else if (TP_value > -20) {


     TP_txt = '温度正常';
     Gradient.push({


         offset: 0,
         color: '#93FE94'
     }, {


         offset: 1,
         color: '#E4D225'
     })
 } else {


     TP_txt = '温度偏低';
     Gradient.push({


         offset: 1,
         color: '#93FE94'
     })
 }
 if (TP_value > 62) {


     showValue = 62
 } else {


     if (TP_value < -60) {


         showValue = -60
     } else {


         showValue = TP_value
     }
 }
 if (TP_value < -10) {


     boxPosition = [65, -120];
 }
 leftColor = Gradient[Gradient.length - 1].color;
 // 因为柱状初始化为0,温度存在负值,所以加上负值60和空出距离10
 var option = {


     backgroundColor: '#0C2F6F',
     title: {


         text: '温度计',
         show: false
     },
     yAxis: [{


         show: false,
         data: [],
         min: 0,
         max: 90,
         axisLine: {


             show: false
         }
     }, {


         show: false,
         min: 0,
         max: 50,
     }, {


         type: 'category',
        //  data: ['', '', '', '', '', '', '', '', '', '', '°C'],
         position: 'left',
         offset: -80,
         axisLabel: {


             fontSize: 10,
             color: 'white'
         },
         axisLine: {


             show: false
         },
         axisTick: {


             show: false
         },
     }],
     xAxis: [{


         show: false,
         min: -10,
         max: 80,
         data: []
     }, {


         show: false,
         min: -10,
         max: 80,
         data: []
     }, {


         show: false,
         min: -10,
         max: 80,
         data: []
     }, {


         show: false,
         min: -5,
         max: 80,

     }],
     series: [{


         name: '条',
         type: 'bar',
         // 对应上面XAxis的第一个对)象配置
         xAxisIndex: 0,
         data: [{


             value: (showValue + 30),  // 条状高度和刻度值一样

         }],

         barWidth: 18,
         itemStyle: {


             normal: {


                 color: new echarts.graphic.LinearGradient(0, 1, 0, 0, Gradient)
             }
         },
         z: 2
     }, {


         name: '白框',
         type: 'bar',
         xAxisIndex: 1,
         barGap: '-100%',
         data: [134],
         barWidth: 28,
         itemStyle: {


             normal: {


                 color: '#0C2E6D',
                 barBorderRadius: 50,
             }
         },
         z: 1
     }, {


         name: '外框',
         type: 'bar',
         xAxisIndex: 2,
         barGap: '-100%',
         data: [135],
         barWidth: 38,
         itemStyle: {


             normal: {


                 color: '#4577BA',
                 barBorderRadius: 50,
             }
         },
         z: 0
     }, {


         name: '圆',
         type: 'scatter',
         hoverAnimation: false,
         data: [0],
         xAxisIndex: 0,
         symbolSize: 48,
         itemStyle: {


             normal: {


                 color: '#93FE94',
                 opacity: 1,
             }
         },
         z: 2
     }, {


         name: '白圆',
         type: 'scatter',
         hoverAnimation: false,
         data: [0],
         xAxisIndex: 1,
         symbolSize: 60,
         itemStyle: {


             normal: {


                 color: '#0C2E6D',
                 opacity: 1,
             }
         },
         z: 1
     }, {


         name: '外圆',
         type: 'scatter',
         hoverAnimation: false,
         data: [0],
         xAxisIndex: 2,
         symbolSize: 70,
         itemStyle: {


             normal: {


                 color: '#4577BA',
                 opacity: 1,
             }
         },
         z: 0
     }, {


         name: '刻度',
         type: 'bar',
         yAxisIndex: 0,
         xAxisIndex: 3,
         label: {


             normal: {


                 show: true,
                 position: 'left',
                 distance: 10,
                 color: 'white',
                 fontSize: 14,
                 formatter: function(params) {


                     if (params.dataIndex > 80 || params.dataIndex < 10) {


                         return '';
                     } else {


                         if ((params.dataIndex - 10) % 10 === 0) {


                             return params.dataIndex - 30;
                         } else {


                             return '';
                         }
                     }
                 }
             }
         },
         barGap: '-100%',
         data: kd,
         barWidth: 1,
         itemStyle: {


             normal: {


                 color: 'white',
                 barBorderRadius: 120,
             }
         },
         z: 0
     }]
 };
效果如下:

湿度计
湿度计和温度计只有量测范围和颜色不同。
 var TP_value = 80;
 var kd = [];
 var Gradient = [];
 var leftColor = '';
 var showValue = '';
 var boxPosition = [65, 0];
 var TP_txt = ''
 // 刻度使用柱状图模拟,短设置1,长的设置3;构造一个数据
 for (var i = 0, len = 110; i <= len; i++) {


     if (i < 10 ) {


         kd.push('')
     } else {


         if ((i - 10) % 20 === 0) {


             kd.push('-3');
         } else if ((i - 10) % 4 === 0) {


             kd.push('-1');
         } else {


             kd.push('');
         }
     }

 }
 //中间线的渐变色和文本内容
 if (TP_value > 20) {


     TP_txt = '温度偏高';
     Gradient.push({


         offset: 0,
         color: '#93FE94'
     }, {


         offset: 0.5,
         color: '#E4D225'
     }, {


         offset: 1,
         color: '#E01F28'
     })
 } else if (TP_value > -20) {


     TP_txt = '温度正常';
     Gradient.push({


         offset: 0,
         color: '#93FE94'
     }, {


         offset: 1,
         color: '#E4D225'
     })
 } else {


     TP_txt = '温度偏低';
     Gradient.push({


         offset: 1,
         color: '#93FE94'
     })
 }
//  if (TP_value > 62) {


//      showValue = 62
//  } else {


//      if (TP_value < -60) {


//          showValue = -60
//      } else {


//          showValue = TP_value
//      }
//  }
//  if (TP_value < -10) {


//      boxPosition = [65, -120];
//  }
 leftColor = Gradient[Gradient.length - 1].color;
 // 因为柱状初始化为0,温度存在负值,所以加上负值60和空出距离10
 var option = {


     backgroundColor: '#0C2F6F',
     title: {


         text: '温度计',
         show: false
     },
     yAxis: [
         {


         show: false,
         data: [],
         min: 0,
         max: 135,
        //  max: 111,
         axisLine: {


             show: false
         }
     },

     {


         show: false,
         min: 0,
         max: 50,
     },

     {


         type: 'category',
        //  data: ['', '', '', '', '', '', '', '', '', '', '°C'],
         data: [],
         position: 'left',
         offset: -80,
         axisLabel: {


             fontSize: 10,
             color: 'white'
         },
         axisLine: {


             show: false
         },
         axisTick: {


             show: false
         },
     }

     ],
     xAxis: [{


         show: false,
         min: -10,
         max: 80,
         data: []
     }, {


         show: false,
         min: -10,
         max: 80,
         data: []
     }, {


         show: false,
         min: -10,
         max: 80,
         data: []
     }, {


         show: false,
         min: -5,
         max: 80,

     }],
     series: [

         {


         name: '条',
         type: 'bar',
         // 对应上面XAxis的第一个对)象配置
         xAxisIndex: 0,
         data: [{


             value: (TP_value + 10),

         }],

         barWidth: 18,
         itemStyle: {


             normal: {


                 color: new echarts.graphic.LinearGradient(0, 1, 0, 0, Gradient)
             }
         },
         z: 2
     }, {


         name: '白框',
         type: 'bar',
         xAxisIndex: 1,
         barGap: '-100%',
         data: [134],
         barWidth: 28,
         itemStyle: {


             normal: {


                 color: '#0C2E6D',
                 barBorderRadius: 50,
             }
         },
         z: 1
     }, {


         name: '外框',
         type: 'bar',
         xAxisIndex: 2,
         barGap: '-100%',
         data: [135],
         barWidth: 38,
         itemStyle: {


             normal: {


                 color: '#4577BA',
                 barBorderRadius: 50,
             }
         },
         z: 0
     }, {


         name: '圆',
         type: 'scatter',
         hoverAnimation: false,
         data: [0],
         xAxisIndex: 0,
         symbolSize: 48,
         itemStyle: {


             normal: {


                 color: '#93FE94',
                 opacity: 1,
             }
         },
         z: 2
     }, {


         name: '白圆',
         type: 'scatter',
         hoverAnimation: false,
         data: [0],
         xAxisIndex: 1,
         symbolSize: 60,
         itemStyle: {


             normal: {


                 color: '#0C2E6D',
                 opacity: 1,
             }
         },
         z: 1
     }, {


         name: '外圆',
         type: 'scatter',
         hoverAnimation: false,
         data: [0],
         xAxisIndex: 2,
         symbolSize: 70,
         itemStyle: {


             normal: {


                 color: '#4577BA',
                 opacity: 1,
             }
         },
         z: 0
     }, {


         name: '刻度',
         type: 'bar',
         yAxisIndex: 0,
         xAxisIndex: 3,
         label: {


             normal: {


                 show: true,
                 position: 'left',
                 distance: 10,
                 color: 'white',
                 fontSize: 14,
                 formatter: function(params) {


                     if (params.dataIndex > 111 || params.dataIndex < 10) {


                         return '';
                     } else {


                         if ((params.dataIndex - 10) % 20 === 0) {


                             return params.dataIndex -10 ;
                         } else {


                             return '';
                         }
                     }
                 }
             }
         },
         barGap: '-100%',
         data: kd,
        //  data: [
        //     // 占位用 10
        //      '-',
        //      '-',
        //      '-',
        //      '-',
        //      '-',
        //      '-',
        //      '-',
        //      '-',
        //      '-',
        //      '-',

        //      // 0 ~ 20
        //      '-3',
        //      '',
        //      '',
        //      '',
        //      '-1',
        //      '',
        //      '',
        //      '',
        //      '-1',
        //      '',
        //      '',
        //      '',
        //      '-1',
        //      '',
        //      '',
        //      '',
        //      '-1',
        //      '',
        //      '',
        //      '',

        //       // 20 ~ 40
        //      '-3',
        //      '',
        //      '',
        //      '',
        //      '-1',
        //      '',
        //      '',
        //      '',
        //      '-1',
        //      '',
        //      '',
        //      '',
        //      '-1',
        //      '',
        //      '',
        //      '',
        //      '-1',
        //      '',
        //      '',
        //      '',

        //      // 40 ~ 60
        //      '-3',
        //      '',
        //      '',
        //      '',
        //      '-1',
        //      '',
        //      '',
        //      '',
        //      '-1',
        //      '',
        //      '',
        //      '',
        //      '-1',
        //      '',
        //      '',
        //      '',
        //      '-1',
        //      '',
        //      '',
        //      '',

        //     // 60 ~ 80
        //      '-3',
        //      '',
        //      '',
        //      '',
        //      '-1',
        //      '',
        //      '',
        //      '',
        //      '-1',
        //      '',
        //      '',
        //      '',
        //      '-1',
        //      '',
        //      '',
        //      '',
        //      '-1',
        //      '',
        //      '',
        //      '',

        //      // 80 ~ 100
        //      '-3',
        //      '',
        //      '',
        //      '',
        //      '-1',
        //      '',
        //      '',
        //      '',
        //      '-1',
        //      '',
        //      '',
        //      '',
        //      '-1',
        //      '',
        //      '',
        //      '',
        //      '-1',
        //      '',
        //      '',
        //      '',

        //      '-3',

        // ],
         barWidth: 1,
         itemStyle: {


             normal: {


                 color: 'white',
                 barBorderRadius: 120,
             }
         },
         z: 0
     }]
 };
效果如下: