原文:https://mp.weixin.qq.com/s/BK-i9XcP4n3wZ1ipBV_5nQ
1 matplotlib绘制散点密度图
散点密度主要是计算样本点的出现次数,即密度。
import numpy as np
import matplotlib.pyplot as plt
from scipy.stats import gaussian_kde

# Generate fake data
N=1000
x = np.random.normal(size=N)
y = x * 3 + np.random.normal(size=N)

# Calculate the point density
xy = np.vstack([x,y])  #  将两个维度的数据叠加
z = gaussian_kde(xy)(xy)  # 建立概率密度分布,并计算每个样本点的概率密度

# Sort the points by density, so that the densest points are plotted last
idx = z.argsort()
x, y, z = x[idx], y[idx], z[idx]

fig, ax = plt.subplots()
plt.scatter(x, y,c=z, s=20,cmap='Spectral') # c表示标记的颜色
plt.colorbar()
plt.show()

scatter中其他可使用的cmap,参考【https://matplotlib.org/tutorials/colors/colormaps.html】
colorbar反向在颜色名称后面加_r,比如:cmap='Spectral_r'。
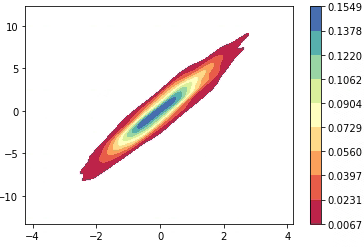
2 seaborn绘制散点密度图
import seaborn as sns
sns.kdeplot(x=x, y=y, fill=True, cmap='Spectral', cbar=True)
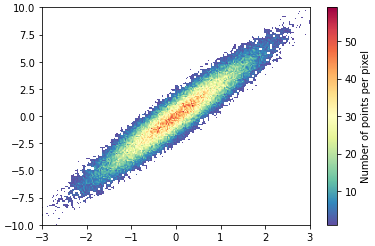
3 mpl-scatter-density包
# !pip install mpl-scatter-density
import mpl_scatter_density

N=100000
x = np.random.normal(size=N)
y = x * 3 + np.random.normal(size=N)

# 绘制二维散点密度图
fig = plt.figure()
ax = fig.add_subplot(1, 1, 1, projection='scatter_density')
density = ax.scatter_density(x, y, cmap='Spectral_r')
ax.set_xlim(-3, 3)
ax.set_ylim(-10, 10)
fig.colorbar(density, label='Number of points per pixel')
fig.savefig('gaussian.png')

使用该包绘制的图零值有颜色,可通过如下方法使零值变为白色:
import matplotlib.colors as mcolors
norm = mcolors.TwoSlopeNorm(vmin=-1, vmax =60, vcenter=0)
fig = plt.figure()
ax = fig.add_subplot(1, 1, 1, projection='scatter_density')
density = ax.scatter_density(x, y,norm=norm, cmap=plt.cm.RdBu)
ax.set_xlim(-3, 3)
ax.set_ylim(-10, 10)
fig.colorbar(density, label='Number of points per pixel')
fig.savefig('gaussian_color_coded.png')

虽然上述方式能使零值变为白色,但不美观,可将零值掩码或赋值为nan。 在源码base_image_artist.py 中的make_image函数(180行)中加上如下语句:
array = np.where(array>0, array, np.nan)
# 或者
array = np.ma.masked_array(array, mask=(array<=0))
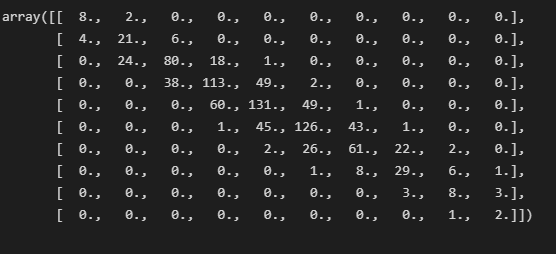
该包调用了fast_histogram计算样本频率:
from fast_histogram import histogram2d

ymin, ymax = y.min(), y.max()
xmin, xmax = x.min(), x.max()

array = histogram2d(y, x, bins=10,range=((ymin, ymax), (xmin, xmax)))
参考:
https://www.cnblogs.com/niuniu238/p/14128661.html