先看示意图:
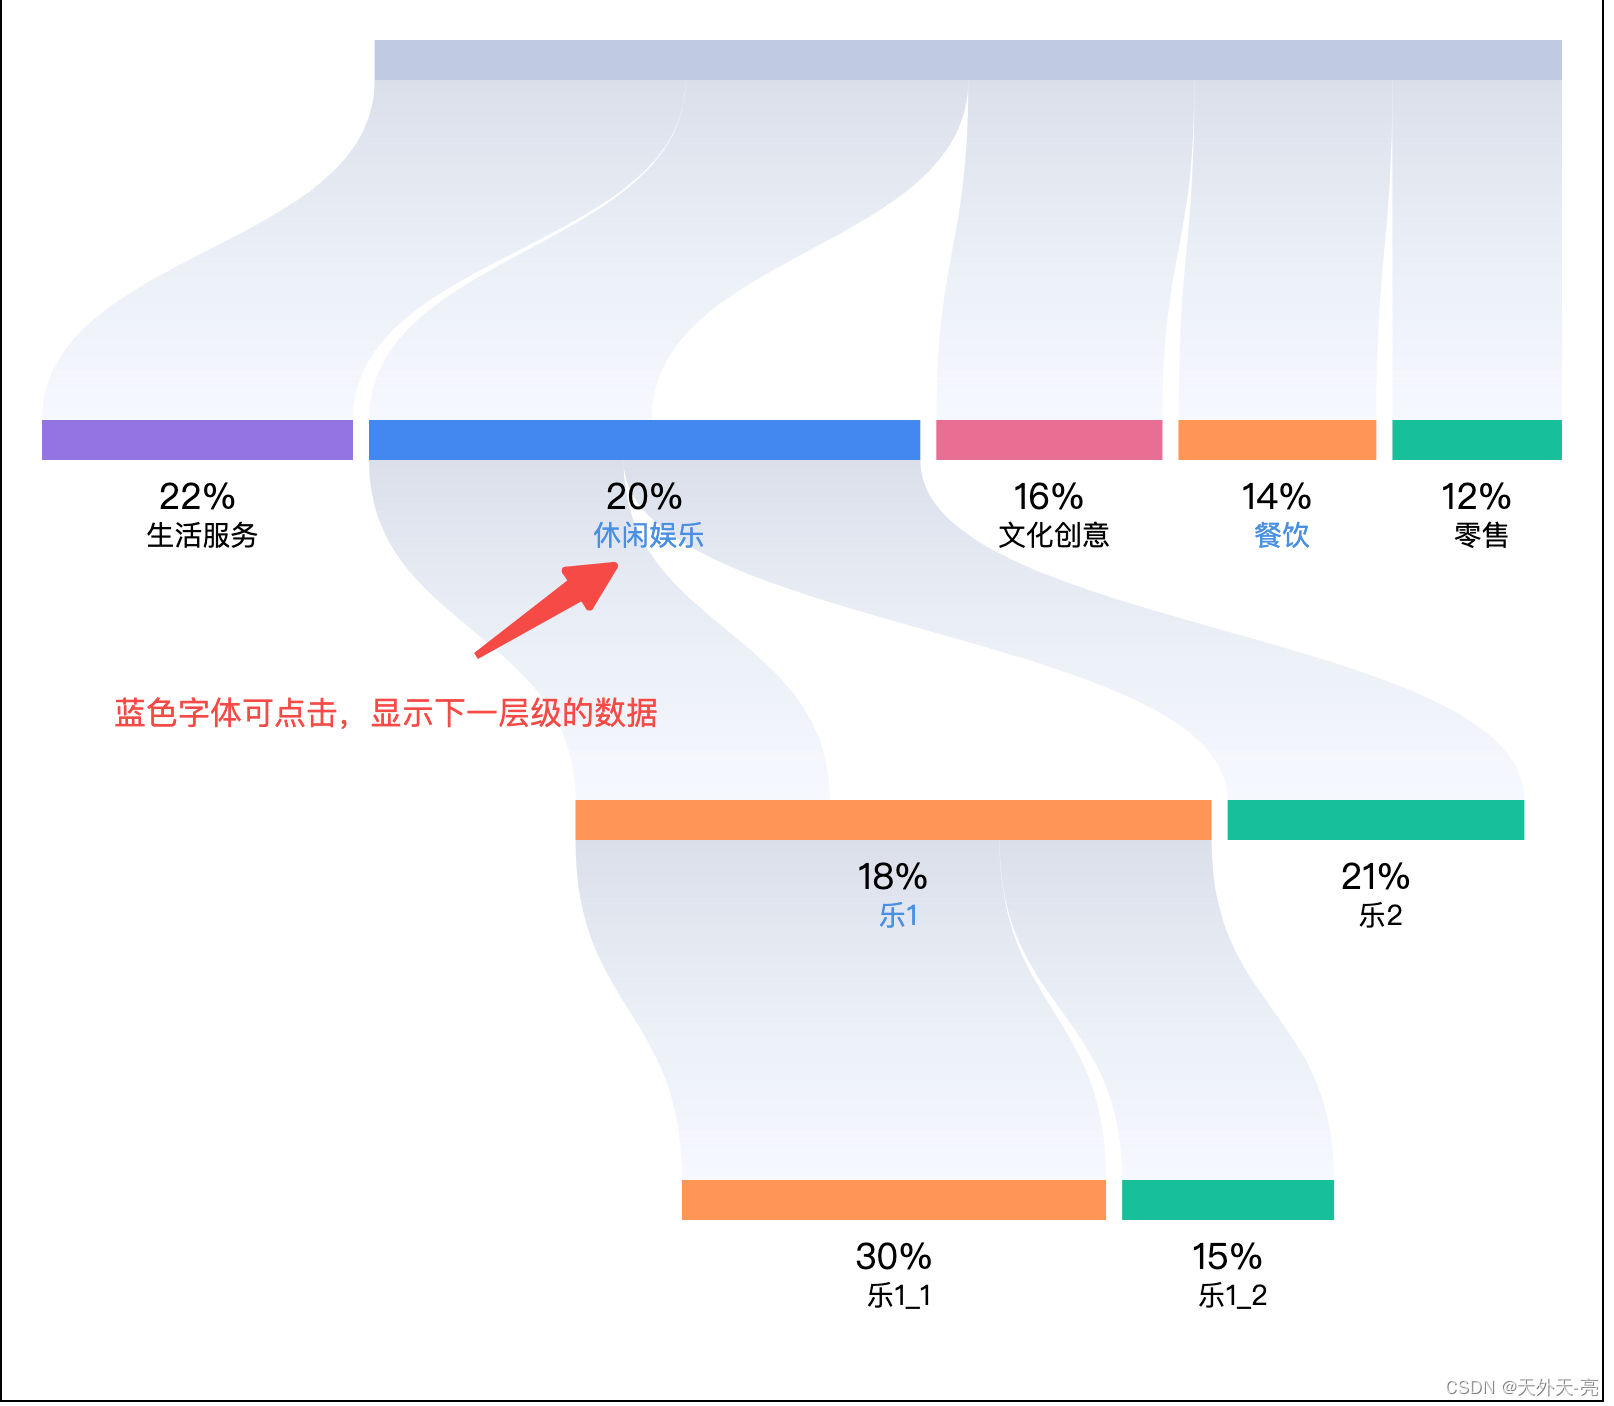
以某个商场业态数据举例,默认展示第一层级,有多层级品类字体设置了特殊的蓝色,点击展示对应的下一层级,这种设计思路也是防止全部展示导致图表重叠,而且全部展示也无法突出数据重点。
代码是:
  let box = document.querySelector('.box');
  let e = echarts.init(box);
  let colors = ['#FF9656', '#19C09B', '#4387F0', '#9474E2', '#E96E93', '#FFD300'];
  let data1 = {
    firstList: [
      {
        source: 'all',
        target: ['餐饮', '零售', '休闲娱乐', '生活服务', '文化创意'],
        value: [14, 12, 20, 22, 16]
      }
    ],
    otherList: [
      {
        source: '餐饮',
        target: ['餐1', '餐2'],
        value: [15, 20]
      },
      {
        source: '休闲娱乐',
        target: ['乐1', '乐2'],
        value: [18, 21]
      },
      {
        source: '餐1',
        target: ['餐1_1', '餐1_2'],
        value: [12, 20]
      },
      {
        source: '乐1',
        target: ['乐1_1', '乐1_2'],
        value: [30, 15]
      }
    ]
  };

  let allName = [];
  let links = [];
  let labelStatus = {};

  // 添加第一层数据
  addData(data1.firstList, true);

  let option = {
    color: [
      // '#67001f', '#b2182b', '#d6604d', '#f4a582', '#fddbc7', '#d1e5f0', '#92c5de', '#4393c3', '#2166ac', '#053061'
    ],
    tooltip: {
      trigger: 'item',
      // triggerOn: 'mousemove'
    },
    animation: false,
    series: [
      {
        type: 'sankey',
        bottom: 90,
        top: 20,
        right: 20,
        left: 20,
        nodeWidth: 20,
        nodeAlign: 'left',
        draggable: false,
        focusNodeAdjacency: false,
        orient: 'vertical',
        data: allName,
        links: links,
        label: {
          position: 'bottom',
          formatter: function (val) {
            if (val.name === 'all') return '';
            if (labelStatus[val.name]['hasNextStep']) {
              return [
                '{value| '+labelStatus[val.name]['value']+'% }',
                '{hasNextStepName| ' + labelStatus[val.name]['name'] + '}'
              ].join('\n')
            } else {
              return [
                '{value| '+labelStatus[val.name]['value']+'% }',
                '{notNextStepName| ' + labelStatus[val.name]['name'] + '}'
              ].join('\n')
            }
          },
          rich: {
            value: {
              fontSize: 18,
              height: 25,
              align: "center"
            },
            hasNextStepName: {
              fontSize: 14,
              align: "center",
              color: '#4A90E2'
            },
            notNextStepName: {
              fontSize: 14,
              align: "center",
              color: '#000'
            }
          }
        }
      }
    ]
  };

  // resetCharts();

  e.setOption(option);

  e.on('click', function (obj) {

    if (obj.name === 'all') return;

    // 判断是否在图表显示,显示就隐藏
    let hasin = removeList(obj.name, data1.otherList);
    resetCharts();
    if (hasin !== -1) return;

    // 判断有没有下一级
    let status = data1.otherList.findIndex((val, index) => {
      return val.source === obj.name;
    });
    if (status !== -1) {
      // 加入下一级
      addData([data1.otherList[status]], false);

      // 如果点击第二级 计算排它
      let isSecond = data1.firstList[0].target.findIndex((val, index) => {
        return val === obj.name;
      });
      if (isSecond !== -1) {
        data1.firstList[0].target.forEach((v, i) => {
          if (v === obj.name) return;
          removeList(v, data1.otherList);
        });
      }

      box.style.height = '700px';
      resetCharts();
    }

  });

  function unique(points) {
    let result = [];
    let obj = {};
    for (let i = 0; i < points.length; i++) {
      if (!obj[points[i].name]) {
        result.push(points[i]);
        obj[points[i].name] = true;
      }
    }
    return result;
  }

  function removeList(name, otherList) {
    let statusHas = links.findIndex((val, index) => {
      return val.source === name;
    });

    if (statusHas !== -1) {
      links = links.filter((val, index) => {
        return val.source !== name;
      });

      let indexPos = otherList.findIndex((val, index) => {
        return val.source === name;
      });

      allName = allName.filter((val, index) => {
        return otherList[indexPos].target.indexOf(val.name) === -1;
      });

      // 判断子集的子集是否在 links中 有删除
      otherList[indexPos].target.forEach((v, i) => {
        removeList(v, otherList);
      });
    }
    return statusHas;
  }

  function resetCharts() {
    option.series[0].data = allName;
    option.series[0].links = links;
    e.resize();
    e.setOption(option);
  }

  function addData(arr, status) {
    arr.forEach((v, i) => {
      // 首次加载
      if (status) {
        allName.push({
          name: v.source,
          itemStyle: {
            color: '#C1CAE1',
            borderColor: 'transparent'
          }
        });
        labelStatus[v.source] = {
          name: v.source,
          hasNextStep: true,
          value: ''
        };
      }
      v.target.forEach((val, index) => {

        // 判断是否有下一级
        let hasEle = data1.otherList.findIndex((value, ind) => {
          return value.source === val
        });

        if (hasEle === -1) {
          labelStatus[val] = {
            name: val,
            hasNextStep: false,
            value: v.value[index]
          }
        } else {
          labelStatus[val] = {
            name: val,
            hasNextStep: true,
            value: v.value[index]
          }
        }

        allName.push({
          name: val,
          itemStyle: {
            color: colors[index],
            borderColor: 'transparent'
          }
        });
        links.push({
          source: v.source,
          target: val,
          value: v.value[index],
          lineStyle: {
            color: {
              type: 'linear',
              x: 0,
              y: 0,
              x2: 0,
              y2: 1,
              colorStops: [
                {
                  offset: 0,
                  color: 'rgba(181, 191, 214, 0.5)' // 0% 处的颜色
                },
                {
                  offset: 1,
                  color: 'rgba(226, 234, 249, 0.3)' // 100% 处的颜色
                }
              ],
              global: false // 缺省为 false
            },
            opacity: 1,
            curveness: 0.5
          }
        });
      })
    });
  }
全部代码都在这了,直接复制到项目中即可看到效果。