1. The purpose of GWAS-eQTL intergration
- Is the my variant an eQTL?
- Is the leading variant of the GWAS and eQTL signal the same?
- Is my GWAS association of interest driven by an eQTL that may indiciate a functinal mechanism?
GWAS locus that colocalized with eQTL is one of the primary and scalable signal for functional follow-up analyses.
2. Install R/RStudio and packages
- Install the latest version of R or RStudio.
- Install R pakage locuscomparer.
- Install R package coloc:
if (!requireNamespace("BiocManager", quietly = TRUE))install.packages("BiocManager")BiocManager::install("snpStats")install("coloc")
3. Colocalization analysis using coloc
-
Read sample data into R:
You can download the examples files: GWAS and eQTL datasets.eqtl <- read.table(file="[path to]/Artery_Coronary_v7_eQTL_PHACTR1.txt", header=T, as.is=T); head(eqtl)gwas <- read.table(file="[path to]/CAD_GWAS.txt", header=T, as.is=T); head(gwas) -
Merge gwas and eqtl data sets by only shared “rs _ id”:
input <- merge(eqtl, gwas, by="rs_id", all=FALSE, suffixes=c("_eqtl","gwas")head(input)Optinal: provide suffix to differentiate data source from gwas or eqtl.
-
Run coloc using coloc.abf() fuction:
result <- coloc.abf(dataset1=list(pvalues=input$pval_nominal_gwas, type="cc", S=0.33, N=nrow(gwas)) dataset2=list(pvalues=input$pval_nominal_eqtl, type="quant", N=nrow(eqtl)), MAF=input$maf)Comments: coloc.abf() function needs two named lists (gwas and eqtl) that contain p-values, the type of study(“cc” for case-control studies, “quant” for quantitative traits) and sample size(N). s= the proportion of samples are cases, when type=“cc”. It also needs the minor allele frequency.
-
Read out posterior probabilities for colocalization:
H0: neither trait has a genetic association in the region
H1/H2: only trait 1/trait 2 has a genetic association in the region
H3: both traits are associated, but with different causal variants
H4: both traits are associated and share a single causal variant
A posterior probability of ≥75% is considered strong evidence of the eQTL-GWAS pair influencing both the expression and GWAS trait at a particular region.
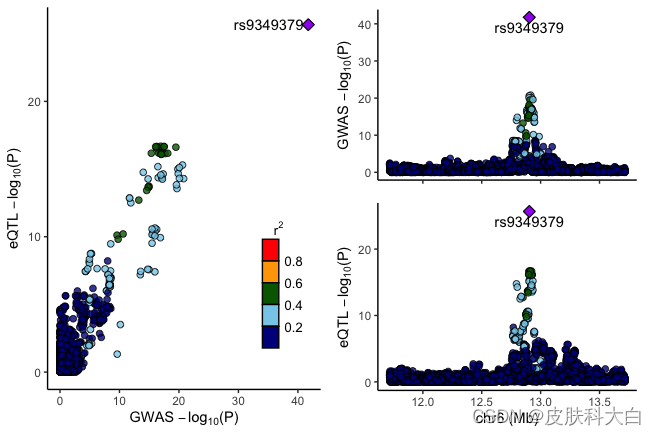
4. Visualization using locuscomparer
-
Define file names of the GWAS and eQTL data sets:
gwas_fn="[path to]/CAD_GWAS.txt"eqtl_fn="[path to]/Artery_Coronary_v7_eQTL_PHACTR1.txt"marker_col="rs_id"pval_col="pval_nominal" -
Run locuscompare to visualize:
locuscompare(in_fn1=gwas_fn, in_fn2=eqtl_fn, title1="GWAS", title2="eQTL", marker_col1= marker_col, pval_col1=pval_col, marker_col2=marker_col, pval_col2=pval_col)) -
Results output: