我在开发时,在tab控件点击切换,那么数据不变,要不显示不正确。后面看到这位博主的文章,v-if在这里挺绝的,完美解决。
版权声明:本文为CSDN博主「前端李小白」的原创文章,遵循CC 4.0 BY-SA版权协议,转载请附上原文出处链接及本声明。
原文链接:https://blog.csdn.net/qq_42268364/article/details/100105338
在tab控件上渲染多个echart图表,然后切换查看时,发现图表的宽度不正确
原因:在页面进行加载时,隐藏的图表找不到对应的div大小,所以默认给了一个大小。所以要做的就是在页面加载时,就对图表进行初始化。
网上真的是太多太多太多坑了,服了,各种能不能用的都不先自己测试一下再贴上去,真心服了这些人。本来element tabs里面有个很好解决的办法就是在tab-pane添加上lazy='true’属性即可,不过现在已经没有这个属性了!没有了!看图,
官方已经把这个属性去掉了,那么现在要怎么修改呢,这里有一个很好办法,亲测绝对有效。
原理:利用v-if属性,当切换至对应的tab时,设置其v-if的值为true即可,同时设置默认显示的tab。
代码如下:
<template>
  <div>
    <el-tabs type="card" v-model="tabItem">
      <el-tab-pane label="第一页" name="tab1">
        <charts v-if="'tab1' === tabItem"></charts>
      </el-tab-pane>
      <el-tab-pane label="第二页" name="tab2">
        <charts v-if="'tab2' === tabItem"></charts>
      </el-tab-pane>
      <el-tab-pane label="第三页" name="tab3">
        <charts v-if="'tab3' === tabItem"></charts>
      </el-tab-pane>
    </el-tabs>
  </div>
</template>

<script>
import charts from "@/components/charts.vue";
export default {
  name: "index",
  components: {
      charts
  },
  data(){
      return {
        tabItem: "tab1"
      }
  }
};
</script>

<style>
</style>
这里说明一下,一定要在把需要的echart图表做成组件来使用,不然的话一开始默认加载不到,页面是会报错的,一定要做成组件来使用。
组件里面的代码:
<template>
   <div  id="chart-part1"  style="width:100%;height:160px"></div>
</template>

<script>
export default {
  name: '',
  data () {
    return {}
  },
  mounted () {
     this.getEchartData1();
  },
  methods: {
    getEchartData1() {
      const myChart = this.$echarts.init(
        document.getElementById("chart-part1")
      );
      const option = {
        title: {
          text: "全院业务收入趋势",
          textStyle: {
            color: "#717785",
            fontSize: 14
          },
          top: "12%",
          left: "3%"
        },
        tooltip: {
          trigger: "axis"
        },
        legend: {
          top: "12%",
          left: "50%",
          itemWidth: 10,
          itemHeight: 10,
          data: ["业务", "药品", "环比"]
        },
        grid: {
          left: "3%",
          right: "4%",
          bottom: "5%",
          containLabel: true
        },
        xAxis: {
          type: "category",
          boundaryGap: false,
          splitLine: {
            show: true,
            lineStyle: {
              type: "dashed",
              color: "#cee1f0"
            }
          },
          axisLine: {
            lineStyle: {
              color: "#cee1f0"
            }
          },
          axisTick: {
            inside: true
          },
          data: ["8.12", "8.13", "8.14", "8.15", "8.16", "8.17", "8.18"]
        },
        yAxis: [
          {
            type: "value",
            name: "       万元",
            nameGap: 2,
            nameTextStyle: {
              color: "#cee1f0"
            },
            splitLine: {
              show: true,
              lineStyle: {
                color: "#cee1f0"
              }
            },
            axisLine: {
              lineStyle: {
                color: "#cee1f0"
              }
            },
            axisTick: {
              show: false
            }
          },
          {
            type: "category",
            name: "%",
            nameGap: 2,
            nameTextStyle: {
              color: "#cee1f0"
            },
            axisLine: {
              lineStyle: {
                color: "#cee1f0"
              }
            },
            axisTick: {
              show: false
            },
            data: ["0", "50", "100"]
          }
        ],
        series: [
          {
            name: "业务",
            type: "line",
            symbol: "circle",
            symbolSize: 6,
            itemStyle: {
              color: "#1295ff"
            },
            data: [30, 32, 33, 34, 35, 36, 37]
          },
          {
            name: "药品",
            type: "line",
            symbol: "circle",
            symbolSize: 6,
            itemStyle: {
              color: "#fd7c14"
            },
            data: [20, 21, 22, 23, 24, 25, 26]
          },
          {
            name: "环比",
            type: "line",
            symbol: "circle",
            symbolSize: 6,
            itemStyle: {
              color: "#08e4f8"
            },
            data: [10, 11, 12, 13, 14, 15, 16]
          }
        ]
      };
      myChart.setOption(option);
      window.addEventListener("resize", function() {
        myChart.resize();
      });
    },
  }
}
</script>

<style lang="less" scoped>

</style>
效果如下,绝对有用,
一开始加载:
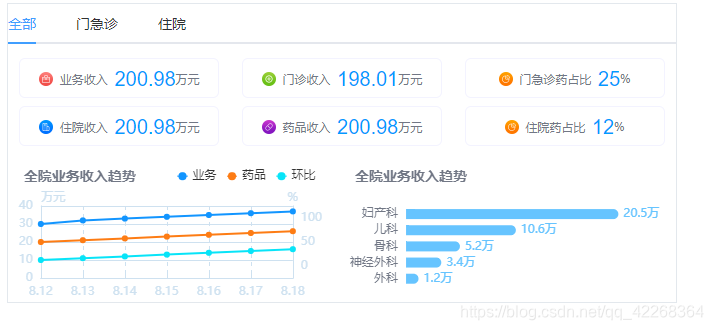
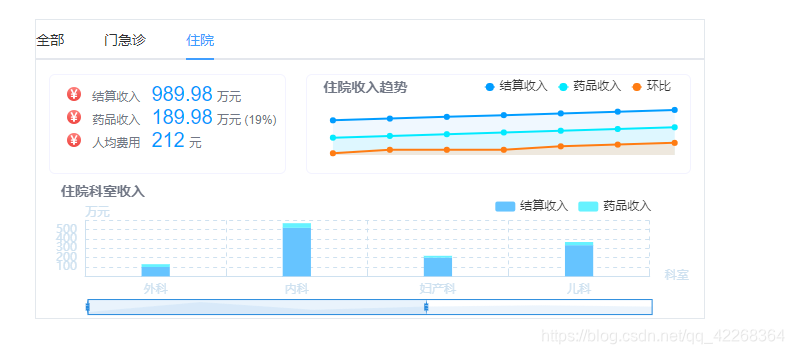
点击切换之后
如有任何问题,可以留言提问。
————————————————
版权声明:本文为CSDN博主「前端李小白」的原创文章,遵循CC 4.0 BY-SA版权协议,转载请附上原文出处链接及本声明。
原文链接:https://blog.csdn.net/qq_42268364/article/details/100105338