问题描述
要将 echarts 散点图连成线,你需要设置dataset,然后在配置项中设置连接线的系列类型为 ‘line’。
dataset: [
    {

     source: data.data }
]
解决方案:
上代码:
<template>
  <div ref="myEchart"/>
</template>

<script>
import echarts from 'echarts'

export default {


  data() {


    return {


      list:{


        name: '轨迹',
        data: [
          ['10','20'],['20','30'],['10','30'],['30','50'],['40','60'],['30','20'],['60','50'],['80','100'],['50','20'],['60','50'],['70','60'],['80','60'],
          ['100','80'],['90','50'],['50','60'],['60','70'],['70','80'],['80','60'],['60','70'],['60','100'],['60','80'],['40','60'],['50','90'],['100','80']
        ]
      }
    }
  },
  mounted() {


    this.$nextTick(()=>{


       this.initChart()
    })
  },
  beforeDestroy() {


    if(!this.chart) {


      return
    }
    this.chart.dispose()
    this.chart = null
  },
  methods: {


    initChart() {


      this.chart = echarts.init(this.$refs.myEchart);
      this.setOptions(this.list)
    },
    setOptions(data) {


      this.chart.setOption({


        tooltip: {


          trigger: 'axis',
        },
        xAxis: {


          splitLine: {


            show: false
          },
          axisLine: {


            lineStyle: {


              type: 'solid',
              color: '#fff',
              width: '1'
            }
          },
          axisLabel: {


            textStyle: {


              color: "#fff",
              fontSize: "12"
            }
          }
        },
        yAxis: {


          axisTick: {


            show: false
          },
          splitLine: {


            show: false
          },
          axisLabel: {


            textStyle: {


              color: "#fff",
              fontSize: "10"
            }
          },
          axisLine: {


            lineStyle: {


              type: 'solid',
              color: '#fff',
              width: '1'
            }
          },
        },
        dataset: [
            {

     source: data.data }
        ],
        series:  [
          {


            name: 'scatter',
            type: 'scatter'
          },
          {


            name: data.name,
            type: 'line',
            smooth: true
          }
        ]
      })
    }
  }
}
</script>
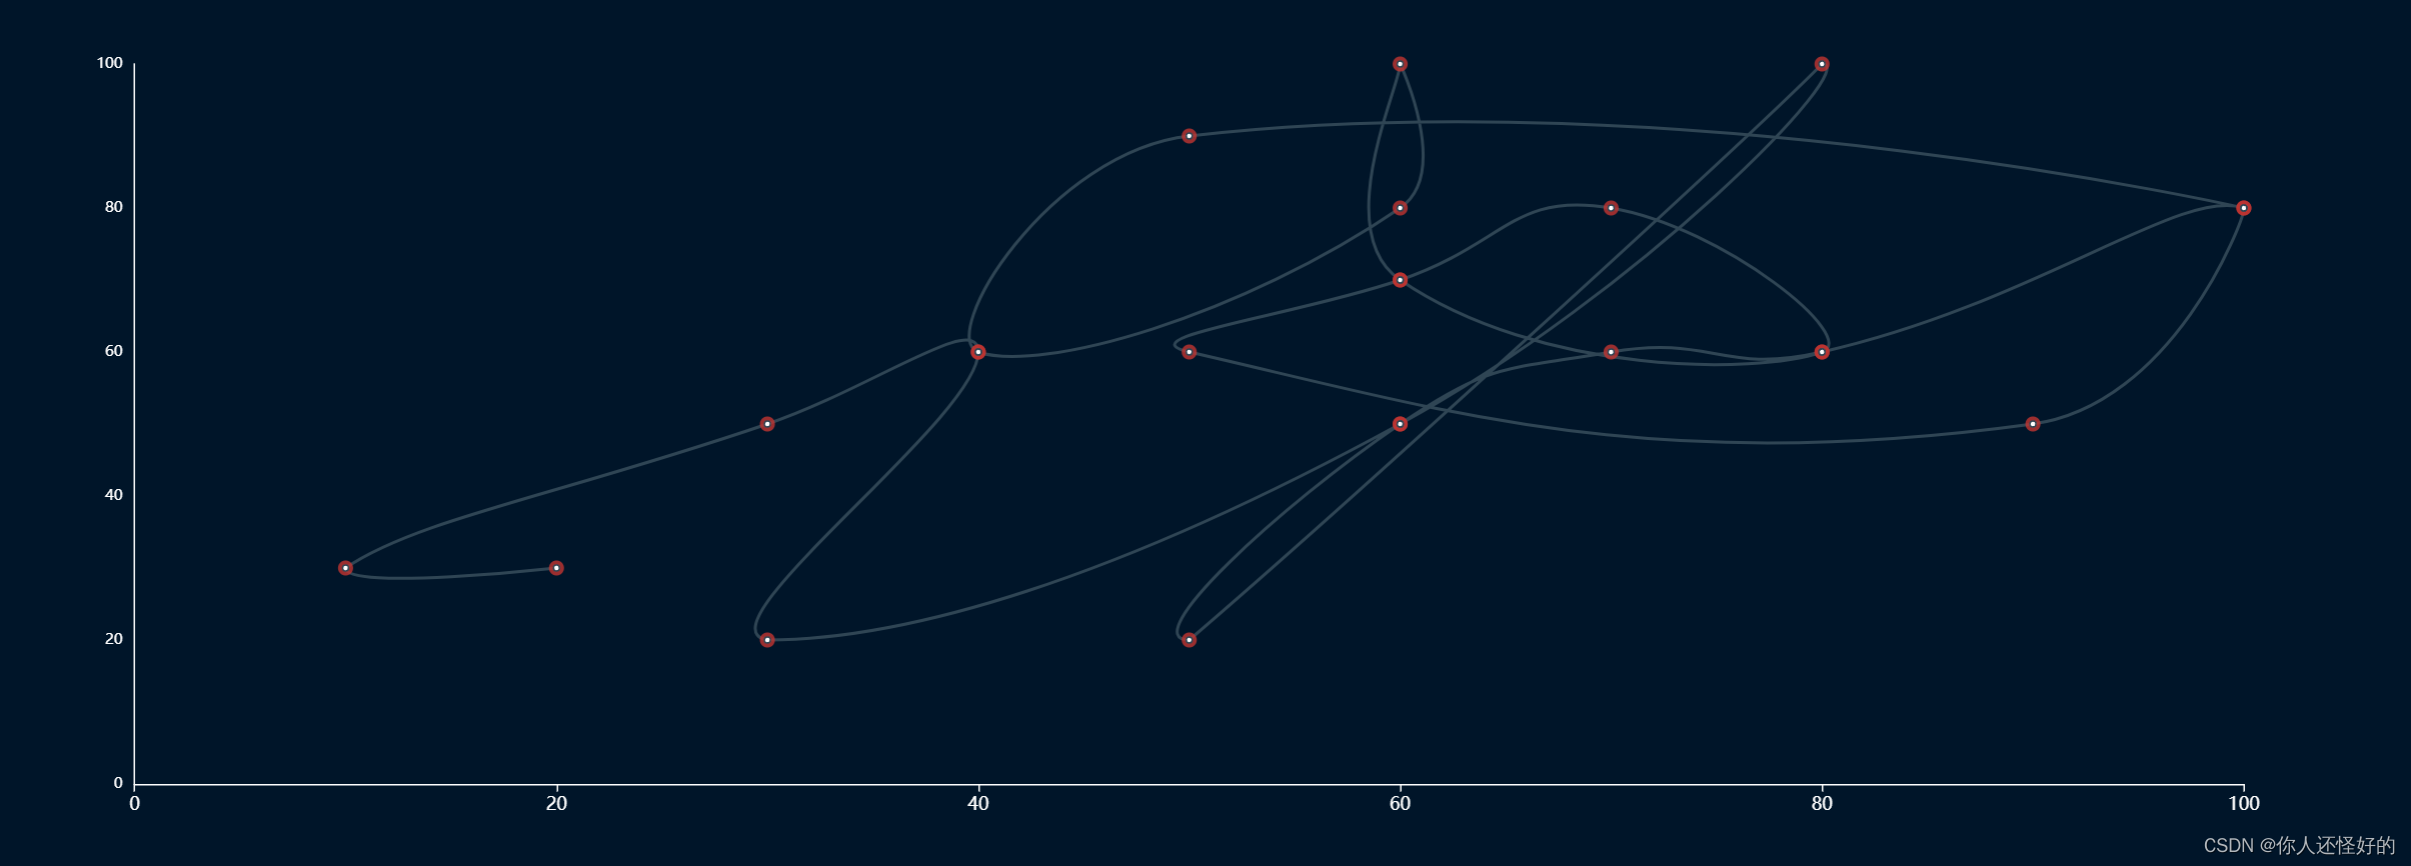
上效果图