Pandas、Seaborn相关练习
Anscombe’s quartet
Anscombe’s quartet comprises of four datasets, and is rather famous. Why? You’ll find out in this exercise.
Part 1
For each of the four datasets…
- Compute the mean and variance of both x and y
- Compute the correlation coefficient between x and y
- Compute the linear regression line: y=β0+β1x+ϵ (hint: use statsmodels and look at the Statsmodels notebook)
Part 2
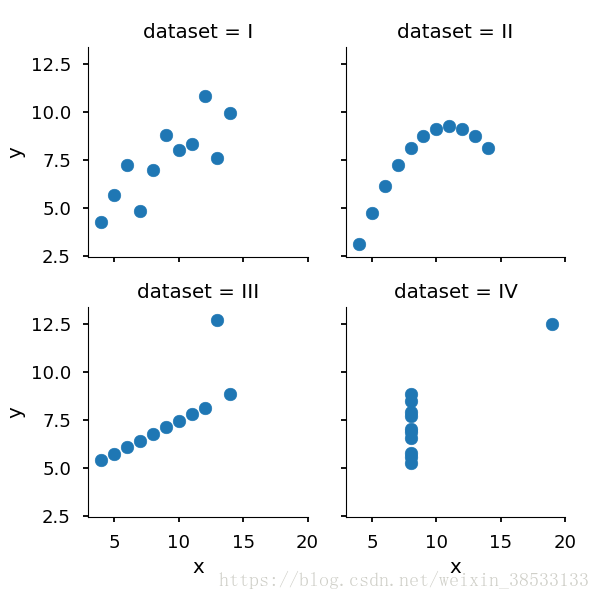
Using Seaborn, visualize all four datasets.
hint: use sns.FacetGrid combined with plt.scatter
从Anscombe.csv导入数据集。(可查阅相关资料了解Anscombe’s Quartet)
Part1:分别求x、y的均值、方差,x和y的相关系数,及y关于x的线性回归方程。
Part2:用Seaborn对四个数据集进行可视化。
代码
import numpy as np
import pandas as pd
import matplotlib.pyplot as plt
import seaborn as sns

import statsmodels.api as sm

sns.set_context("talk")

anscombe = pd.read_csv('data/anscombe.csv')

''' part 1 ''' # 四个数据集求得结果相似,所以只记录近似值。
mx = anscombe.groupby('dataset').mean().x
my = anscombe.groupby('dataset').mean().y
vx = anscombe.groupby('dataset').var().x
vy = anscombe.groupby('dataset').var().y
print('mx\n', mx)
print('my\n', my)
print('vx\n', vx)
print('vy\n', vy)
# 9 7.50
# 11 4.12

r = anscombe.groupby('dataset').corr()
print('corr\n', r)
# 0.816
for a in [anscombe[anscombe.dataset == i] for i in ['I', 'II', 'III', 'IV']]:
    xs = sm.add_constant(np.array(a.x))
    ys = np.array(a.y)
    lin_model = sm.OLS(ys, xs).fit()
    #print(lin_model.summary())
    print('beta1, beta0 = ', lin_model.params)
# 3 0.5

''' part 2 '''
sns.FacetGrid(data=anscombe, col='dataset', col_wrap=2).map(plt.scatter, 'x', 'y')
plt.show()