根据官方文档:
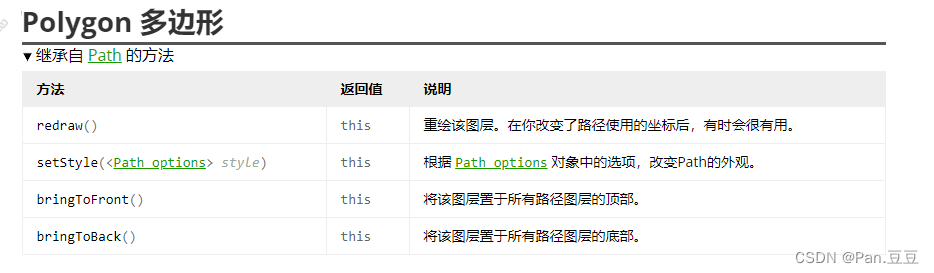
绘制多边形:
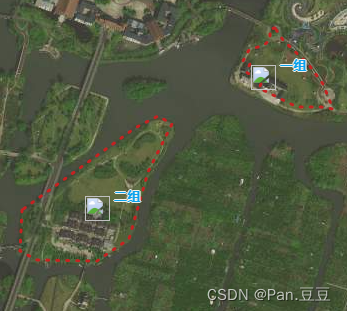
var polygon = L.polygon(field.geoC, {
                            weight: 3,
                            dashArray: "2,8",
                            color: '#C72121',
                            fillOpacity: 0
                            }).addTo(map);
效果图:

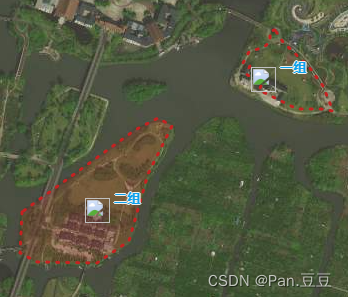
修改多边形填充透明度为0.2:
polygon.setStyle({
                    fillOpacity: 0.2,
                 });
效果图:

实例:leaflet地图上多个多边形实现点击Marker标记改变多边形透明度
map.polygonArr=[];
var result = [
        {
          latCenter: "27.966006",
          lngCenter: "120.715891",
          name: "一组",
          geoC: [
            [27.96694, 120.716149],
            [27.966916, 120.716037],
            [27.966717, 120.716031],
            [27.966622, 120.715903],
            [27.966532, 120.715592],
            [27.966319, 120.715447],
            [27.966257, 120.715608],
            [27.966111, 120.715516],
            [27.965912, 120.715865],
            [27.965812, 120.715795],
            [27.965452, 120.716616],
            [27.965452, 120.71712],
            [27.965414, 120.717383],
            [27.965874, 120.717163],
            [27.966248, 120.716863],
            [27.966722, 120.716305],
          ],
        },
        {
          latCenter: "27.963524",
          lngCenter: "120.712329",
          name: "二组",
          geoC: [
            [27.96349, 120.710715],
            [27.962713, 120.710662],
            [27.962543, 120.711037],
            [27.962533, 120.711209],
            [27.962533, 120.712067],
            [27.962524, 120.712325],
            [27.962941, 120.713011],
            [27.96422, 120.713408],
            [27.96513, 120.713934],
            [27.965281, 120.713623],
            [27.965054, 120.713129],
          ],
        }
      ],//假设有两个多边形数据

$.each(result, function (i, field) {
        var polygon = L.polygon(field.geoC, {
          weight: 3,
          dashArray: "2,8",
          color: "#C72121",
          fillOpacity: 0,
        }).addTo(map);
        map.polygonArr.push(polygon);

        field.spotTypeId = "1";
        var marker = L.marker([field.latCenter, field.lngCenter]).setExtData(field);

        //设置名字
        marker.bindTooltip(field.name, {
          permanent: true,
          interactive: true,
          direction: "right",
        });
        //点击标记
        marker.on("click", function (e) {
            //重新渲染所有多边形透明度为0
          for (var i = 0; i < map.polygonArr.length; i++) {
            map.polygonArr[i].setStyle({
              fillOpacity: 0,
            });
          }
          //当前多边形透明度变为0.2
          polygon.setStyle({
            fillOpacity: 0.2,
          });
          var _marker = this;
          // 将地图放大到多边形的位置
          self.map.fitBounds(polygon.getBounds());
    })
})
效果图: