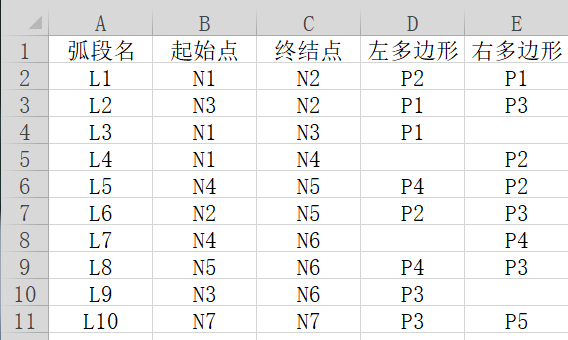
这是我们专业课中一个小小的作业吧,备个份在这~~~
(1)创建Excel文件

(2)程序源代码

  1 import tkinter
  2 import tkinter.filedialog as fdg
  3 import turtle as f
  4 import xlrd
  5
  6
  7
  8 # 创建可视化用户选择界面
  9 def User_UI():
 10     def open_file():
 11         usr_file_pth = fdg.askopenfilename()
 12         usr_file.set(usr_file_pth)
 13     def paint():
 14         path = usr_file.get()
 15         workbook = xlrd.open_workbook(path)
 16         Data_sheet = workbook.sheets()[0]
 17         sheet_name = Data_sheet.name
 18         rowNum = Data_sheet.nrows  # 行
 19         colNum = Data_sheet.ncols  # 列
 20
 21         # 获取所有单元格的内容
 22         list_inc = []
 23         for i in range(rowNum):
 24             rowlist = []
 25             for j in range(colNum):
 26                 rowlist.append(Data_sheet.cell_value(i, j))
 27             list_inc.append(rowlist)
 28
 29         # 根据用户选择筛选出有用的记录
 30         usr_cho_p = usr_paint.get()
 31         chose_li = []
 32         for i in list_inc:
 33             for j in i:
 34                 if usr_cho_p in j:
 35                     chose_li.append(i)
 36         # 判断用户所需数据是否在每行纪录最右边
 37         end = []
 38         for data in chose_li:
 39             if usr_cho_p == data[4]:
 40                 end.append(data)
 41             elif usr_cho_p != data[4]:
 42                 data[1], data[2] = data[2], data[1]
 43                 data[3], data[4] = data[4], data[3]
 44                 end.append(data)
 45
 46         # 绘图函数
 47         # 定义画布以及画笔属性
 48         f.hideturtle()
 49         f.screensize(800, 700, 'white')
 50         point_list = []
 51         POINT = {
 52             'N1': (-300, 250),
 53             'N2': (-100, 0),
 54             'N3': (-250, -250),
 55             'N4': (150, 300),
 56             'N5': (180, 20),
 57             'N6': (350, -150),
 58             'N7': (150, -120),
 59         }
 60         for point in end:
 61             # 书写点名(红色)
 62             f.penup()
 63             f.pencolor('red')
 64             f.goto(POINT[point[1]])
 65             f.pendown()
 66             f.write(point[1], font=('黑体', 25))
 67             # 显示点
 68             f.penup()
 69             f.pencolor('black')
 70             f.goto(POINT[point[1]])
 71             f.pendown()
 72             f.write('*', font=('黑体', 15))
 73             point_list.append(point[1])
 74         # 连接点
 75         f.pencolor('blue')
 76         f.pensize(3)
 77         f.hideturtle()
 78         f.speed(2)
 79         score = len(point_list)
 80         for j in range(score):
 81             if j < score - 1:
 82                 f.penup()
 83                 f.goto(POINT[point_list[j]])
 84                 f.pendown()
 85                 f.goto(POINT[point_list[j+1]])
 86             else:
 87                 f.penup()
 88                 f.goto(POINT[point_list[score-1]])
 89                 f.pendown()
 90                 f.goto(POINT[point_list[0]])
 91         f.done()
 92
 93
 94
 95     root = tkinter.Tk()
 96     root.title('User Chose')
 97     root.geometry('380x130')
 98     root.resizable(width=False, height=False)
 99
100     show_label = tkinter.Label(root,text='请选择xls文件以导入:',font=('黑体',11),fg='#4F4F4F')
101     show_label.place(x=10,y=10)
102     chose_btn = tkinter.Button(root,text='选择文件',font=('黑体',10),bg='orange',bd=2,command=lambda :open_file())
103     chose_btn.place(x=10,y =35)
104     usr_file = tkinter.Variable()
105     file_pth = tkinter.Label(root,textvariable=usr_file,width=43).place(x=80,y=35)
106     show_label = tkinter.Label(root,text='请输入要绘制的图形代号:',font=('黑体',11),fg='#4F4F4F')
107     show_label.place(x=10,y=60)
108     usr_paint = tkinter.Variable()
109     file_pth = tkinter.Entry(root,textvariable=usr_paint,width=6).place(x=200,y=60)
110     start_btn = tkinter.Button(root,text='开始绘图',font=('黑体',10),bg='orange',bd=2,command=lambda :paint())
111     start_btn.place(x=140,y=90)
112     root.mainloop()
113
114
115 User_UI()
