日志中心ELK单节点及集群搭建手册
1、ELK日志中心介绍
日志中心,通过收集、缓冲、存储、展示的标准日志中心架构,收集各应用产生的本地日志数据,进行汇总,供最终检索。
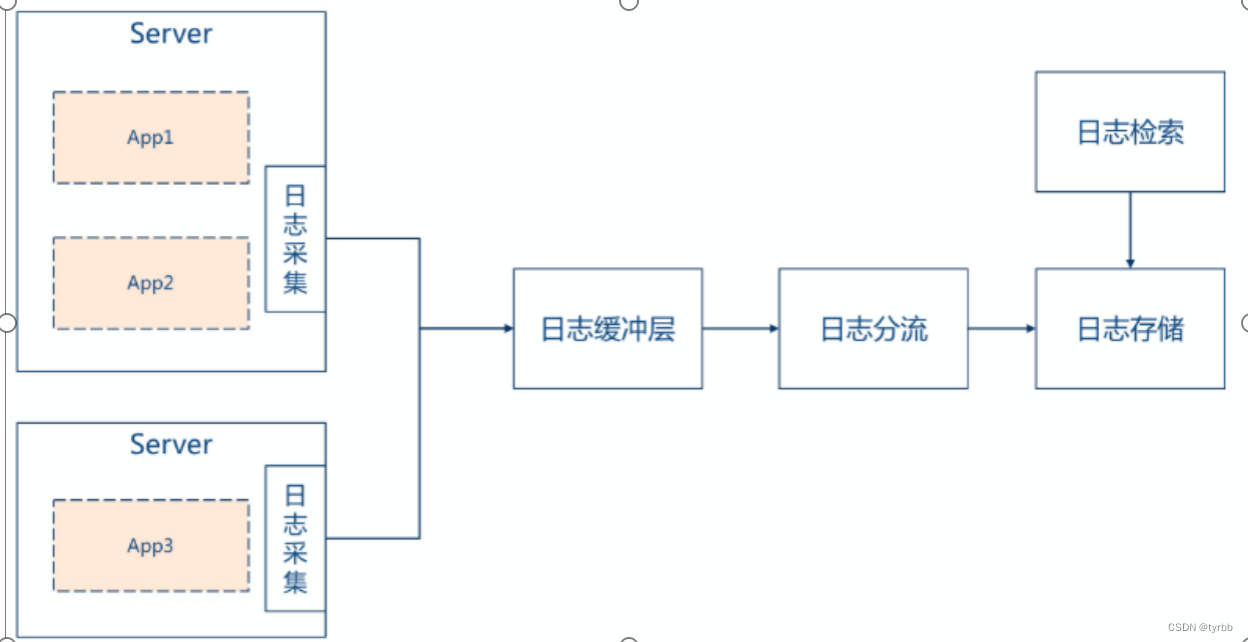
ELK的工作原理如下(懂得其中原理,才可部署一个高可用的ELK平台):Logstash收集APPServer(应用服务器)产生的log,并存放到Elasticsearch群集中,而Kibana则从Elasticsearch群集中查询数据生成图表,在返回给browser(浏览器)。简单来说,进行日志处理分析,一般需要以下几个步骤:
1) Logstash将日志进行集中化管理。
2) 将日志格式化(Logstash)并输出到Elasticsearch。
3) Elasticsearch对格式化后的数据进行索引和存储。
4) Kibana对前端数据的展示。
提示:
采集使用filebeat 6.2.4,缓冲Kafka 2.11,分流logstash 5.6.8,存储Elasticsearch 5.6.8。
https://artifacts.elastic.co/downloads/elasticsearch/elasticsearch-oss-7.5.0-linux-x86_64.tar.gz
Logstash下载地址:
https://www.elastic.co/cn/downloads/logstash
Kibana下载地址:
https://www.elastic.co/cn/downloads/kibana
2、安装与配置
本节包含如下几部分内容。
1.安装Elasticsearch
2.安装LogStash
3.安装Kibana
4.安装Filebeat
说明:
本章节均已单实例部署进行介绍,如用户需要部署集群模式,请参考官方文档。
如下安装包配置文件内容只列出关键配置项,其余内容省略(均是缺省配置值),详情请参考官方文档。
前提需要java环境:Elasticsearch requires at least Java 8
2.1 安装elasticSearch
将创建$HOME下application目录,将elasticsearch-7.5.0-linux-x86_64.tar.gz放该目录下,并进行解压。
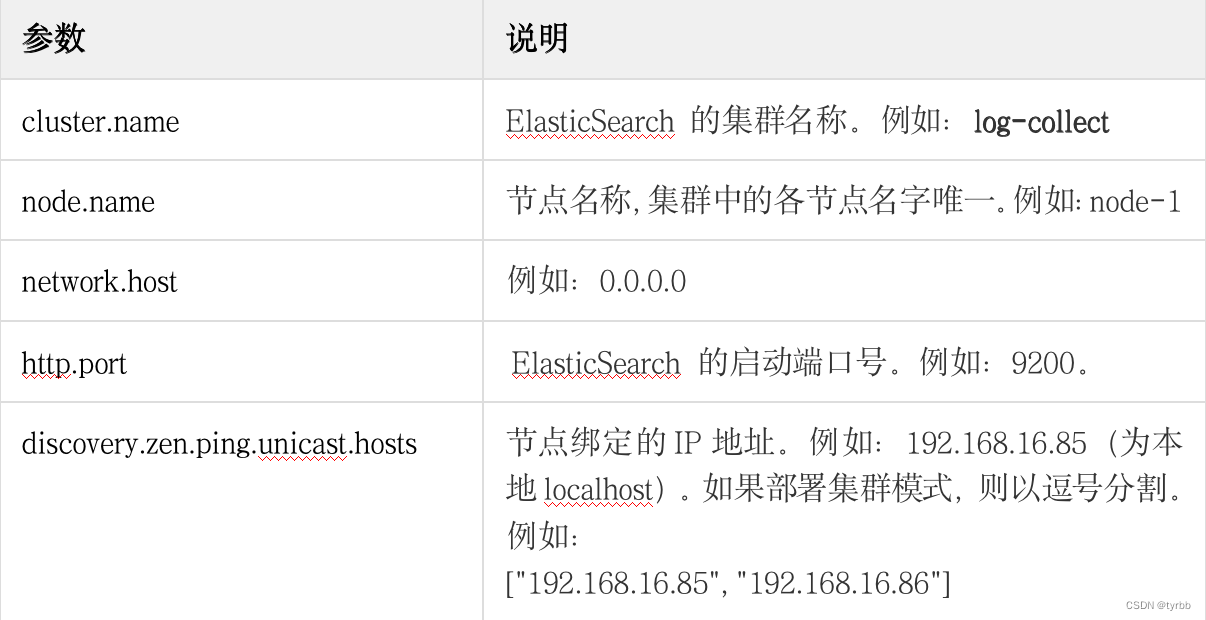
2.1.1 在“elasticsearch-7.5.0-linux-x86_64”目录下,执行如下命令,参照linux环境下Elasticsearch安装参数说明编辑elasticsearch.yml文件。
$ cd elasticsearch-7.5.0-linux-x86_64/
$ vim config/elasticsearch.yml
Elasticsearch.yml  5.6版本
#(略....)
#
#---------------------------------- Cluster -----------------------------------
#
#Use a descriptive name for your cluster:
#
cluster.name: my-application   #集群名
#
#------------------------------------ Node ------------------------------------
#
#Use a descriptive name for the node:
#
node.name: node-1  #节点名
#
#Add custom attributes to the node:
#
node.attr.rack: r1
#
#----------------------------------- Paths ------------------------------------
#Path to directory where to store the data (separate multiple locations by comma):
path.data: /path/to/data   #数据文件路径
#Path to log files:
#
path.logs: /path/to/logs    #日志文件路径
#----------------------------------- Memory -----------------------------------
#Lock the memory on startup:
#
#bootstrap.memory_lock: true
#
#(略....)
#---------------------------------- Network -----------------------------------
#Set the bind address to a specific IP (IPv4 or IPv6):
#
network.host: 192.168.0.1  #绑定的IP地址
#
#Set a custom port for HTTP:
#
http.port: 9200    #服务端口
#For more information, consult the network module documentation.
#
#--------------------------------- Discovery ----------------------------------
#
#Pass an initial list of hosts to perform discovery when new node is started:
#The default list of hosts is ["127.0.0.1", "[::1]"]   #  允许访问的地址列表
#
discovery.zen.ping.unicast.hosts: ["host1", "host2"]
#
#Prevent the "split brain" by configuring the majority of nodes (total number of master-eligible nodes / 2 + 1):
#
node.master: true
discovery.zen.minimum_master_nodes:2       #集群中至少nodes/2 + 1为主节点,避免脑裂现象
#
#For more information, consult the zen discovery module documentation.
#---------------------------------- Gateway -----------------------------------
#
#Block initial recovery after a full cluster restart until N nodes are started:
#
#gateway.recover_after_nodes: 3
#For more information, consult the gateway module documentation.
#---------------------------------- Various -----------------------------------
#Require explicit names when deleting indices:
#
#action.destructive_requires_name: true
#以下是为了避免X-PACK插件与head冲突导致elasticsearch-head无法正常连接elasticsearch而配置的。
http.cors.enabled: true
http.cors.allow-origin: "*"
http.cors.allow-headers: Authorization,X-Requested-With,Content-Length,Content-Type
7.5版本
cluster.name: log-collect
node.name: yelksvc9
network.host: 0.0.0.0
http.port: 9200
discovery.zen.ping.unicast.hosts: [“11.104.34.155”,“11.104.34.156”,“11.104.34.157”]
cluster.initial_master_nodes: [“yelksvc7”,“yelksvc8”]
node.master: true
discovery.zen.minimum_master_nodes: 2
2.1.2 执行如下命令,启动服务。
$ cd elasticsearch-7.5.0-linux-x86_64/
$ bin/elasticsearch -d
说明:
如果启动报错:max file descriptors [4096] for elasticsearch process is too low, increase to at least [65536],请执行如下命令。
ulimit -n 65536
遇到如下错误解决方案:
ERROR: [2] bootstrap checks failed
[1]: max file descriptors [65535] for elasticsearch process is too low, increase to at least [65536]
[2]: max virtual memory areas vm.max_map_count [65530] is too low, increase to at least [262144]
ulimit -n 65536

vi /etc/sysct.conf
最后一行添加:
vm.map_map_count=262144
sysct -p
如果执行完后,还报错如果启动报错:max file descriptors [4096] for elasticsearch process is too low, increase to at least [65536],请ulimit -Sn;ulimit -Hn;ulimit -Hu查看当前值,如果不是设置的值,需要检查配置文件/etc/security/limits.conf中是否配置了
-
soft nofile 65536
-
hard nofile 65536
-
soft nproc 65536
-
hard nproc 65536
然后执行环境变量使其生效,然后再使用ulimit -Sn查看值是否为65536
2.1.3 执行如下命令,启动成功如下图所示。
$ curl http://localhost:9200/?pretty
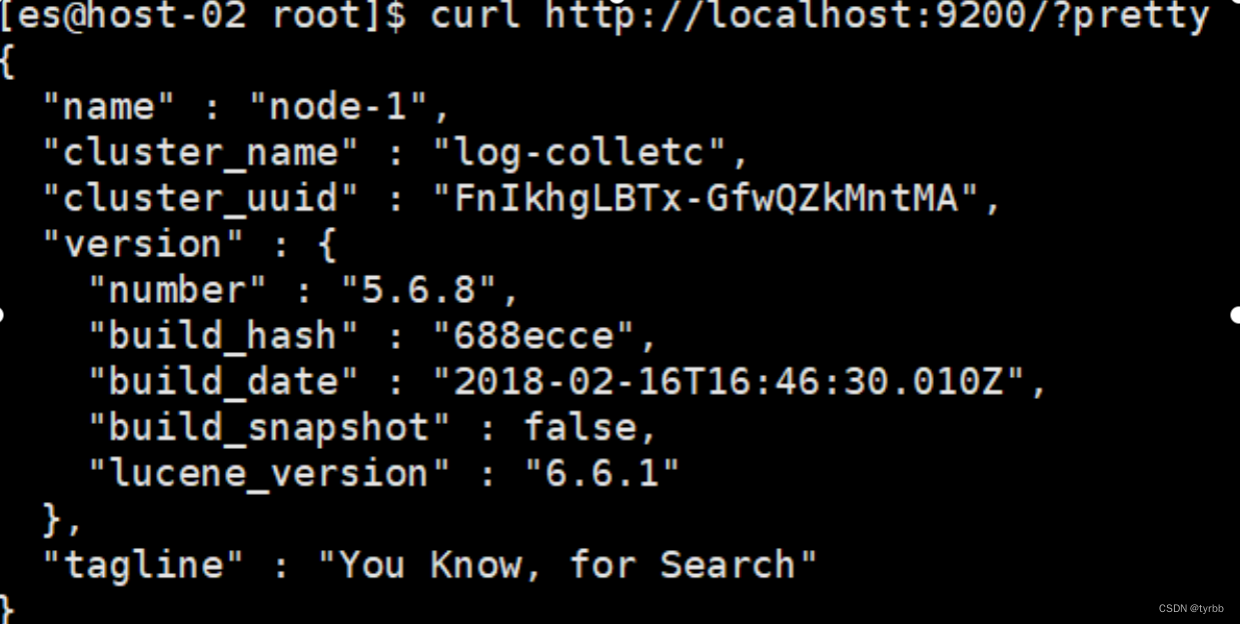
【ElasticSearch的9300和9200端口的区别】
9200 是ES节点与外部通讯使用的端口。它是http协议的RESTful接口(各种CRUD操作都是走的该端口,如查询:http://localhost:9200/user/_search)。
9300是ES节点之间通讯使用的端口。它是tcp通讯端口,集群间和TCPclient都走的它。(java程序中使用ES时,在配置文件中要配置该端口)
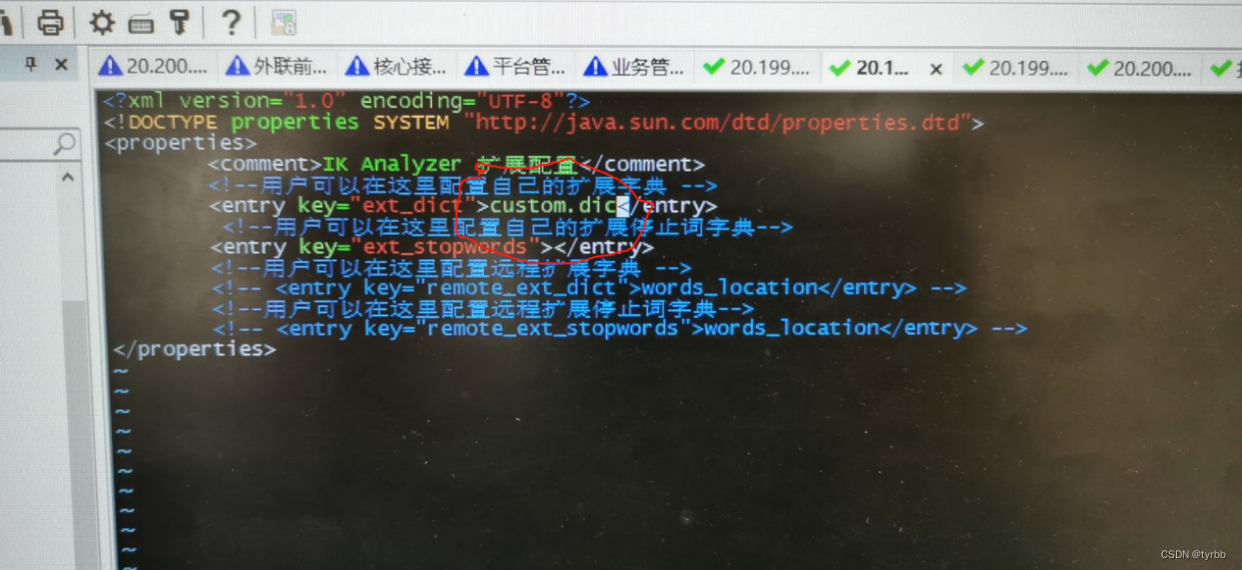
【分词器插件elasticsearch-analysis-ik】
https://github.com/medcl/elasticsearch-analysis-ik/releases
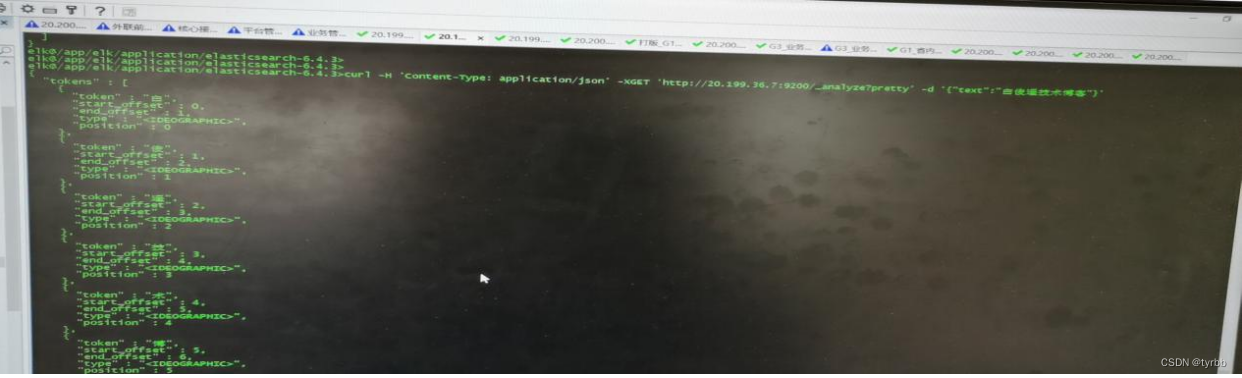
Elasticsearch 默认已经含有一个分词法standard,默认的分词器会把中文分成单个字来进行全文检索,不是我们想要的结果!
如果未安装,则测试
curl -H 'Content-Type: application/json' -XGET 'localhost:9200/_analyze?pretty' -d '{"text":"测试1"}'
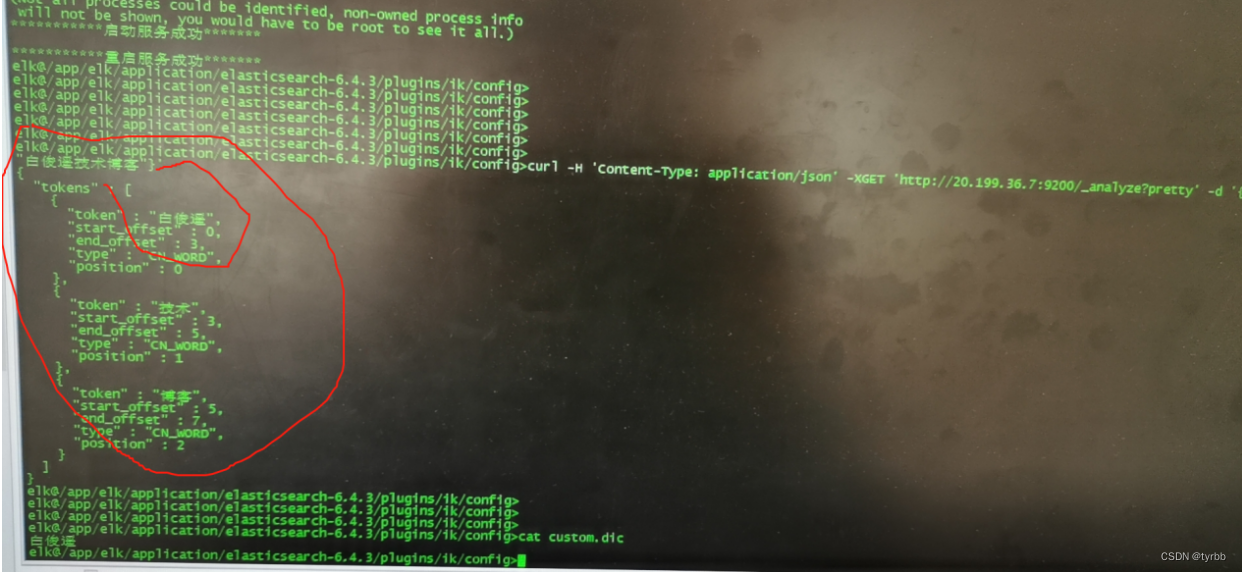
安装后,则测试如下:
curl -H 'Content-Type: application/json' -XGET 'localhost:9200/_analyze?pretty' -d '{"analyzer":"ik_max_word","text":"测试2"}'

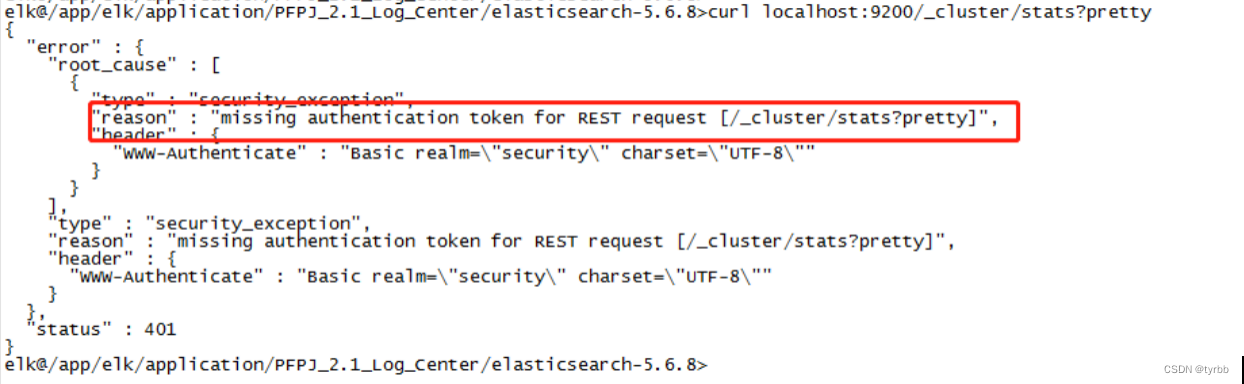
【查看el集群状态】
curl --user elastic:changeme localhost:9200/_cluster/stats?Pretty
【查看el节点状态】
curl --user elastic:changeme http://11.104.34.149:9200/_nodes/process?pretty
【查看el集群健康】
curl --user elastic:changeme localhost:9200/_cluster/health?Pretty
【查看el属性有哪些】
curl --user elastic:changeme localhost:9200/_cat/ ,会返回可以查看的属性
el中删除数据文件方法
datetime=date +%Y.%m.%d -d "3 days ago"
curl -XDELETE "http://127.0.0.1:9200/logstash-2017.08.19"
2.2 安装LogStash
LogStash 有多种安装形式,本节主要以压缩包解压安装为例进行介绍。
之所以使用 kafka 来进行数据存储,是为了减少 Es 集群前端的压力,所以加上了消息队列 Kafka 作为一个过渡。
LogStash的运行需要指定一个配置文件来指定数据的流向,在“logstash-7.5.0.tar.gz/config”目录下创建一个“log-collect.conf”文件,其内容如下。
log-collect.conf
#日志导入
input {
kafka {
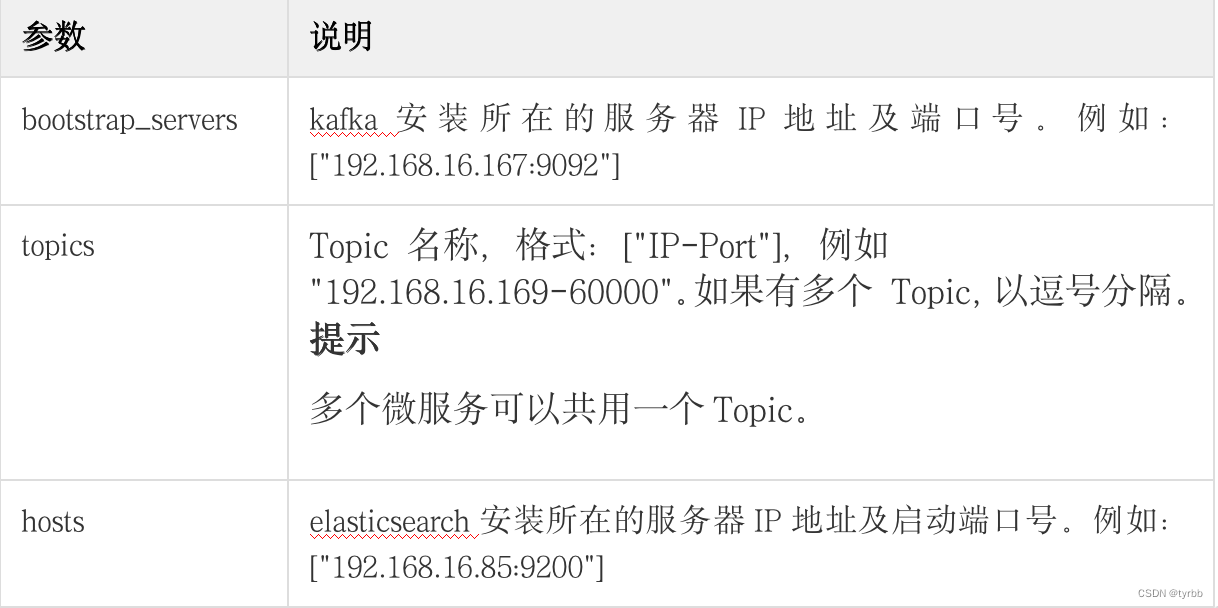
bootstrap_servers => ["192.168.16.167:9092"]
#或
zk_connect => "192.168.4.1:2181,192.168.4.2:2181,192.168.4.3:2181"
client_id => "eoslog"
group_id => "eoslog"
auto_offset_reset => "latest"
topics => ["192.168.16.169-60000","192.168.16.169-60001","192.168.16.169-60002"]
type => "eos"
codec => "json"
consumer_threads => 5
decorate_events => true
compression_type => "snappy" # 压缩方式
}
}
input {
tcp {
port => 8888
mode => "server"
ssl_enable => false
}
tcp {
port => 9999
mode => "server"
ssl_enable => false
}
}
input {
redis {
data_type => "list"
type => "redis-input"
key => "logstash:redis"
host => "192.168.212.37"
port => 6379
threads => 5
codec => "json"
}
}
# 日志筛选匹配处理
filter{
grok {
match => {
"source" => "%{GREEDYDATA}/%{GREEDYDATA:app}-%{GREEDYDATA:logtype}.log" }
add_field => {
"appID" => "%{app}" }
add_field => {
"logType" => "%{logtype}" }
}
}
# 日志匹配输出,输出到ES中
output {
elasticsearch {
hosts => ["11.104.34.149:9200"]
action => "index"
index => "eos=%{+YYYY.MM.dd}"
user => elastic #安装x-pack后,需要配置认证
password => changeme #安装x-pack后,需要配置认证
}
}
output {
elasticsearch {
hosts => "192.168.212.37:9201"
index => "logstash-test"
}
stdout {
codec => rubydebug {
}
}
}
说明:
配置LogStash输出日志到ElasticSearch中。
- 在“PFPJ_2.1_Log_Center\logstash-5.6.8\bin”目录下,执行如下命令,安装LogStash。
Unix
#./logstash -f ../config/log-collect.conf --config.reload.automatic
2.3 安装Kibana
1.解压kibana-7.5.0-linux-x86_64.tar.gz
2.用文本编辑器打开“kibana-7.5.0-linux-x86_64/config”目录下的“kibana.yml”文件,配置如下参数。
kibana.yml
# Kibana is served by a back end server. This setting specifies the port to use.
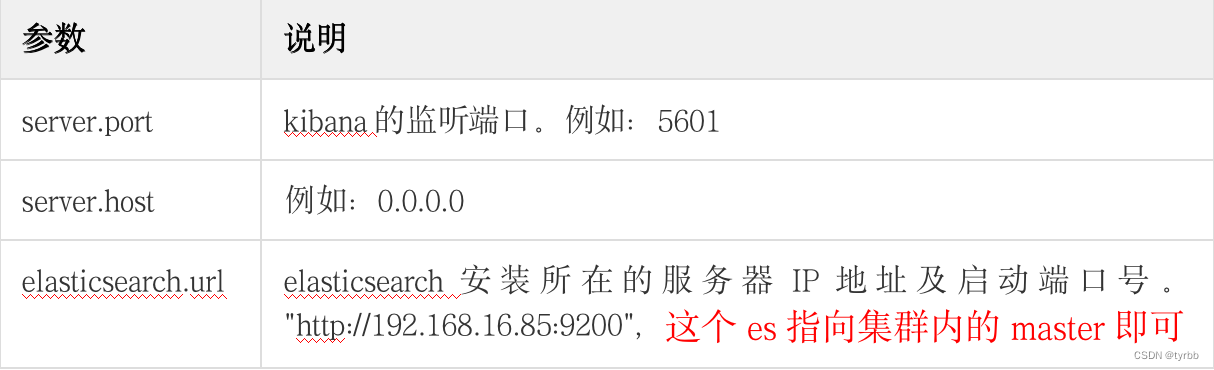
server.port: 5601
# Specifies the address to which the Kibana server will bind. IP addresses and host names are both valid values.
# The default is 'localhost', which usually means remote machines will not be able to connect.
# To allow connections from remote users, set this parameter to a non-loopback address.
server.host: 0.0.0.0
# Enables you to specify a path to mount Kibana at if you are running behind a proxy. This only affects
# the URLs generated by Kibana, your proxy is expected to remove the basePath value before forwarding requests
# to Kibana. This setting cannot end in a slash.
#server.basePath: ""
# The maximum payload size in bytes for incoming server requests.
#server.maxPayloadBytes: 1048576
# The Kibana server's name. This is used for display purposes.
#server.name: "your-hostname"
# The URL of the Elasticsearch instance to use for all your queries.
elasticsearch.url: "http://192.168.16.85:9200"
- 在“其bin”目录下,执行如下命令,安装Kibana。
# ./kibana
2.4 安装Kafka
2.4.1 配置zookeeper
- 用文本编辑器打开“PFPJ_2.1_Log_Center\kafka_2.11-0.10.1.0\config”目录下的“zookeeper.properties”文件,配置如下参数。
zookeeper.properties
(略……)
# the directory where the snapshot is stored.
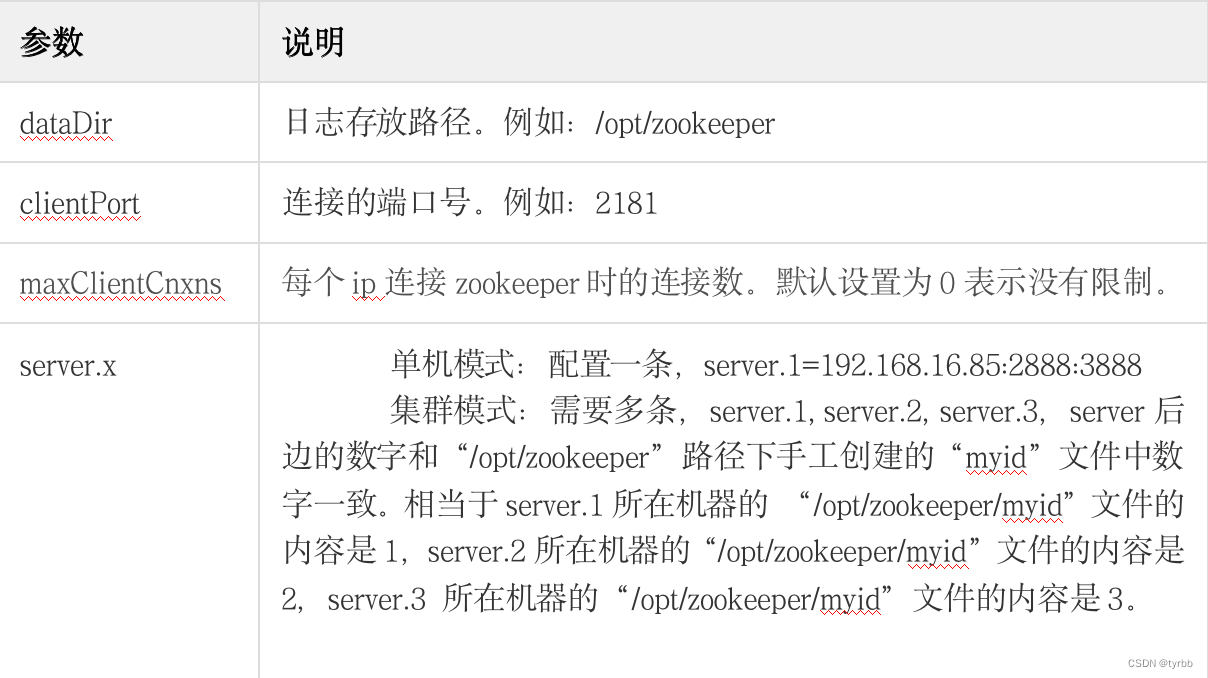
dataDir=/opt/zookeeper
# the port at which the clients will connect
clientPort=2181
# disable the per-ip limit on the number of connections since this is a non-production config
maxClientCnxns=0
initLimit=5
syncLimit=2
server.1=192.168.16.85:2888:3888
#server.2=192.168.16.86:2888:3888
#server.2=192.168.16.87:2888:3888
- 在“其bin”目录下,执行如下命令,启动zookeeper服务端实例。
# nohup ./zookeeper-server-start.sh ../config/zookeeper.properties &
2.4.2 配置Kafka
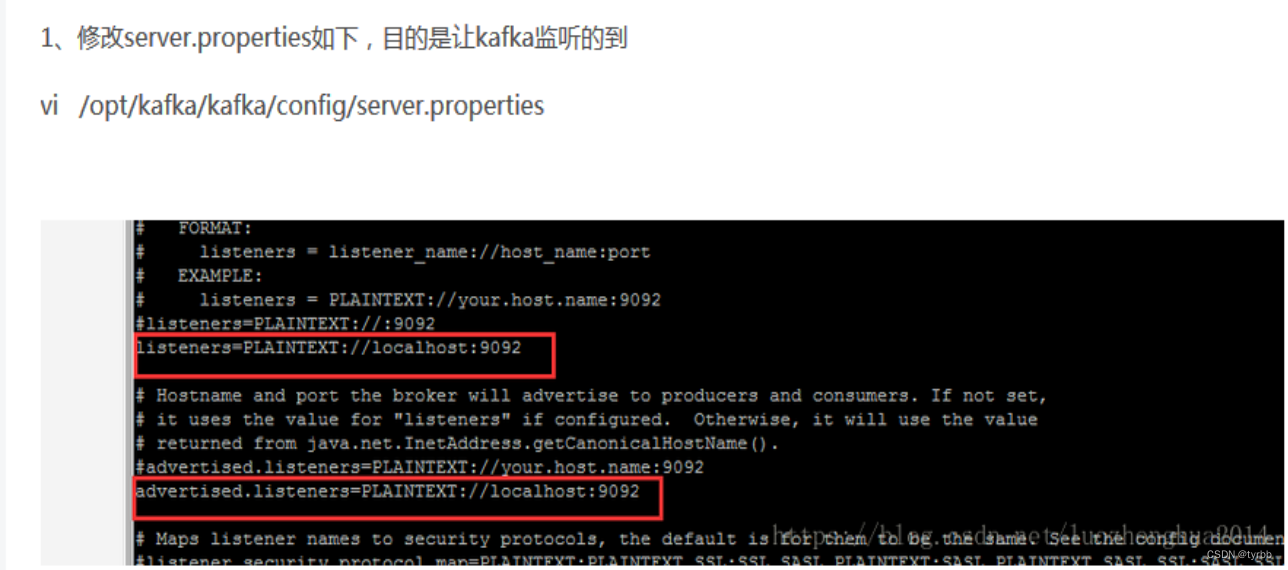
1.用文本编辑器打开“PFPJ_2.1_Log_Center\kafka_2.11-0.10.1.0\config”目录下的“server.properties”文件,配置如下参数。
server.properties
(略……)
############################# Server Basics #############################
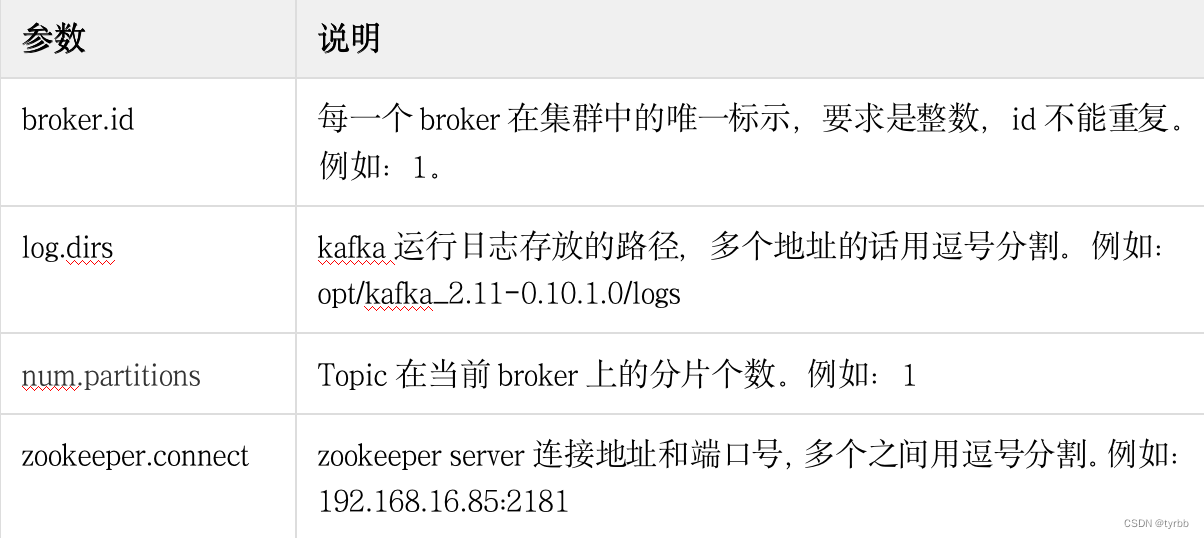
# The id of the broker. This must be set to a unique integer for each broker.
broker.id=1
host.name=11.104.34.149
listeners=PLAINTEXT://11.104.34.149:9092
advertised.listeners=PLAINTEXT://11.104.34.149:9092
num.network.threads=3
num.io.threads=8
socket.send.buffer.bytes=102400
socket.receive.buffer.bytes=102400
socket.request.max.bytes=104857600
(略……)
############################# Log Basics #############################
# A comma seperated list of directories under which to store log files
log.dirs=opt/kafka_2.11-0.10.1.0/logs
# The default number of log partitions per topic. More partitions allow greater
# parallelism for consumption, but this will also result in more files across
# the brokers.
num.partitions=1
num.recovery.threads.per.data.dir=1
(略……)
############################# Zookeeper #############################
# Zookeeper connection string (see zookeeper docs for details).
# This is a comma separated host:port pairs, each corresponding to a zk
# server. e.g. "127.0.0.1:3000,127.0.0.1:3001,127.0.0.1:3002".
# You can also append an optional chroot string to the urls to specify the
# root directory for all kafka znodes.
log.retention.hours=168
log.segment.bytes=1073741824
log.retention.check.interval.ms=300000
zookeeper.connect=192.168.16.85:2181
# Timeout in ms for connecting to zookeeper
zookeeper.connection.timeout.ms=6000
- 在“bin”目录下,执行如下命令,启动Kafka服务端实例。
# kafka-server-start.sh ../config/server.properties
以下第4步和第5步是可选操作
4. 在“PFPJ_2.1_Log_Center\kafka_2.11-0.10.1.0\bin”目录下,执行如下命令,创建kafka的Topic。用来测试kafka是否启动成功。
Unix
# kafka-topics.sh --list --zookeeper 192.168.16.85:2181

Windows
> windows\kafka-topics.bat --list --zookeeper 192.168.16.85:2181
- 在“PFPJ_2.1_Log_Center\kafka_2.11-0.10.1.0\bin”目录下,执行如下命令,打开一个Producer和一个Consumer。Producer用于发消息,Consumer接收消息。用来测试kafka是否启动成功。
Unix
# kafka-console-producer.sh --broker-list 192.168.16.85:9092 --topic 192-168-16-50.node
# kafka-console-consumer.sh --zookeeper 192.168.16.85:2181 --topic 192-168-16-50.node --from-beginning

Windows
> windows\kafka-console-producer.bat --broker-list 192.168.16.85:9092 --topic 192-168-16-50.node
> windows\kafka-console-consumer.bat --zookeeper 192.168.16.85:2181 --topic 192-168-16-50.node --from-beginning
2.4.3 验证
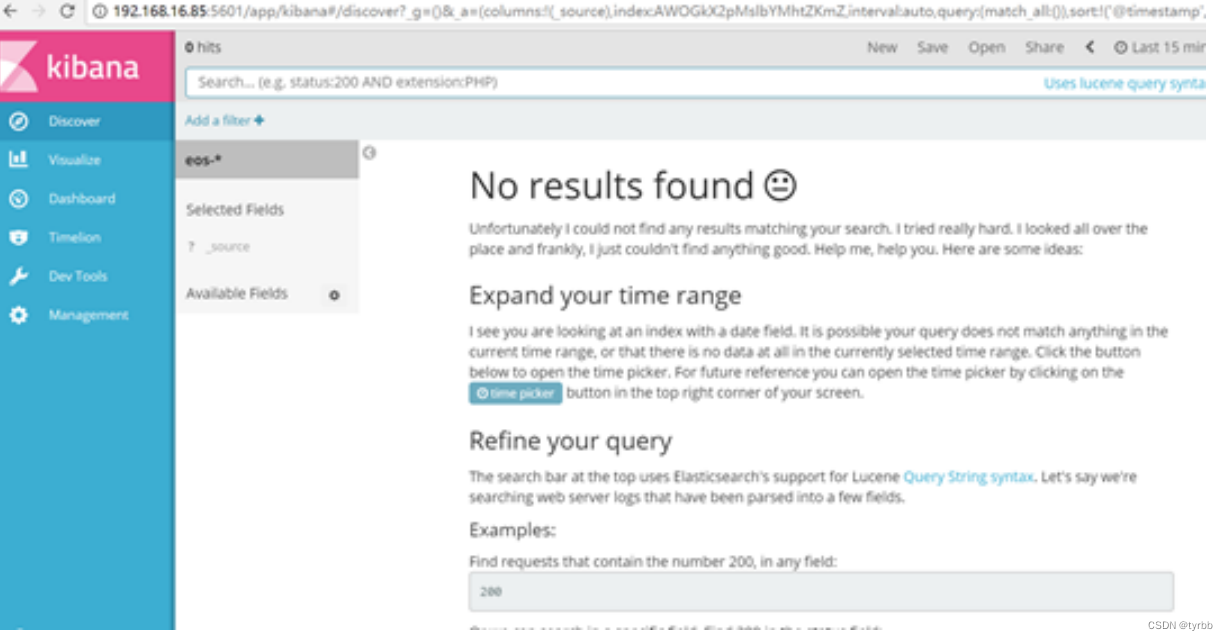
- kibana启动完成后可以访问http://192.168.16.85:5601/,如下图所示。
说明:
Kibana 默认链接了本机的 9200 端口,其绑定的端口为 5601,其中“192.168.16.85”为服务器主机IP地址,在“kibana.yml”配置的。
2.5 安装Filebeat
Filebeat 用于收集指定单个目录或者多个目录下的日志。本章节以配置多个目录为例进行讲解。
场景:一台机器上部署了三个微服务实例:ordermgr、productmgr、stockmgr,实例端口分别是 60000、60001、60002,每个微服务实例有各自的日志存储目录。
2.5.1 安装
用文本编辑器打开“PFPJ_2.1_Log_Center\filebeat-6.2.4-windows-x86_64”下的“filebeat.yml”文件,参照如下表格配置相关参数。
filebeat.yml
(略……)

#=========================== Filebeat prospectors =============================

filebeat.prospectors:

# Each - is a prospector. Most options can be set at the prospector level, so
# you can use different prospectors for various configurations.
# Below are the prospector specific configurations.

- type: log

  # Change to true to enable this prospector configuration.
  enabled: true

  # Paths that should be crawled and fetched. Glob based paths.
  paths:
    - /home/ordermgr/logs/*.log
  fields:
    log_topics: 192.168.16.169-60000

- type: log
  enabled: true
  paths:
    - /home/productmgr/logs/*.log
  fields:
    log_topics: 192.168.16.169-60001

- type: log
  enabled: true
  paths:
    - /home/stockmgr/logs/*.log
  fields:
    log_topics: 192.168.16.169-60002

(略……)

#========================== Filebeat modules ===============================

filebeat.config.modules:
 path: ${path.config}/modules.d/*.yml
 reload.enabled: false
#==================== Elasticsearch template setting ==========================
setup.template.settings:
 index.number_of_shards: 3
#=============================== General ===================================


#=========================== Dashboards ===================================

#============================== Kibana =====================================
setup.kibana:

 host: "11.104.34.149:5601"
#=============================Elastic Cloud ==================================

#===============================Outputs====================================
#-------------------------- Kafka output ------------------------------
output.kafka:
  hosts: ['192.168.16.85:9092'] #Kafka所在的ip地址及端口
  topic: '%{[fields][log_topics]}'
  partition.round_robin:
    reachable_only: false
  required_acks: 1
  compression: gzip
  max_message_bytes: 1000000

#-------------------------- Elasticsearch output ------------------------------
#output.elasticsearch:
 # Array of hosts to connect to.
# hosts: ["20.200.26.86:9200"]

 # Optional protocol and basic auth credentials.
 #protocol: "https"
 #username: "elastic"
 #password: "changeme"

#----------------------------- Logstash output --------------------------------
#output.logstash:
 # The Logstash hosts
 #hosts: ["localhost:5044"]

 # Optional SSL. By default is off.
 # List of root certificates for HTTPS server verifications
 #ssl.certificate_authorities: ["/etc/pki/root/ca.pem"]

 # Certificate for SSL client authentication
 #ssl.certificate: "/etc/pki/client/cert.pem"

 # Client Certificate Key
 #ssl.key: "/etc/pki/client/cert.key"

#================================ Logging =====================================

# Sets log level. The default log level is info.
# Available log levels are: error, warning, info, debug
#logging.level: debug

# At debug level, you can selectively enable logging only for some components.
# To enable all selectors use ["*"]. Examples of other selectors are "beat",
# "publish", "service".
#logging.selectors: ["*"]

#============================== Xpack Monitoring ===============================
# filebeat can export internal metrics to a central Elasticsearch monitoring
# cluster.  This requires xpack monitoring to be enabled in Elasticsearch.  The
# reporting is disabled by default.

# Set to true to enable the monitoring reporter.
#xpack.monitoring.enabled: false

# Uncomment to send the metrics to Elasticsearch. Most settings from the
# Elasticsearch output are accepted here as well. Any setting that is not set is
# automatically inherited from the Elasticsearch output configuration, so if you
# have the Elasticsearch output configured, you can simply uncomment the
# following line.
#xpack.monitoring.elasticsearch:

- 在“filebeat-6.2.4-windows-x86_64”目录下,安装FileBeats。
Unix
# sudo chown root filebeat.yml
# sudo ./filebeat -e -c filebeat.yml -d "publish"

Windows
> filebeat.exe -e -c filebeat.yml
2.5.2 卸载
可以直接删除“PFPJ_2.1_Log_Center”目录来卸载。
3 、ELK部署过程问题集
3.1 Redis 同样可以,为什么要选择 kafka ?
都知道 Redis 是以 key 的 hash 方式来分散对列存储数据的,且 Redis 作为集群使用时,对应的应用对应一个 Redis,在某种程度上会造成数据的倾斜性,从而导致数据的丢失。
而从之前部署 Kafka 集群来看,kafka 的一个 topic(主题),可以有多个 partition(副本),而且是均匀的分布在 Kafka 集群上,这就不会出现 redis 那样的数据倾斜性。Kafka 同时也具备 Redis 的冗余机制,像 Redis 集群如果有一台机器宕掉是很有可能造成数据丢失,而 Kafka 因为是均匀的分布在集群主机上,即使宕掉一台机器,是不会影响使用。同时 Kafka 作为一个订阅消息系统,还具备每秒百万级别的高吞吐量,持久性的、分布式的特点等。
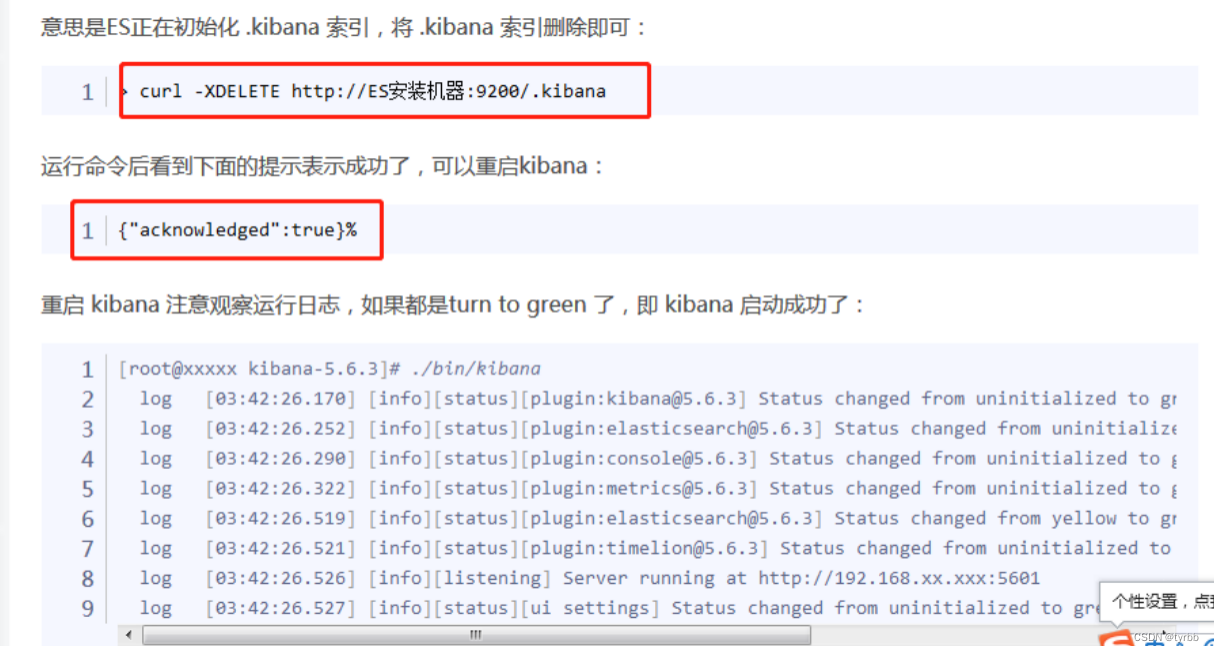
3.2 El一直初始化kibana
【ElasticSearch is still initializing the kibana index】

解决方案:
3.3 plugin:[email protected] Service Unavailable
日志现象:
[2019-12-14T14:35:15,840][INFO ][o.e.d.z.ZenDiscovery ] [yelksvc1] failed to send join request to master [{yelksvc2}{9rVke5zYRL-qq8EXynIAvw}{M4KyckULTfehOLKBJCOahQ}{11.104.34.150}{11.104.34.150:9300}], reason [RemoteTransportException[[yelksvc2][11.104.34.150:9300][internal:discovery/zen/join]]; nested: NotMasterException[Node [{yelksvc2}{9rVke5zYRL-qq8EXynIAvw}{M4KyckULTfehOLKBJCOahQ}{11.104.34.150}{11.104.34.150:9300}] not master for join request]; ], tried [3] times
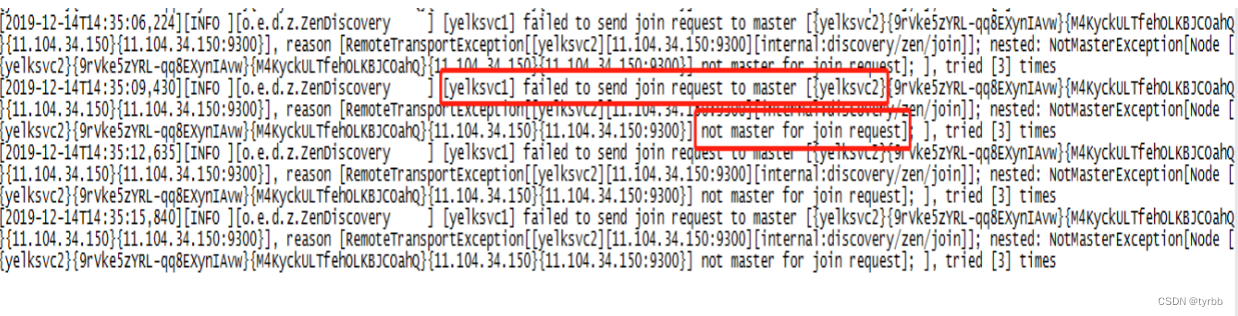
原因:数据不一致,elasticsearch目录下data存放数据的目录,是否和本节点的数据不一致;
解决方案:https://blog.csdn.net/HuoqilinHeiqiji/article/details/88402637
data目录数据不一致。因为是复制别人的elasticsearch,原来的节点是有data的,复制过程中,data也存放了原来的信息,因为是本地测试环境,所以data目录删除后,一切恢复正常!其实,日志提示的错误很明显,每个节点单独启动,但是读取的数据却是一直的,导致多个节点不能形成集群。
3.4 Kafka出现:Error while fetching metadata with correlation id : {LEADER_NOT_AVAILABLE}

原因:kafka出现:
Error while fetching metadata with correlation id : {LEADER_NOT_AVAILABLE}
表示无法识别kafka hostname
解决方案:
4、页面索引配置
https://www.cnblogs.com/martin-wang/p/10656673.html
curl -XPUT http://11.104.34.150:9200/eos=*
查看elasticsearch集群的状态,在Kibana控制台中运行命令:
GET /_cat/health?V
【查看zookpeer集群状状态】
./kafka-topics.sh --describe --zookeeper 11.104.34.150:2181
【查看el集群状态】
curl http://11.104.34.152:9200/_nodes/process?pretty
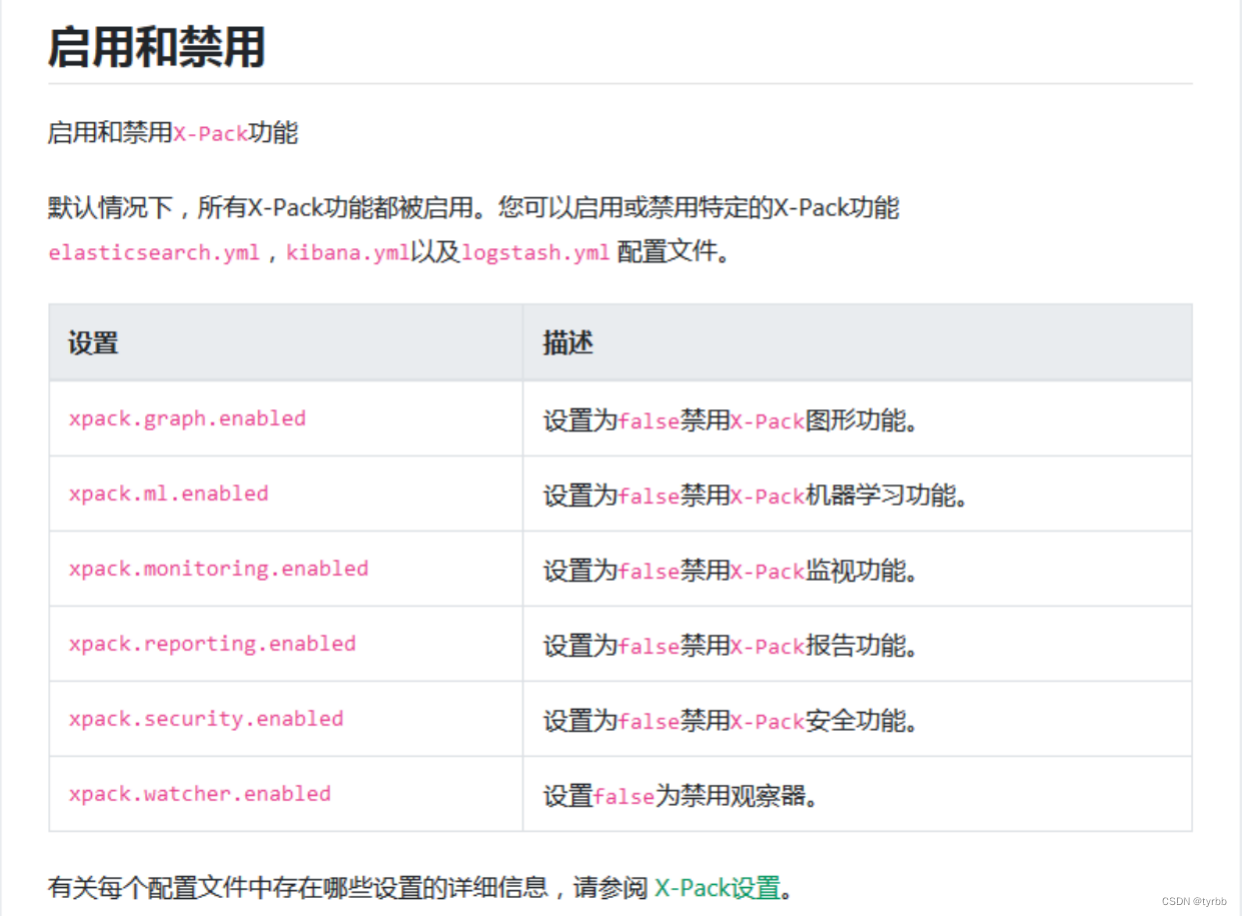
5 、x-pack安装
查询所有用户
curl -XGET -u elastic 'localhost:9200/_xpack/security/user?pretty'
查询所有Roles
curl -XGET -u elastic 'localhost:9200/_xpack/security/role'
【elk中安装X-pack】
参考地址:
https://segmentfault.com/a/1190000010981283
https://www.cnblogs.com/xbq8080/p/6547765.html
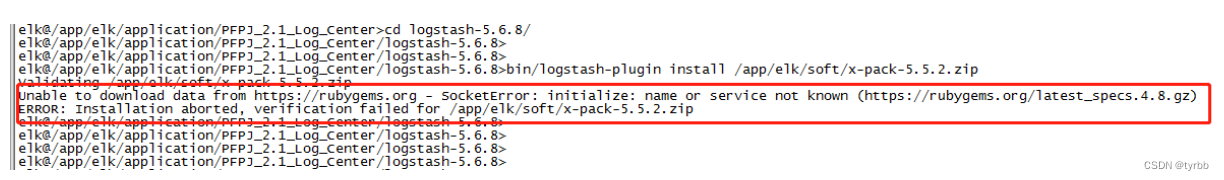
bin/logstash-plugin install /app/elk/soft/x-pack-5.5.2.zip
Unable to download data from https://rubygems.org - SocketError: initialize: name or service not known (https://rubygems.org/latest_specs.4.8.gz)
ERROR: Installation aborted, verification failed for /app/elk/soft/x-pack-5.5.2.zip
参考地址:https://blog.csdn.net/weixin_34392906/article/details/91938797
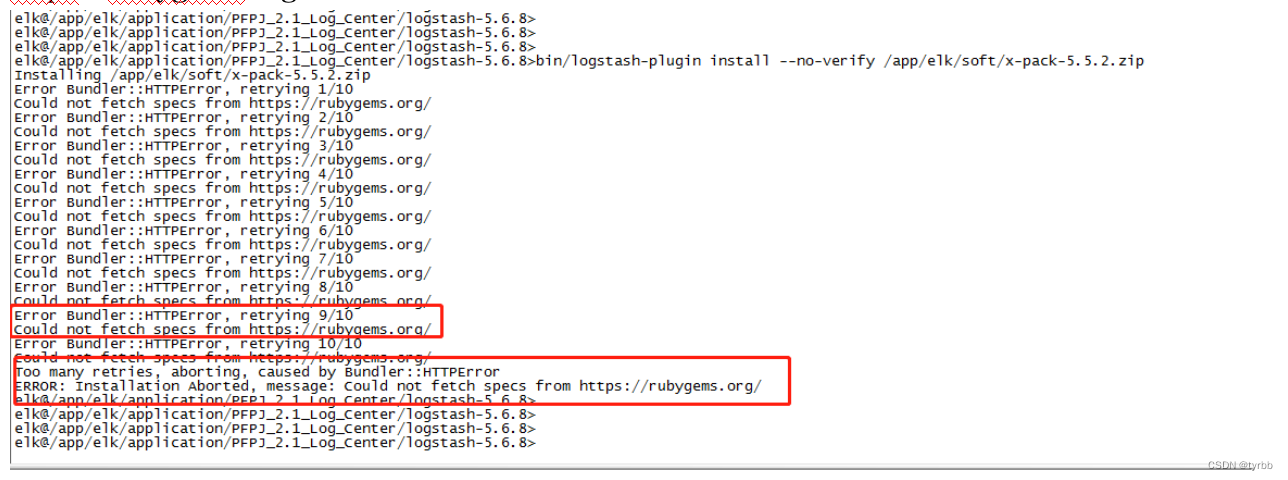
bin/logstash-plugin install --no-verify /app/elk/soft/x-pack-5.5.2.zip
Error Bundler::HTTPError, retrying 10/10
Could not fetch specs from https://rubygems.org/
Too many retries, aborting, caused by Bundler::HTTPError
ERROR: Installation Aborted, message: Could not fetch specs from https://rubygems.org/
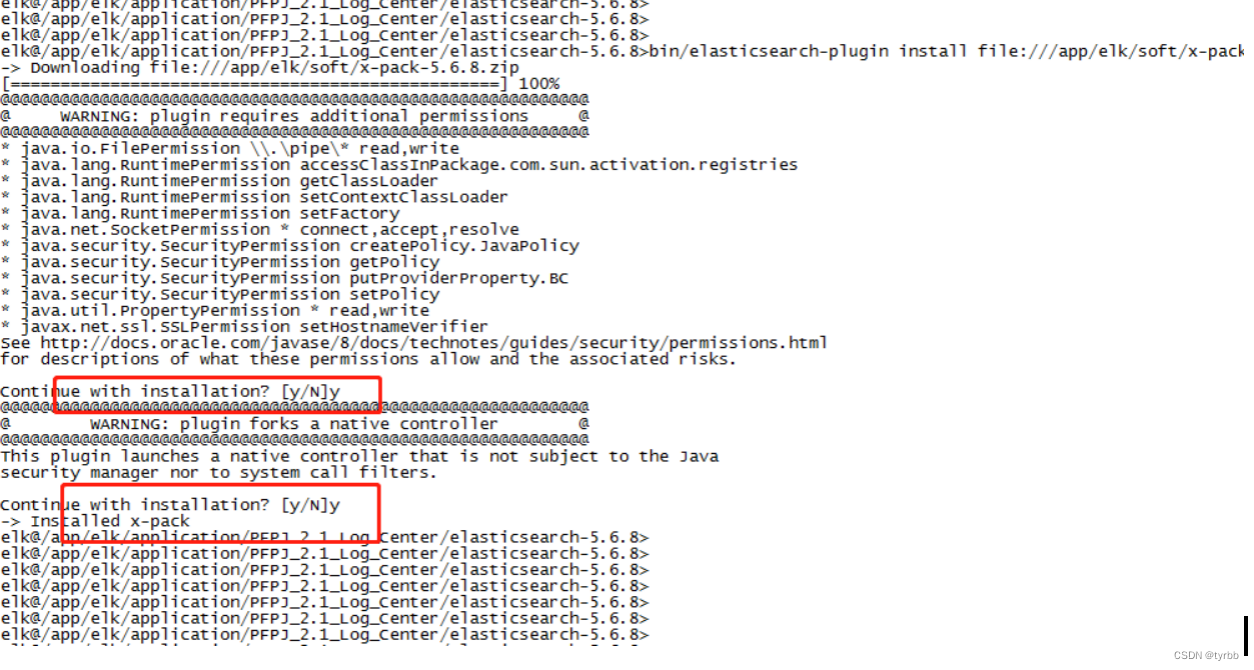
elasticsearch安装x-pack过程
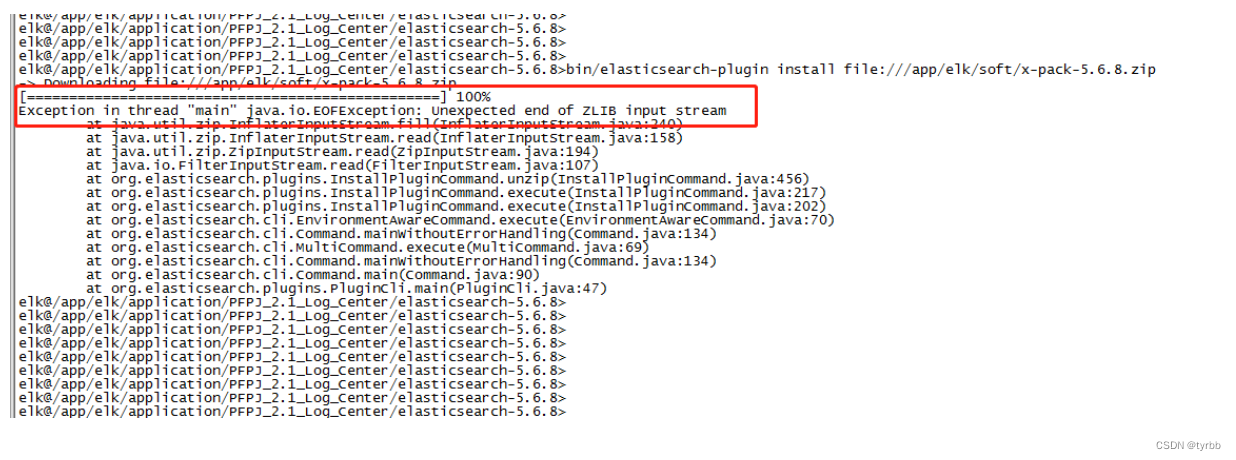
检查x-pack包大小是否正确:

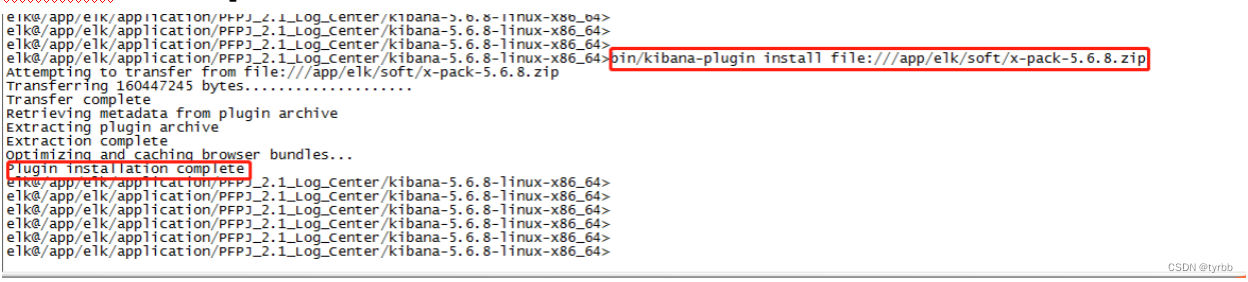
Kibana安装x-pack过程
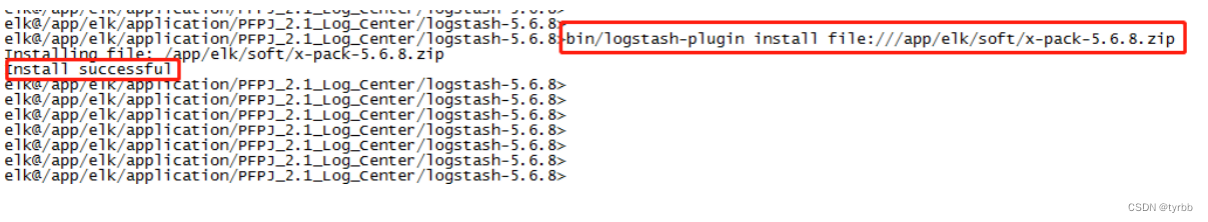
logstash安装x-pack过程
x-pack默认用户口令
elastic/changeme
X-PACK修改密码
https://www.cnblogs.com/xbq8080/p/6547765.html