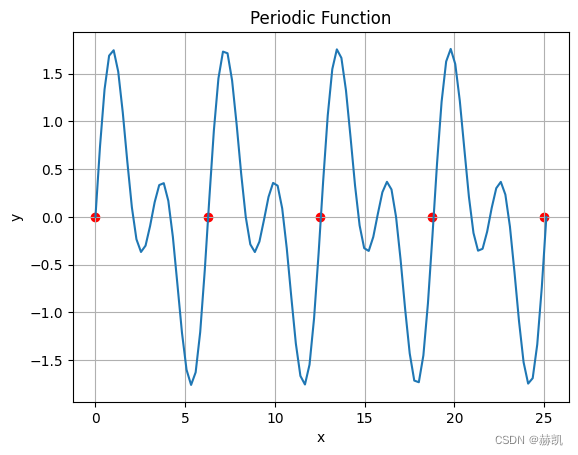
在日常生活中,总是会遇见一些周期性的函数,我们可以人眼看出他们是有一定规律的,但是我们不能准确地发现它们的周期是多少。
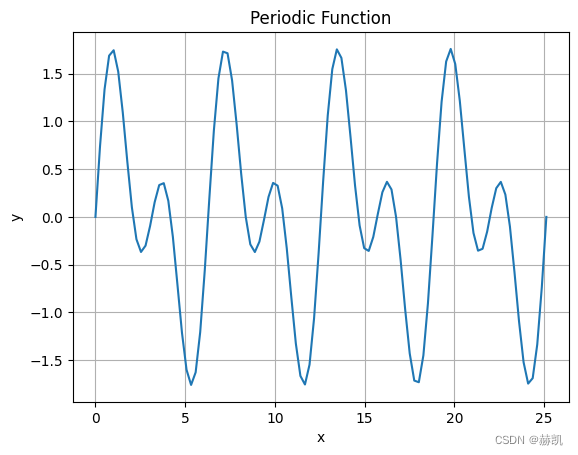
创建一根周期性曲线
import numpy as np
import matplotlib.pyplot as plt

# 定义周期性函数
def periodic_function(x):
    return np.sin(x) + np.sin(2*x)

# 生成一组 x 值数组
x = np.linspace(0, 8*np.pi, 100)

# 计算对应的 y 值数组
y = periodic_function(x)

# 绘制函数图像
plt.plot(x, y)
plt.xlabel('x')
plt.ylabel('y')
plt.title('Periodic Function')
plt.grid(True)
plt.show()
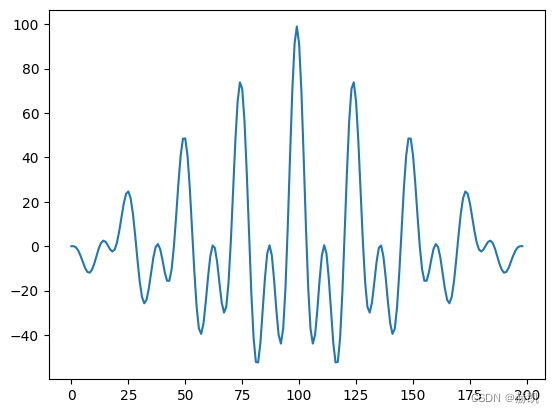
自相关性分析
np.correlate就是两个序列进行错位依次点积运算。
但自相关系数应该是不同值与均值做差,然后相乘比平方差。
acf = np.correlate(y, y, 'full')
plt.plot(acf)
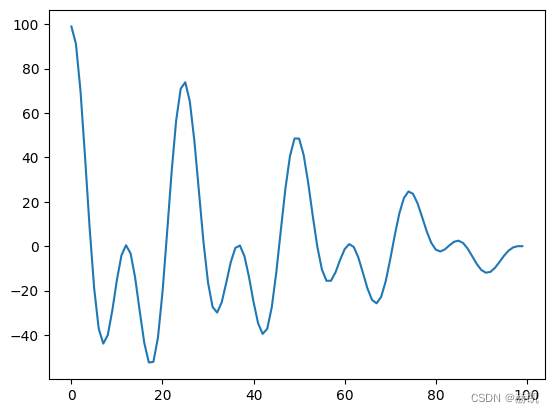
用的时候用y本身长的后半段就可以了
acf = acf[-len(y):]
plt.plot(acf)
看一下拐点
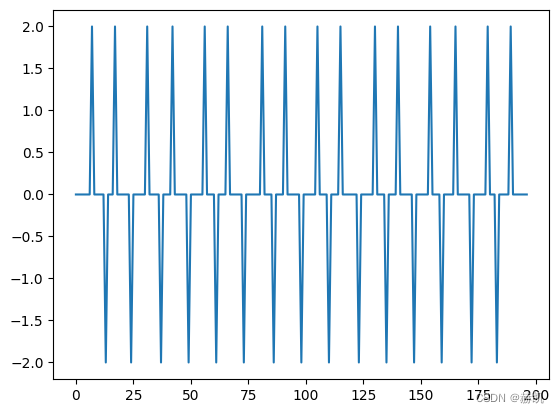
inflection = np.diff(np.sign(np.diff(acf)))
plt.plot(inflection)
找出所有小于零拐点的索引
peaks = (inflection < 0).nonzero()[0] + 1
在自相关系数序列中,寻找出波峰最大值
print(peaks[acf[peaks].argmax()])
plt.plot(acf)
plt.scatter([peaks[acf[peaks].argmax()]] * 140, list(range(-40, 100, 1)), s = 3, c ='r')
25
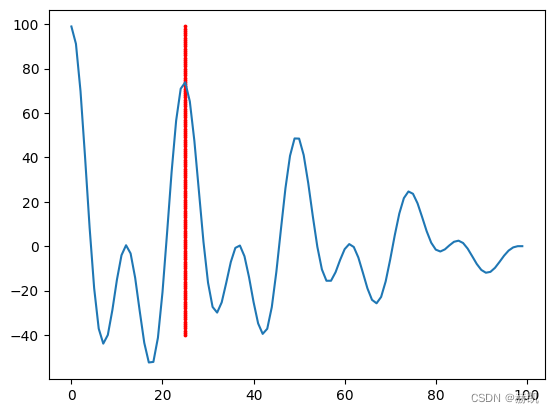
至此周期就算出来了