文章目录
概要
小程序中使用echarts(简单详细)
小程序中使用echarts
在echarts官网中有介绍到:echarts-for-weixin 项目提供了一个小程序组件,用这种方式可以方便地使用 ECharts。
步骤:
1. ec-canvas
点击上方链接下载项目ec-canvas
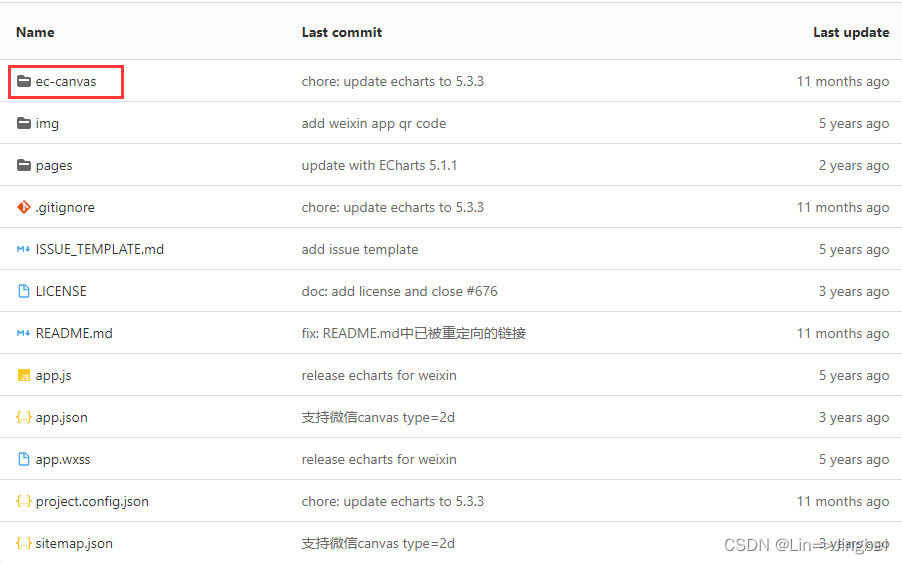
2. 下载项目
下载这个项目文件夹到自己的电脑上
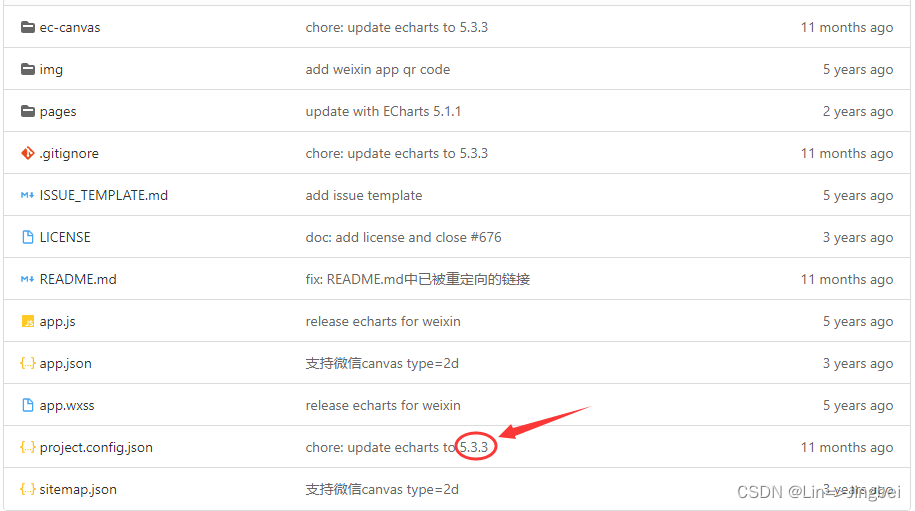
注意:需注意下载的是哪个版本,之后在echarts官网定制时选用的版本是和这个项目的版本一样的,否则可能出不来,小程序中不会放很多的echarts图表,否则整个项目太大了,会带不动,所以小程序一般是使用在线定制
3. 去echarts官网定制:
点击下载——下载——方法三中的在线定制

在定制页面中选择你需要使用的图表,注意!注意!注意!这里的选择版本,必须和上面下载的ec-canvas中的echarts.js的版本对应,必须!必须!必须!选择完成后,翻到最下面点击下载按钮。
4.点击下载
下载完成后,找到下载的文件:echarts.min.js ,然后在你小程序项目中新建一个components,把echarts这个目录放进去,原目录中的echarts.js删了不要,太大了,换成上一步下载的echarts.min.js,还有一点注意的就是ec-canvas.js的import引入的是原来的echarts.js文件,你需要自己改成刚才下载的文件
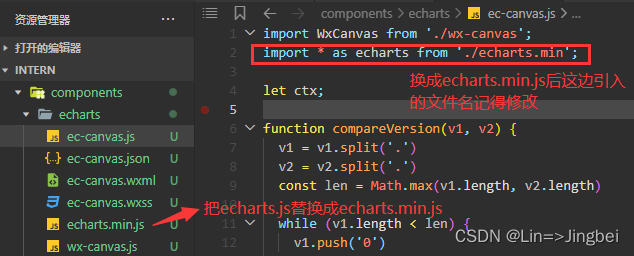
5.引入使用
然后就可以引入使用了,在js文件中引入此文件(自己找此文件位置并引入)
 import * as echarts from '../../components/echarts/echarts.min'
 function bar(canvas, width, height, dpr) {


    const chart = echarts.init(canvas, null, {


        width: width,
        height: height,
        // devicePixelRatio: dpr
    });
    canvas.setChart(chart);
 let option = {


    xAxis: {


      type: 'category',
      data: ['Mon', 'Tue', 'Wed', 'Thu', 'Fri', 'Sat', 'Sun']
    },
    yAxis: {


      type: 'value'
    },
    series: [
      {


        data: [120, 200, 150, 80, 70, 110, 130],
        type: 'bar',
        showBackground: true,
        backgroundStyle: {


          color: 'rgba(180, 180, 180, 0.2)'
        }
      }
    ]
  };
  chart.setOption(option);
  return chart;
}
在date里写:
data: {


    ec: {


      onInit: bar
    },
  },
所有的操作都在option中,需要配置其他属性的话,可查看配置项手册或者打开示例配置
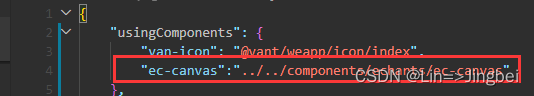
JSON文件引入的是目录中的ec-canvas.js
WXML文件:这里的ec是组件对象,对应着js文件里data的ec
		<view class="ec-box">
			<ec-canvas canvas-id="echart-bar" ec="{

    {ec}}"></ec-canvas>
		</view>
wxss文件:(给echarts的容器设置宽高)
ec1-box {


  width: 100%;
  height: 406rpx;
}
这样echarts的引入和使用就成功了。
echarts的option配置知识点归纳整理(还在更新):
- 通用:
1、grid: {


            left: "0", //距离容器左边的距离
            right: "0",  //距离容器右边的距离
            bottom: "0",  //距离容器下边的距离
            top: "33",  //距离容器上边的距离
            containLabel: true //是否显示坐标轴
        },
2、xAxis: [{


            type: 'category',  // 坐标轴类型
            // prettier-ignore
            axisLabel: {

      // 设置X轴坐标轴名称字体样式
                textStyle: {


                    fontSize: "10",
                    fontWeight: '400',
                    color: '#999999',
                    fontFamily: 'PingFangSC-Regular, PingFang SC'
                },
            },
            axisTick: {


                show: false  // 是否显示X轴坐标轴刻度
            },
            axisLine: {


                show: false  // 是否显示X轴坐标轴线
            },
            data: ['07/08', '07/09', '07/10', '今天']  // X轴字段数据
        }],
3、yAxis: [{


            type: 'value',   // 坐标轴类型
            axisLabel: {

       // 设置Y轴坐标轴名称字体样式
                textStyle: {


                    fontSize: "10",
                    fontWeight: '400',
                    color: '#999999',
                    fontFamily: 'PingFangSC-Regular, PingFang SC'
                },
            },
            name: '元',  // 设置Y轴坐标轴单位
            nameTextStyle: {

     //  单位样式
                color: "#999999", //  字体颜色
                fontSize: 10, //  字体大小
                padding: [0, 26, 0, 0], //  内填充
                fontFamily: 'PingFangSC-Regular, PingFang SC',  // 字体
                fontWeight: 400,
            }
        }],
4、tooltip: {

     // 提示框组件
            show: true,
            confine: false, //是否将 tooltip 框限制在图表的区域内
            backgroundColor: 'rgba(0,0,0,0.65)', //提示框浮层背景色
            trigger: 'axis',
            dashOffset: 10,
            padding: 6, //上右下左内边距
            textStyle: {

     //提示框浮层的文本样式
                color: '#fff',
                fontSize: 10,
                lineHeight: 10,
            },
            axisPointer: {

     //坐标轴指示器配置项
                type: 'line', //直线指示器
                z: 1,
                lineStyle: {


                    type: 'dashed',
                    color: '#979797',
                    shadowOffsetY: -7,
                    shadowColor: '#979797',
                }
            },
        },
5、 legend: {

      // 图例组件
            orient: 'horizontal', //  布局朝向(横向/(纵向:vertical))
            right: 0, // legend位置调整
            icon: "circle", // legend标记样式
            itemHeight: 8, // legend标记样式高度
            itemWidth: 8, // legend标记样式宽度
            itemGap: 12, // legend标记的间距
            textStyle: {

      // 图例文本样式
                fontSize: 10,
                fontFamily: 'PingFangSC-Regular, PingFang SC',
                fontWeight: 400,
                color: '#666666',
                padding: [0, 0, 0, 6] //文字与图形之间的左右间距
            },
            data: ['收入', '支出']  //图例数据数组
        },
- 柱形图:
1、series: [{

      // 双柱图数据
                name: '收入',
                type: 'bar',
                barWidth: '10', // 柱状图宽度
                barGap: '60%',
                label: {


                    // 设置显示label
                    show: true,
                    // 设置label的位置
                    position: 'top',
                    // 设置label的文字颜色
                    color: '#999999',
                    fontFamily: 'PingFangSC-Regular, PingFang SC',
                    fontWeight: 500,
                    fontSize: '10',
                    // 格式化label文字
                    formatter: function (data) {


                        return Math.round(data.value).toFixed(2)
                    },
                },
                data: [
                    25.6, 76.7, 135.6, 162.2,
                ],
                itemStyle: {


                    color: new echarts.graphic.LinearGradient(0, 1, 0, 0, [{

     // 设置柱状图渐变色
                        offset: 0,
                        color: "#FF991C" // 0% 处的颜色
                    }, {


                        offset: 0.6,
                        color: "#ffb720" // 60% 处的颜色
                    }, {


                        offset: 1,
                        color: "#FFCD24 " // 100% 处的颜色
                    }], false),
                    barBorderRadius: [3, 3, 0, 0], // 柱形图圆角
                },
            },
            {


                name: '支出',
                type: 'bar',
                barWidth: '10', // 柱状图宽度
                label: {


                    // 设置显示label
                    show: true,
                    // 设置label的位置
                    position: 'top',
                    // 设置label的文字颜色
                    color: '#999999',
                    fontFamily: 'PingFangSC-Regular, PingFang SC',
                    fontWeight: 500,
                    fontSize: '10',
                    // 格式化label文字
                    formatter: function (data) {


                        return Math.round(data.value).toFixed(2)
                    },
                },
                data: [
                    70.7, 175.6, 182.2, 48.7
                ],
                itemStyle: {


                    color: new echarts.graphic.LinearGradient(0, 1, 0, 0, [{

     // 设置柱状图渐变色
                        offset: 0,
                        color: "#4186F5" // 0% 处的颜色
                    }, {


                        offset: 0.6,
                        color: "#73affa" // 60% 处的颜色
                    }, {


                        offset: 1,
                        color: "#9CD2FF  " // 100% 处的颜色
                    }], false),
                    barBorderRadius: [3, 3, 0, 0], // 柱形图圆角
                },
            }
        ]
- 折线图:
1、  series: [{

      // 折线图数据
                name: '完成订单',
                type: 'line',
                stack: 'Total',
                symbol: 'circle', // 折线图折点样式(实心)
                symbolSize: 4, // 折线图折点的大小样式
                lineStyle: {


                    color: 'pink' // 设置折线颜色
                },
                data: [120, 132, 101, 134, 90, 230, 210]
            },
            {


                name: '取消订单',
                type: 'line',
                symbol: 'circle', // 折线图折点样式(实心)
                symbolSize: 4, // 折线图折点的大小样式
                stack: 'Total',
                data: [220, 182, 191, 234, 290, 330, 310]
            },
        ]
    };
小结
以上就是小程序使用echarts步骤知识点,喜欢的话快点赞、收藏吧!谢谢!
- 祝:平安顺遂