Angular项目首次接触引入Echarts报错
首次使用CSDN博客记录学习工作日志
Angular引入NgxEchartsModule考虑版本是否兼容问题
找到github上一个项目,解决我的困惑,已经尝试成功的解决步骤如下
- 通过npm卸载不兼容的echarts版本
- npm安装与angular脚手架能兼容的echarts版本
大佬的github项目地址https://github.com/xieziyu/ngx-echarts
链接,可以点星
未尝试的解决步骤
- 通过npm卸载angular
- npm安装与echarts能兼容的angular脚手架版本
angular与echarts对应兼容版本
ngx-echarts is an Angular (ver >= 2.x) directive for ECharts (ver >= 3.x).
Latest version @npm:
v14.x for Angular >= 14
v8.x for Angular >= 13
v7.x for Angular >= 11
v6.x for Angular >= 10, < 11
v5.x for Angular >= 6, < 10
v2.3.1 for Angular < 6
访问github
windows系统可以使用clash订阅链接,macos系统使用clashx订阅链接
使用npm安装echarts
//简单两个echarts安装命令
npm install echarts -S
npm install ngx-echarts -S
使用样例
- 首先在angular的module.ts文件中引入echarts模块
import { NgxEchartsModule } from ‘ngx-echarts’;
@NgModule({


  imports: [
    NgxEchartsModule.forRoot({


      /**
       * This will import all modules from echarts.
       * If you only need custom modules,
       * please refer to [Custom Build] section.
       */
      echarts: () => import('echarts'), // or import('./path-to-my-custom-echarts')
    }),
  ],
})
export class AppModule {

    }
- 然后可以在declarations的组件中愉快玩耍了
– component.html文件
<div echarts [options]="chartOption" class="demo-chart"></div>
– component.css文件
.demo-chart {


  height: 400px;
}
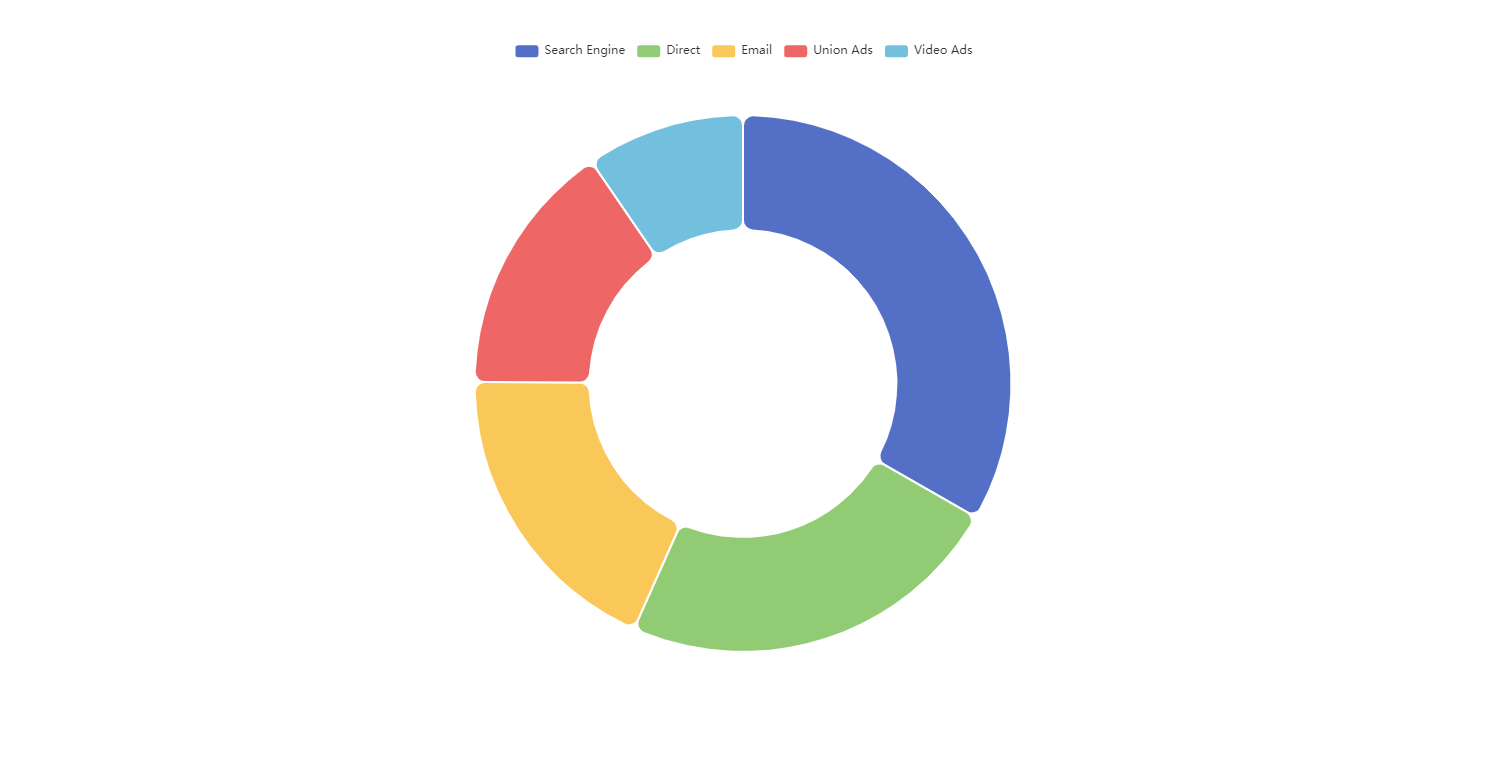
– component.ts文件,使用了官网的案例
import {

     Component, OnInit } from '@angular/core';
import {

     EChartsOption } from 'echarts';

@Component({


  selector: 'app-my-echarts',
  templateUrl: './my-echarts.component.html',
  styleUrls: ['./my-echarts.component.css']
})
export class MyEchartsComponent implements OnInit {


  constructor() {

     }

  ngOnInit() {


  }
  chartOption: EChartsOption = {


    tooltip: {


      trigger: 'item'
    },
    legend: {


      top: '5%',
      left: 'center'
    },
    series: [
      {


        name: 'Access From',
        type: 'pie',
        radius: ['40%', '70%'],
        avoidLabelOverlap: false,
        itemStyle: {


          borderRadius: 10,
          borderColor: '#fff',
          borderWidth: 2
        },
        label: {


          show: false,
          position: 'center'
        },
        emphasis: {


          label: {


            show: true,
            fontSize: '40',
            fontWeight: 'bold'
          }
        },
        labelLine: {


          show: false
        },
        data: [
          {

     value: 1048, name: 'Search Engine' },
          {

     value: 735, name: 'Direct' },
          {

     value: 580, name: 'Email' },
          {

     value: 484, name: 'Union Ads' },
          {

     value: 300, name: 'Video Ads' }
        ]
      }
    ]
}
}
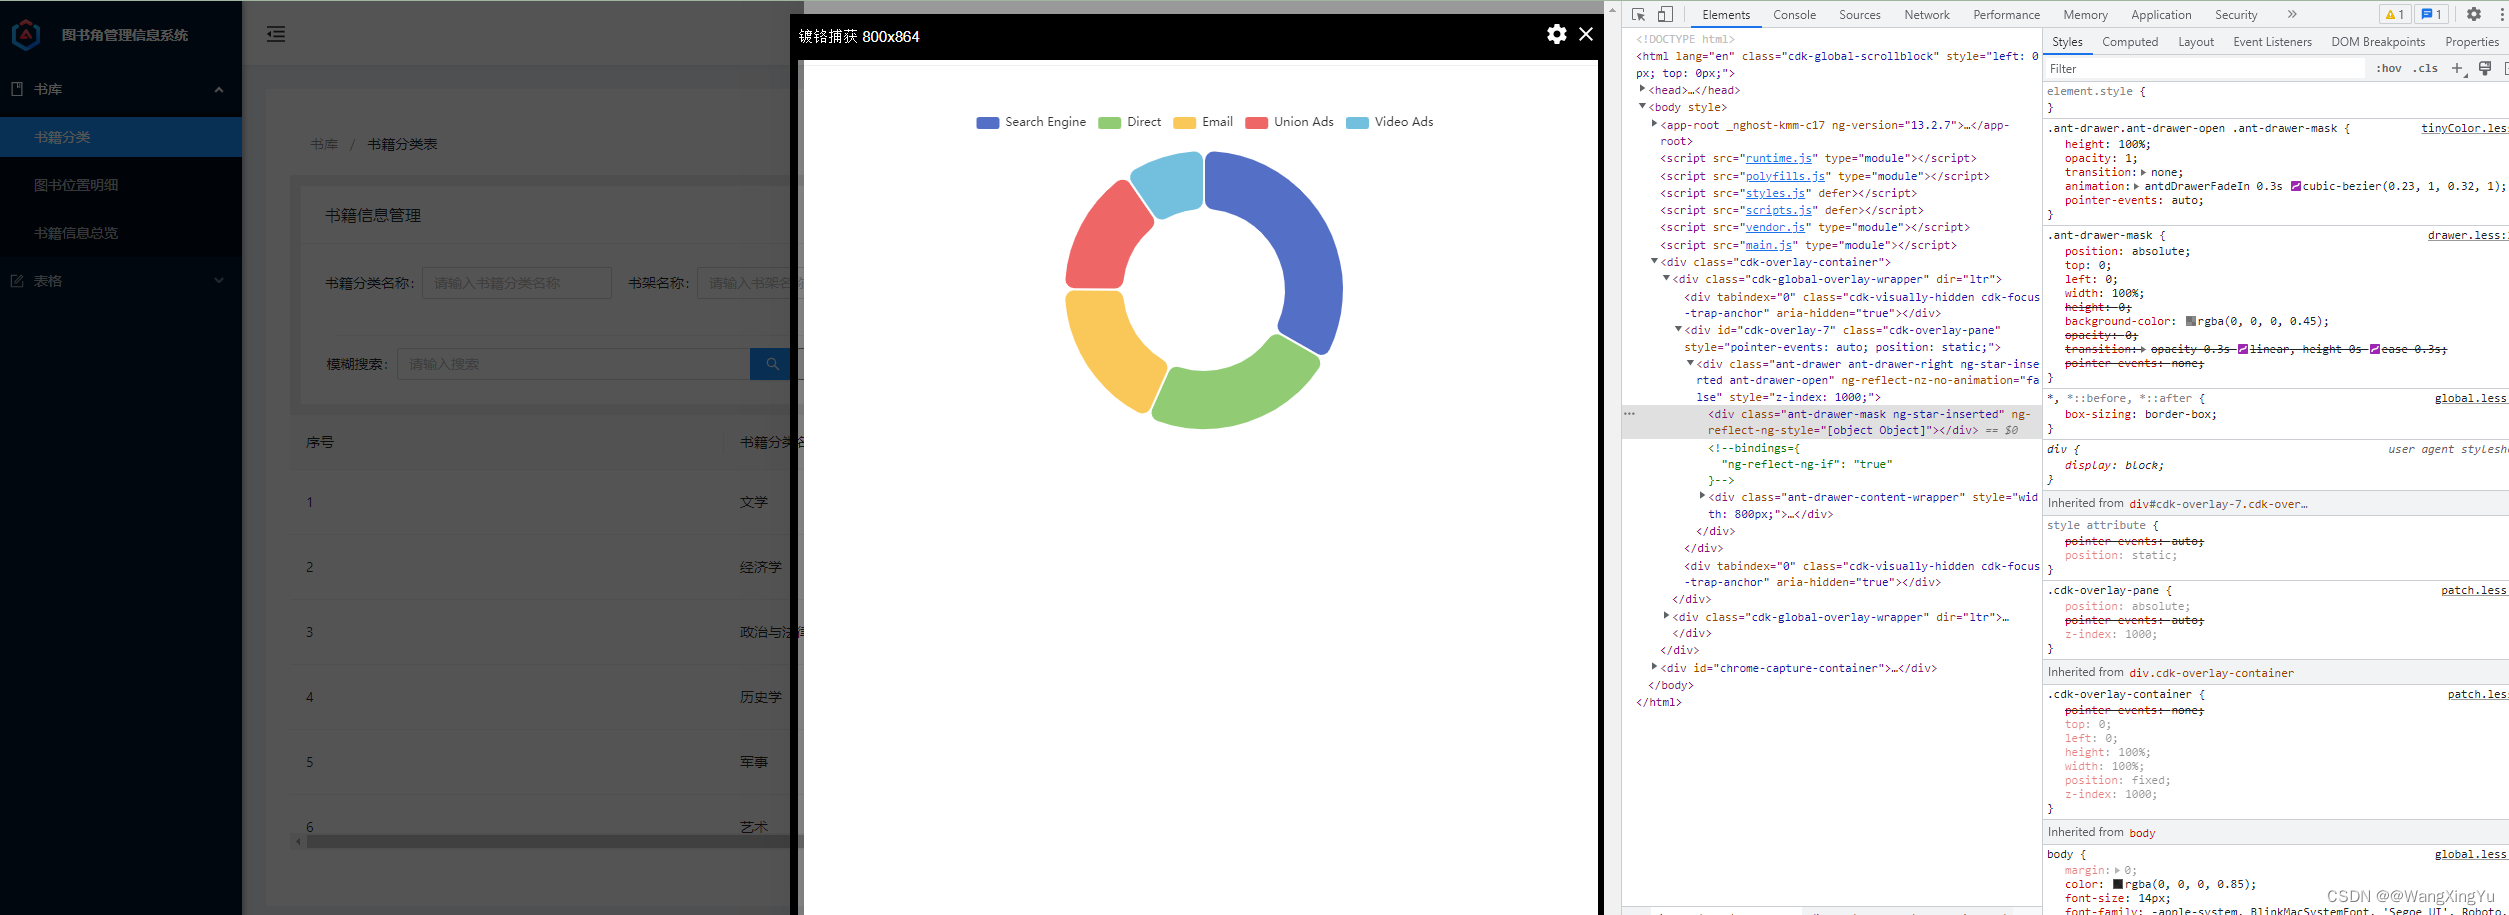
生成图片