怎么在Excel中生成Latex代码——excel2latex插件
在使用Latex或beamer过程中,需要将excel表格直接生成latex能用的代码,将excel生成latex代码的方法记录下来。
目录
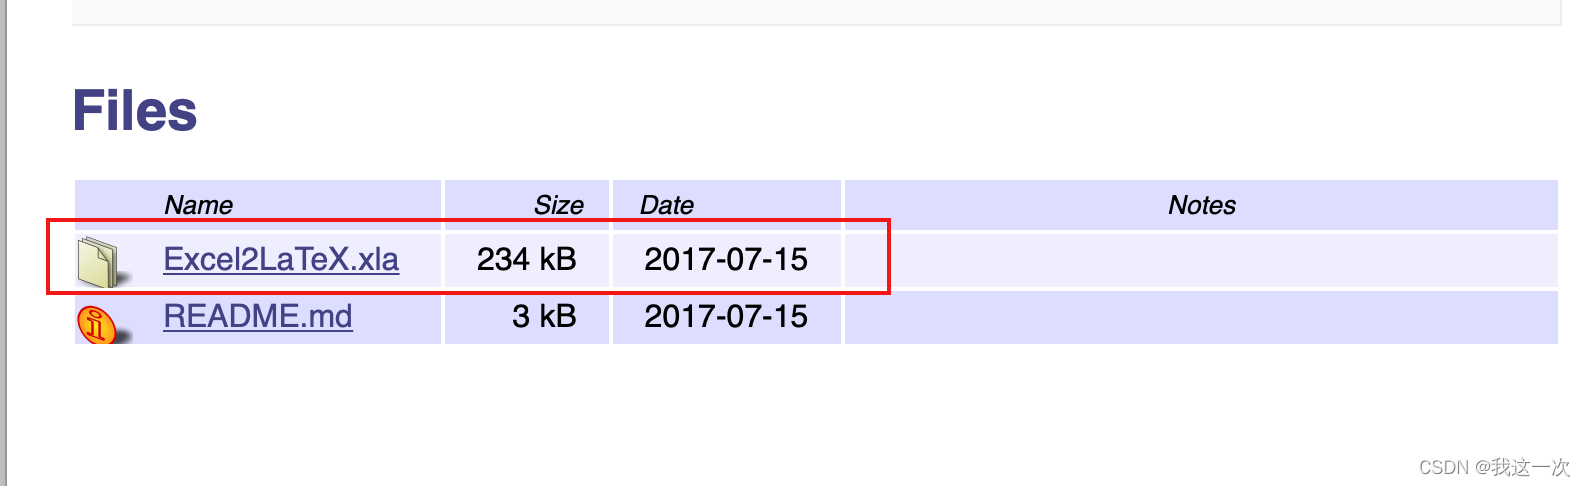
步骤1:下载excel2latex插件
Exel2latex插件的下载地址为:excel2latex下载地址。
对这个项目实现细节感兴趣的可以参考一下github的项目源码:excel2latex-github源码。
或者直接使用百度网盘下载地址进行下载:
链接: https://pan.baidu.com/s/1RoRWNPee4m79DnzvLP_naw 密码: iow8
步骤2:使用excel2latex插件
下载完成之后,直接双击,然后打开excel(对啦,提醒一下,博主是用的Microsoft office系列产品中的excel,不知道WPS等版本的excel是否同样适用该插件,如有实测经验的朋友,可以在下方留言,分享你们的经验)。
在excel页面中输入数据,并且设计想要的边框和线条格式,效果如下所示:
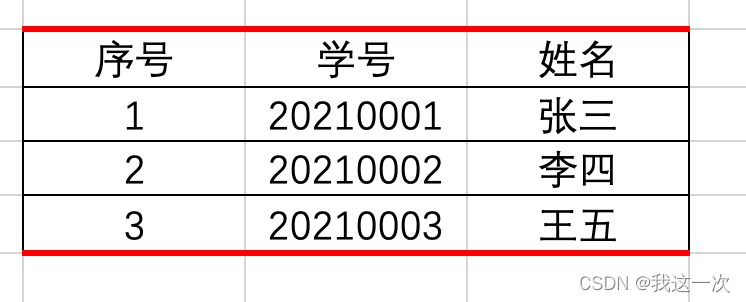
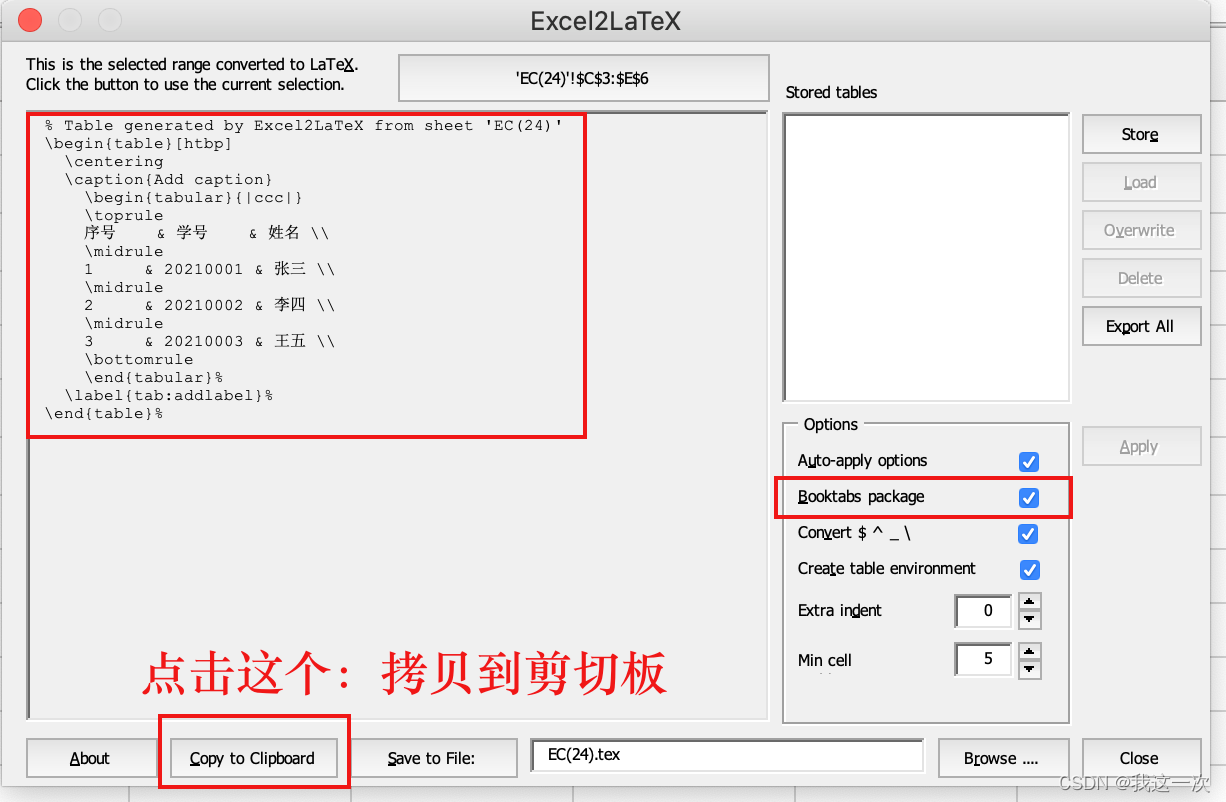
接着,选中需要转换为latex代码的表格信息,选择excel上方的“加载项”,接着选择相应的图标。

选择“copy to Clipboard”,将生成的latex代码复制到剪切板。
将拷贝的代码放到latex中,这个是放在Beamer中的效果:

运行上面的代码,得到的效果如下所示:

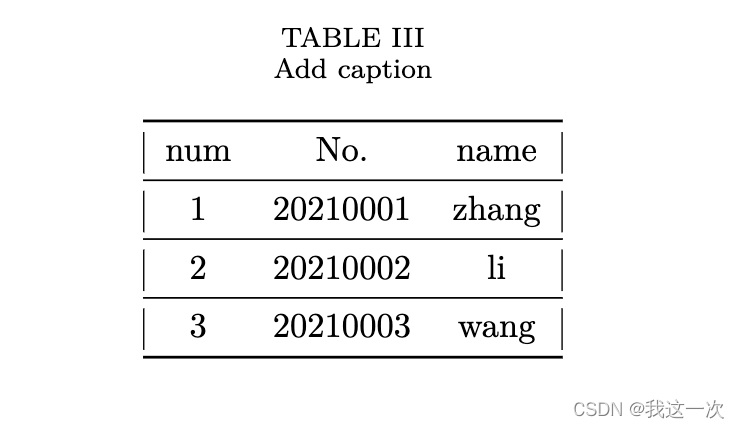
将拷贝的代码放到latex中,这个是放在latex论文中排版的效果:

步骤3:注意事项
要注意使用的Latex或者Beamer对中文和英文的支持效果。
针对使用过程中竖线被截断的问题,可以参考博文的方法进行解决:Excel2LaTeX表格竖线截断问题解决。
竖线截断解决方案简易总结如下:
1、首先在Excel中,需要将所有的灰色虚线去除(划重点!!)(将excel里面的灰色线条去掉:点击‘视图’,取消勾选‘网格线’)
2、其次,对LaTeX代码做一定改动,即将 \toprule 、\midrule 、\bottomrule修改为 \hline,将 \cmidrule修改为 \cline
简易版使用总结:
% 1、选中表格
% 2、点击'加载项'的'convert table to latex'
% 3、点击弹窗的'Copy to Clipboard'(复制到剪切板)

% 不勾选booktabs(三线表),加包\usepackage{

    bigstrut,multirow,rotating}
% 勾选booktabs(三线表),加包\usepackage{

    booktabs}
步骤4:如何调整表格的行距和列距
在论文中如果需要使用booktabs(三线表),那么一定要注意导入如下的包:
\usepackage{

    booktabs}
但是,在使用的过程中会发现表格的行距和列距并不是我们想要的,这时就需要根据表格的实际情况调整表格的行距和列距。具体方法包括下面几个步骤:
#1.在文档前引用包
\usepackage{
booktabs}
#2.在代码中加上关键的4行:
\begingroup
\setlength{
\tabcolsep}{
3pt} % 调整列间距 Default value: 6pt
\renewcommand{
\arraystretch}{
1.5} % 调整行间距 Default value: 1
****
\endgroup
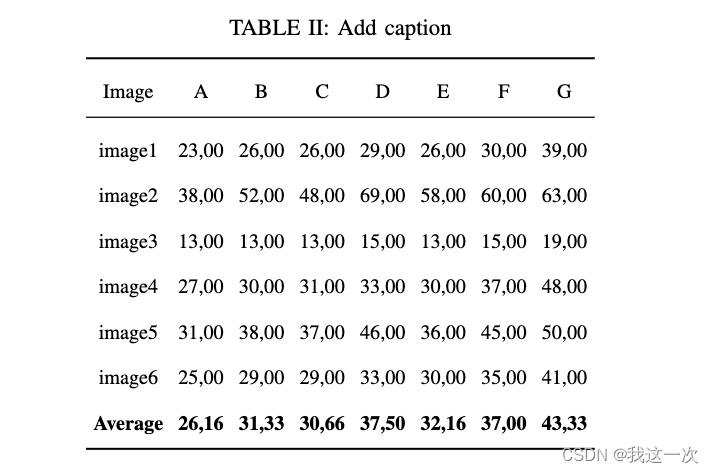
#3.完整的代码
\begin{
table}[htbp]
\centering
\caption{
Add caption}
\begingroup %这一行要加!!!!!!
\setlength{
\tabcolsep}{
3pt} % 调整列间距 Default value: 6pt
\renewcommand{
\arraystretch}{
2} % 调整行间距 Default value: 1
\begin{
tabular}{
cccccccc}
\toprule
Image & A & B & C & D & E & F & G \\
\midrule
image1 & 23,00 & 26,00 & 26,00 & 29,00 & 26,00 & 30,00 & 39,00 \\
image2 & 38,00 & 52,00 & 48,00 & 69,00 & 58,00 & 60,00 & 63,00 \\
image3 & 13,00 & 13,00 & 13,00 & 15,00 & 13,00 & 15,00 & 19,00 \\
image4 & 27,00 & 30,00 & 31,00 & 33,00 & 30,00 & 37,00 & 48,00 \\
image5 & 31,00 & 38,00 & 37,00 & 46,00 & 36,00 & 45,00 & 50,00 \\
image6 & 25,00 & 29,00 & 29,00 & 33,00 & 30,00 & 35,00 & 41,00 \\
\textbf{
Average} & \textbf{
26,16} & \textbf{
31,33} & \textbf{
30,66} & \textbf{
37,50} & \textbf{
32,16} & \textbf{
37,00} & \textbf{
43,33} \\
\bottomrule
\end{
tabular}%这一行要加!!!!!!
\endgroup
\label{
tab:addlabel}%
\end{
table}%
运行之后的效果如图: