写在前面
我们一直在推R绘制的基础教程,一是书籍的推荐,二是学习代码的推荐。在现在啥啥都可以“度娘”的时代,网络资源真的很多。我们在网络上基本可以查到自己想要的内容(PS:只要你想查)。今天也推荐小杜自己收藏的一个使用R语言绘图的网址:The R Graph Gallery.
教程网址
https://r-graph-gallery.com/
网站内容
里面包含了很多图形的绘制基础代码,基本可以根据代码直接出图,很是方便。


每个图形你点击进去后,就会出现这个图形的绘制代码。
操作例子
- 点击
Edge bundling

- 进去后也有不同的选项


- 点击你想要的图形,显示绘图代码

绘图代码
- 加载数据
#'@加载数据
library(ggraph)
library(igraph)
library(tidyverse)
##'@创建数据框架
set.seed(1234)
d1 <- data.frame(from="origin", to=paste("group", seq(1,10), sep=""))
d2 <- data.frame(from=rep(d1$to, each=10), to=paste("subgroup", seq(1,100), sep="_"))
hierarchy <- rbind(d1, d2)
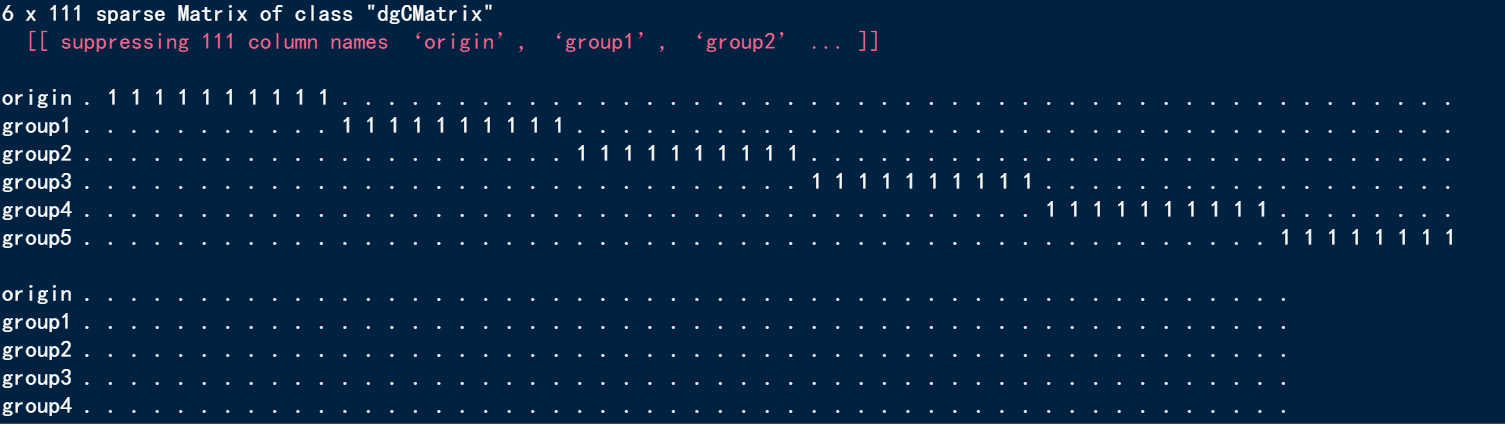
head(hierarchy)
##'@创建数据
all_leaves <- paste("subgroup", seq(1,100), sep="_")
connect <- rbind(
data.frame( from=sample(all_leaves, 100, replace=T) , to=sample(all_leaves, 100, replace=T)),
data.frame( from=sample(head(all_leaves), 30, replace=T) , to=sample( tail(all_leaves), 30, replace=T)),
data.frame( from=sample(all_leaves[25:30], 30, replace=T) , to=sample( all_leaves[55:60], 30, replace=T)),
data.frame( from=sample(all_leaves[75:80], 30, replace=T) , to=sample( all_leaves[55:60], 30, replace=T)) )
connect$value <- runif(nrow(connect))
# create a vertices data.frame. One line per object of our hierarchy
vertices <- data.frame(
name = unique(c(as.character(hierarchy$from), as.character(hierarchy$to))) ,
value = runif(111)
)
#'@添加分组
vertices$group <- hierarchy$from[ match( vertices$name, hierarchy$to ) ]
# Create a graph object
mygraph <- graph_from_data_frame( hierarchy, vertices=vertices )
# The connection object must refer to the ids of the leaves:
from <- match( connect$from, vertices$name)
to <- match( connect$to, vertices$name)
- 数据
- 绘制基础图形
##'@绘制基础图形
ggraph(mygraph, layout = 'dendrogram', circular = TRUE) +
  geom_conn_bundle(data = get_con(from = from, to = to), alpha=0.2, colour="skyblue", tension = .5) +
  geom_node_point(aes(filter = leaf, x = x*1.05, y=y*1.05)) +
  theme_void()

美化图形
给了几种美化图形的方案,你可以作为参考进行修改。我们这里就不统一罗列出来。
p <- ggraph(mygraph, layout = 'dendrogram', circular = TRUE) +
  geom_node_point(aes(filter = leaf, x = x*1.05, y=y*1.05)) +
  theme_void()
# 0.1
p +  geom_conn_bundle(data = get_con(from = from, to = to), alpha=0.2, colour="skyblue", width=0.9,
                      tension=0.1)

颜色参数
# Use the 'value' column of the connection data frame for the color:
p +  geom_conn_bundle(data = get_con(from = from, to = to), aes(colour=value, alpha=value))

p +
  geom_conn_bundle(data = get_con(from = from, to = to), width=1, alpha=0.2, aes(colour=..index..)) +
  scale_edge_colour_distiller(palette = "RdPu") +
  theme(legend.position = "none")
ggsave("color02.pdf",width = 6, height = 6)

更多详情,可自行进行查看。


往期文章:
1. 最全WGCNA教程(替换数据即可出全部结果与图形)
2. 精美图形绘制教程
小杜的生信筆記,主要发表或收录生物信息学的教程,以及基于R的分析和可视化(包括数据分析,图形绘制等);分享感兴趣的文献和学习资料!!