library(ggplot2)
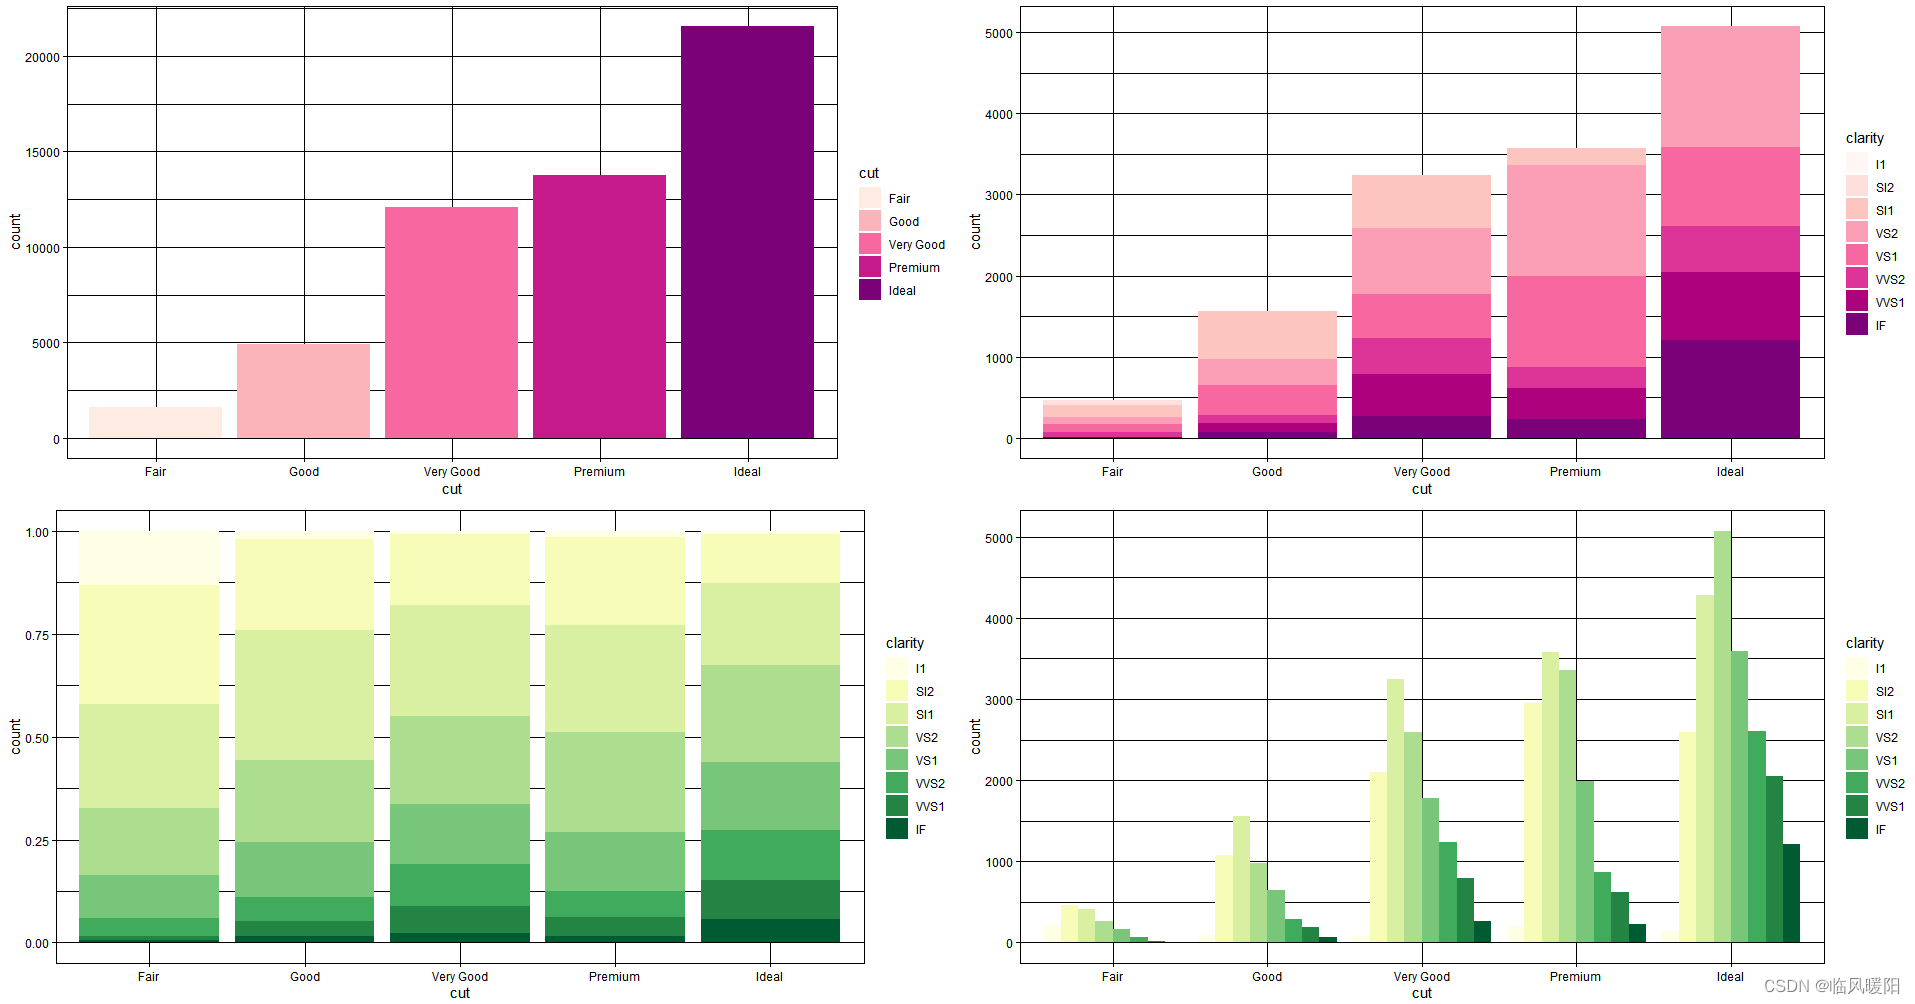
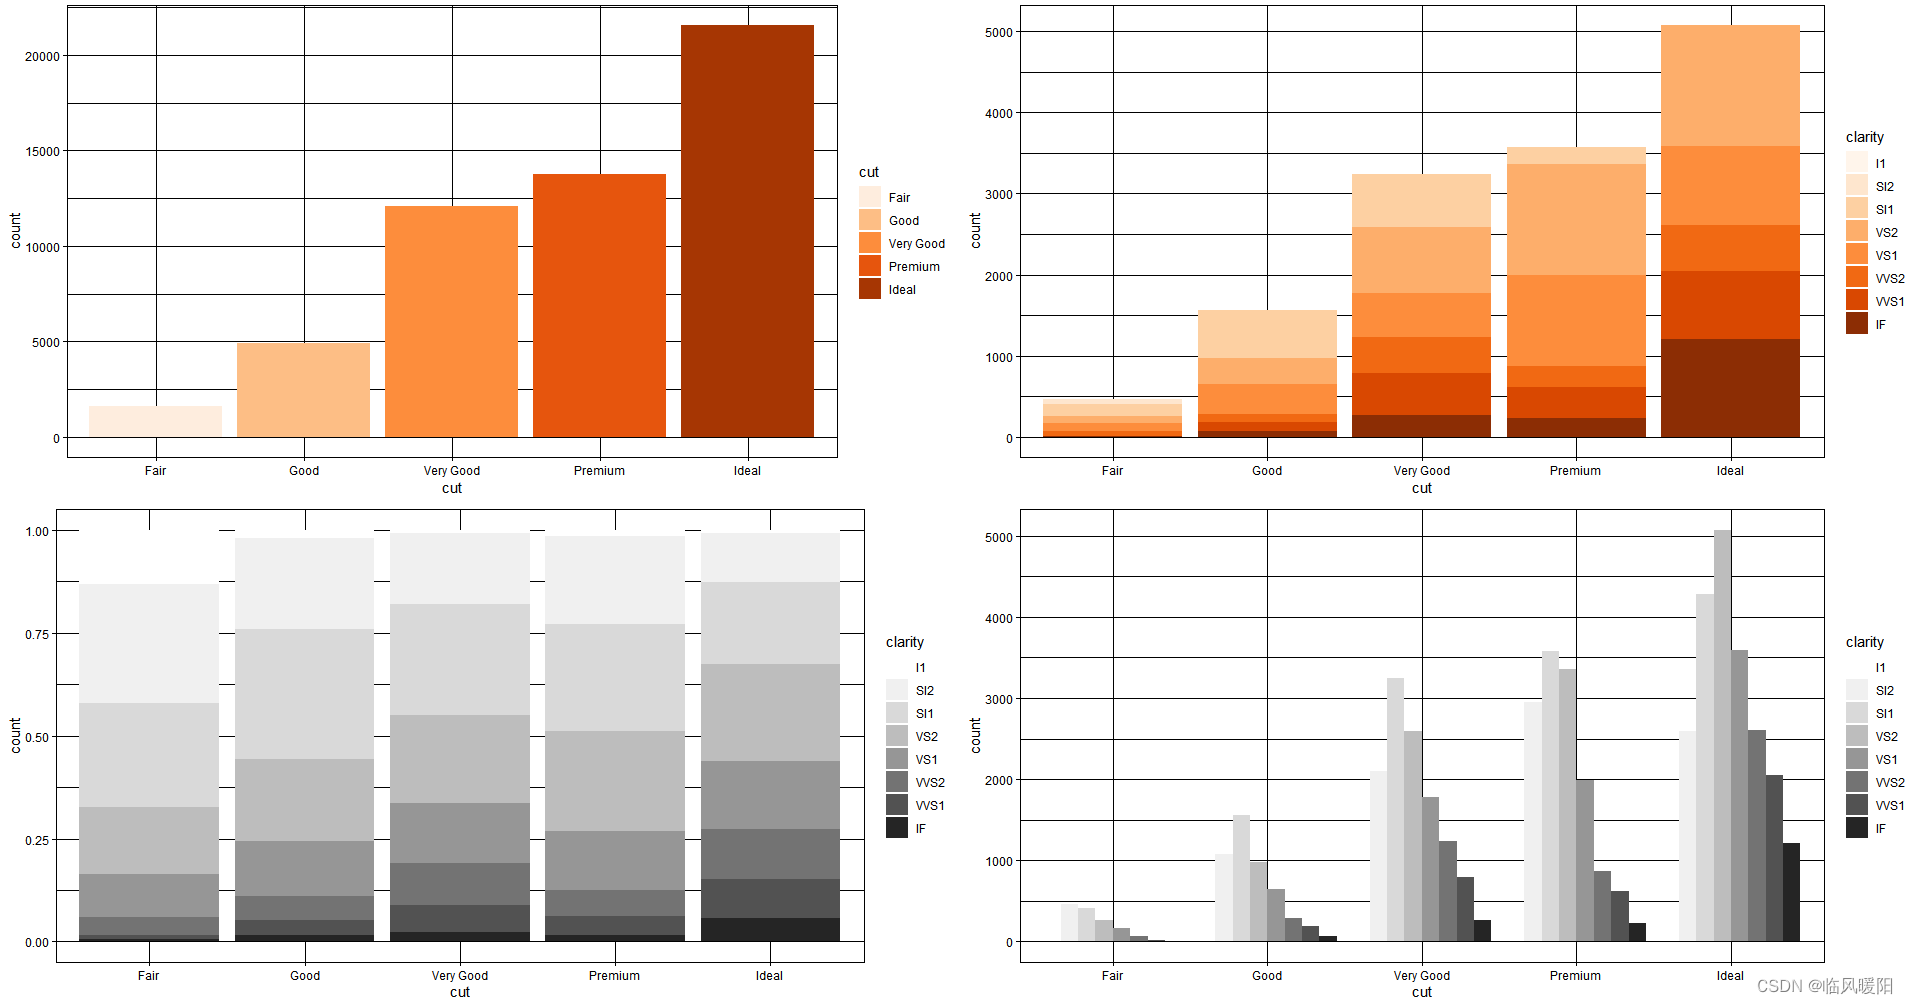
# 普通的直方图
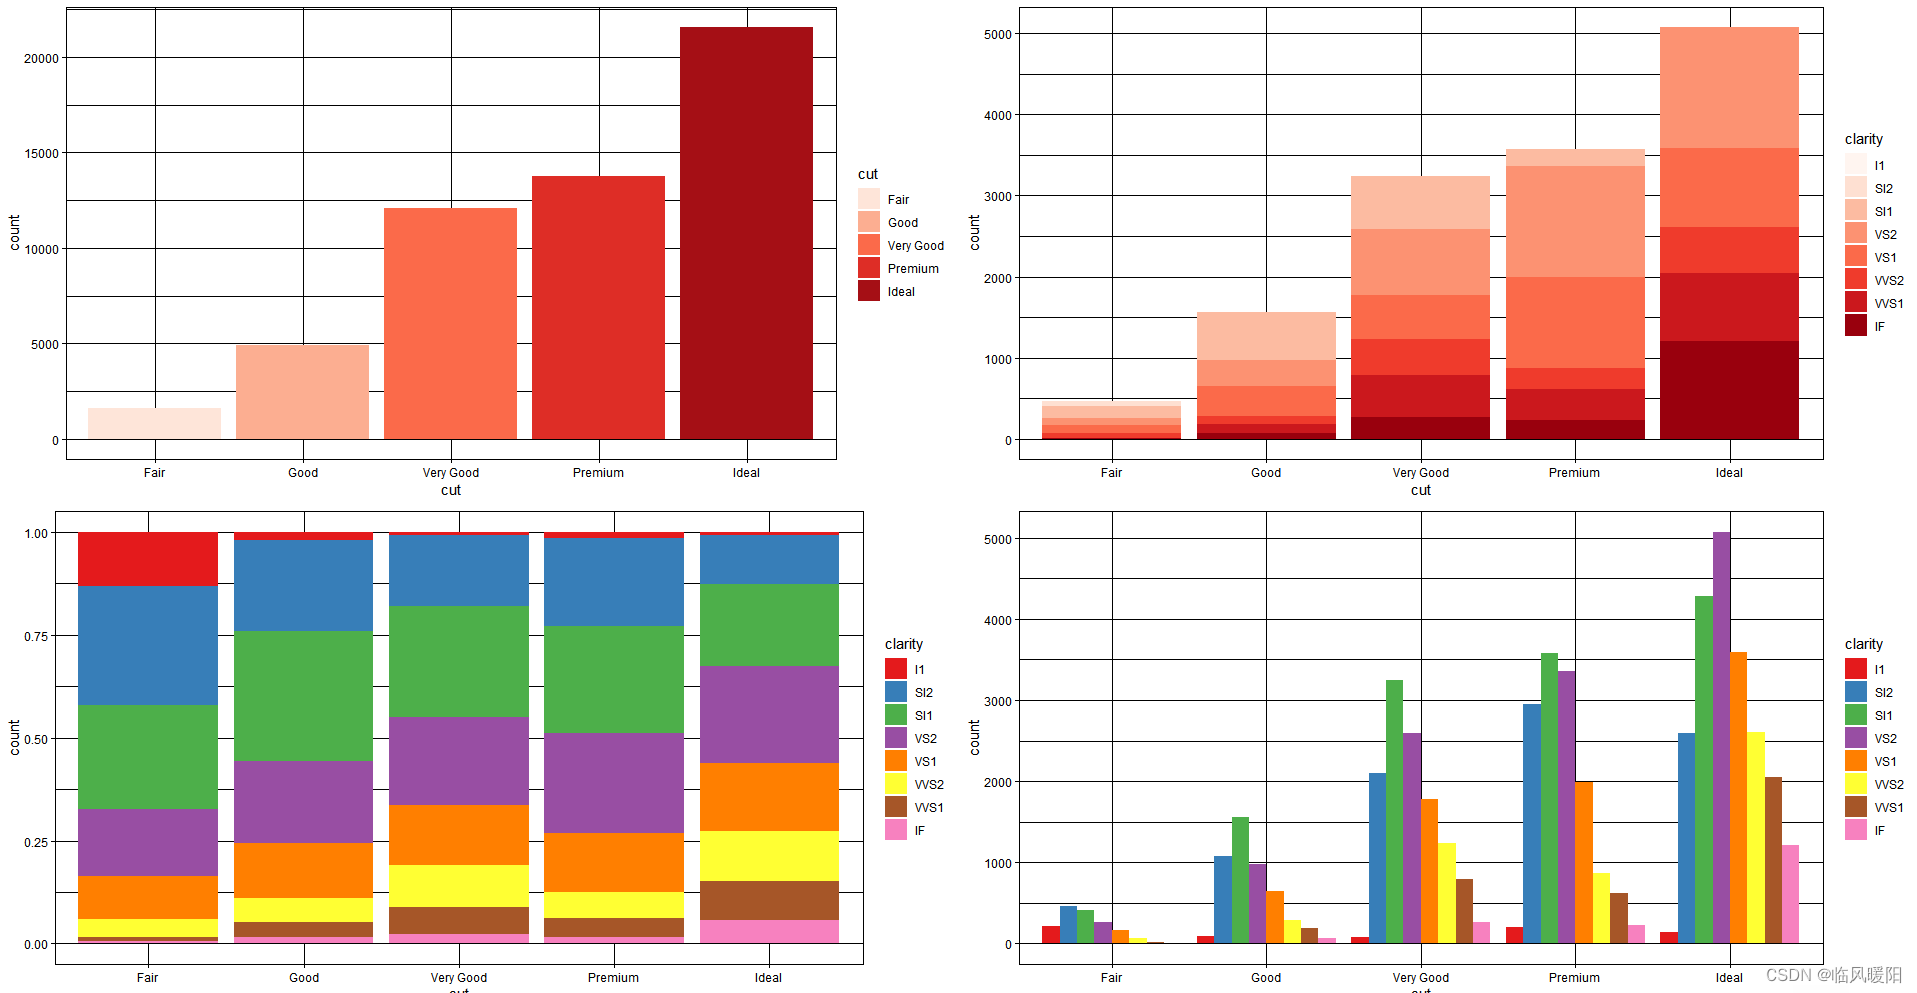
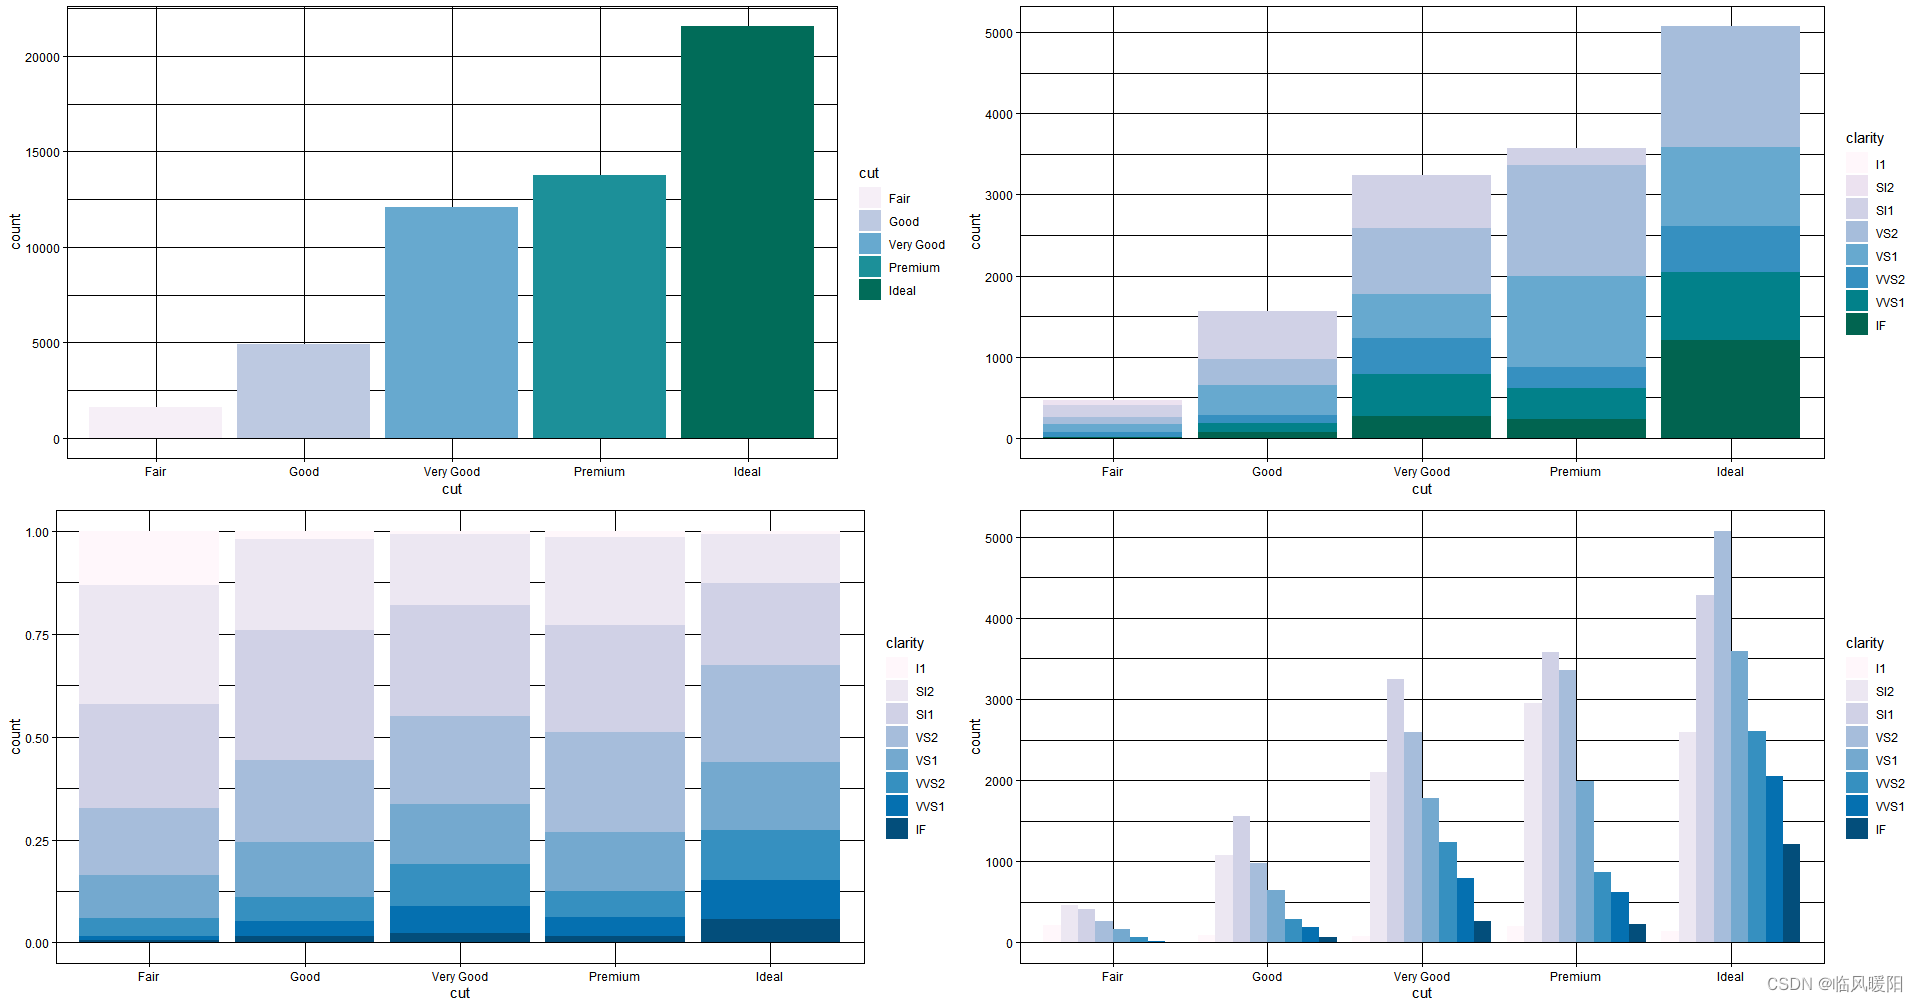
p1 <- ggplot(data = diamonds) +
geom_bar(mapping = aes(x = cut, fill = cut)) +
theme_linedraw() +
scale_fill_brewer(palette = "Reds")
# 堆积直方图
p2 <- ggplot(data = diamonds) +
geom_bar(mapping = aes(x = cut, fill = clarity), position = "identity") +
theme_linedraw() +
scale_fill_brewer(palette = "Reds")
# 累积直方图
p3 <- ggplot(data = diamonds) +
geom_bar(mapping = aes(x = cut, fill = clarity), position = "fill") +
theme_linedraw() +
scale_fill_brewer(palette = "Set1")
# 分类直方图
p4 <- ggplot(data = diamonds) +
geom_bar(mapping = aes(x = cut, fill = clarity), position = "dodge") +
theme_linedraw() +
scale_fill_brewer(palette = "Set1")
# 构造ggplot图片列表
plots <- list(p1, p2, p3, p4)
# 自定义图片布局
gridExtra::grid.arrange(grobs = plots, ncol = 2)
# 普通的直方图
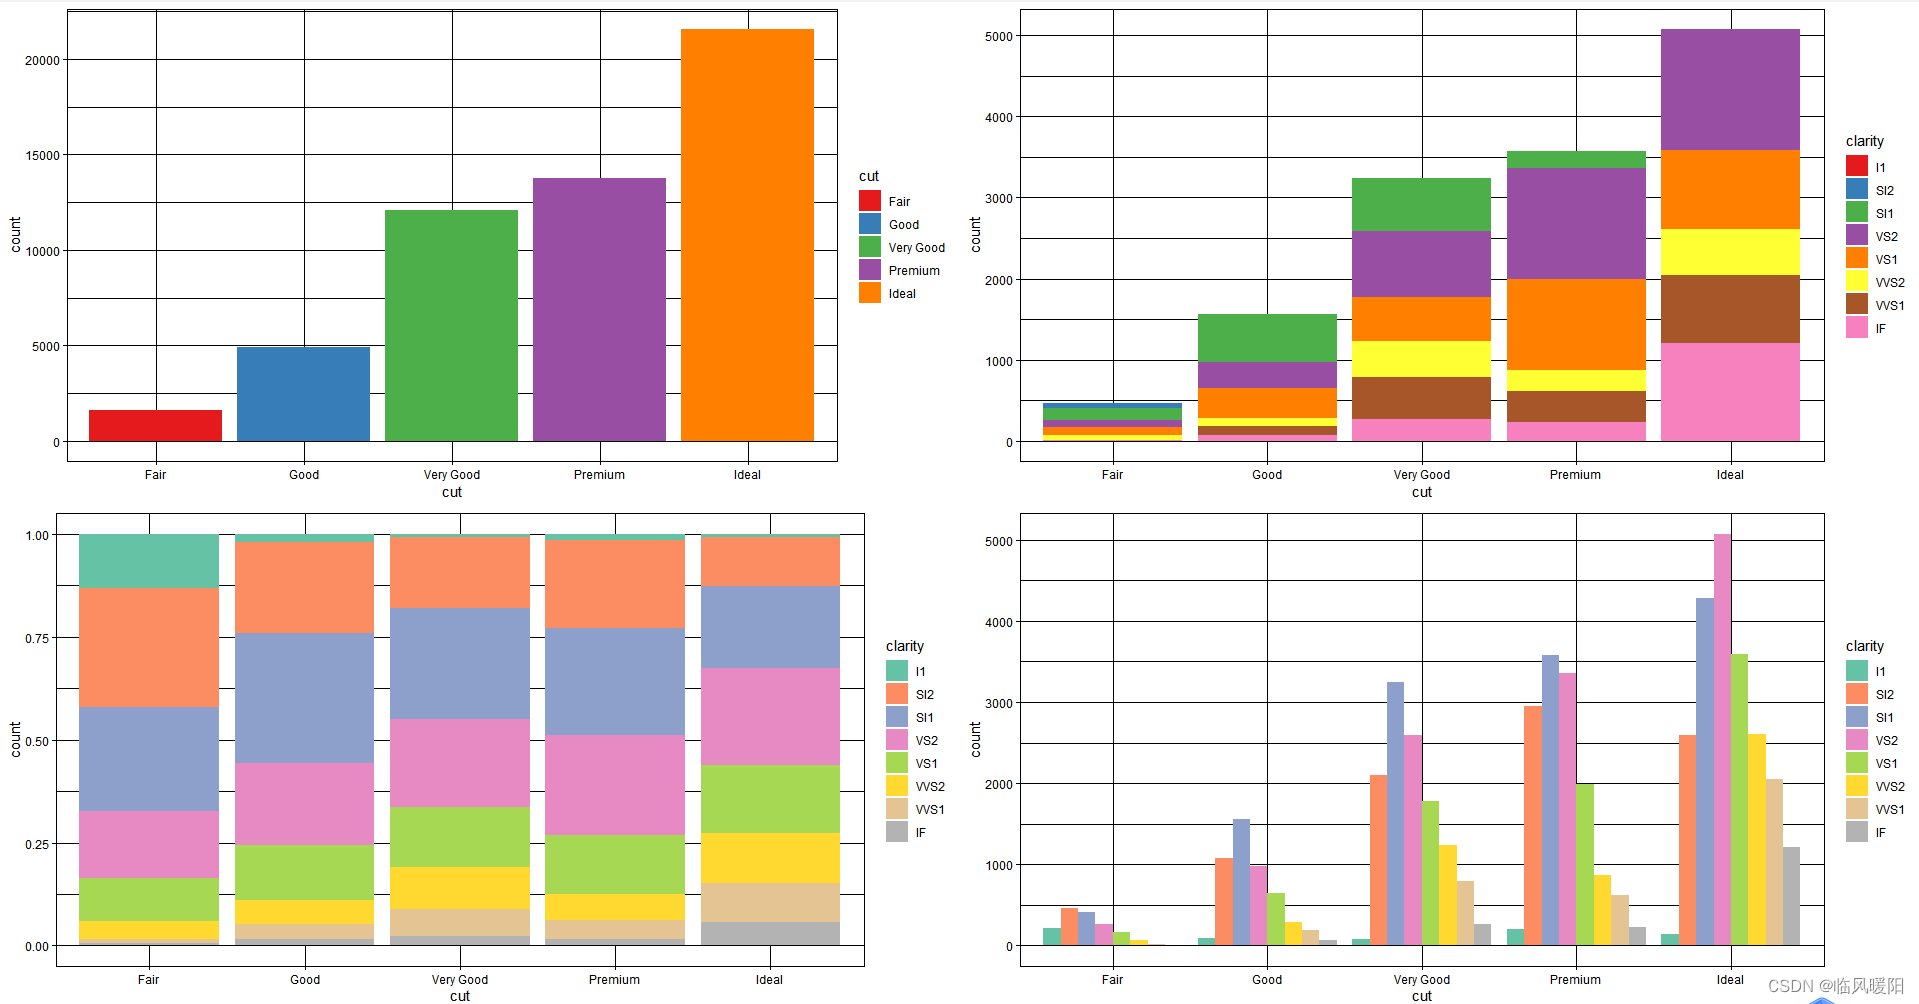
p1 <- ggplot(data = diamonds) +
geom_bar(mapping = aes(x = cut, fill = cut)) +
theme_linedraw() +
scale_fill_brewer(palette = "Set1")
# 堆积直方图
p2 <- ggplot(data = diamonds) +
geom_bar(mapping = aes(x = cut, fill = clarity), position = "identity") +
theme_linedraw() +
scale_fill_brewer(palette = "Set1")
# 累积直方图
p3 <- ggplot(data = diamonds) +
geom_bar(mapping = aes(x = cut, fill = clarity), position = "fill") +
theme_linedraw() +
scale_fill_brewer(palette = "Set2")
# 分类直方图
p4 <- ggplot(data = diamonds) +
geom_bar(mapping = aes(x = cut, fill = clarity), position = "dodge") +
theme_linedraw() +
scale_fill_brewer(palette = "Set2")
# 普通的直方图
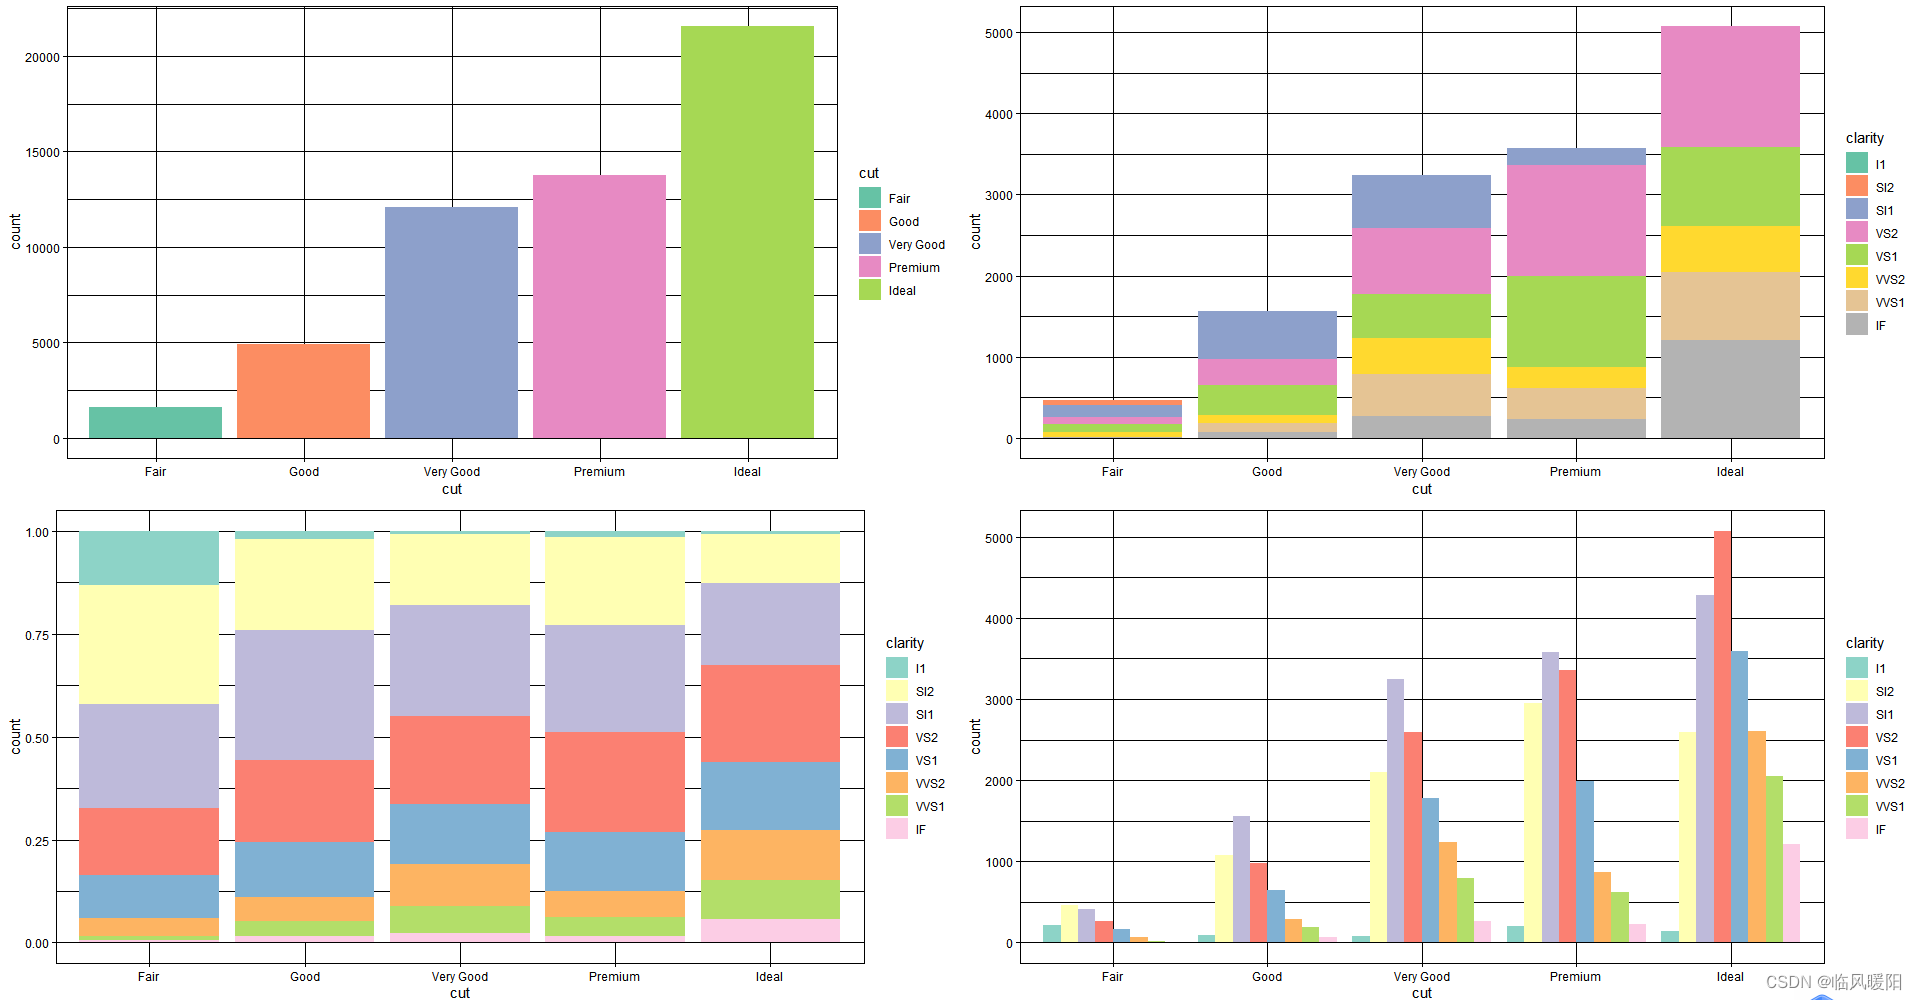
p1 <- ggplot(data = diamonds) +
geom_bar(mapping = aes(x = cut, fill = cut)) +
theme_linedraw() +
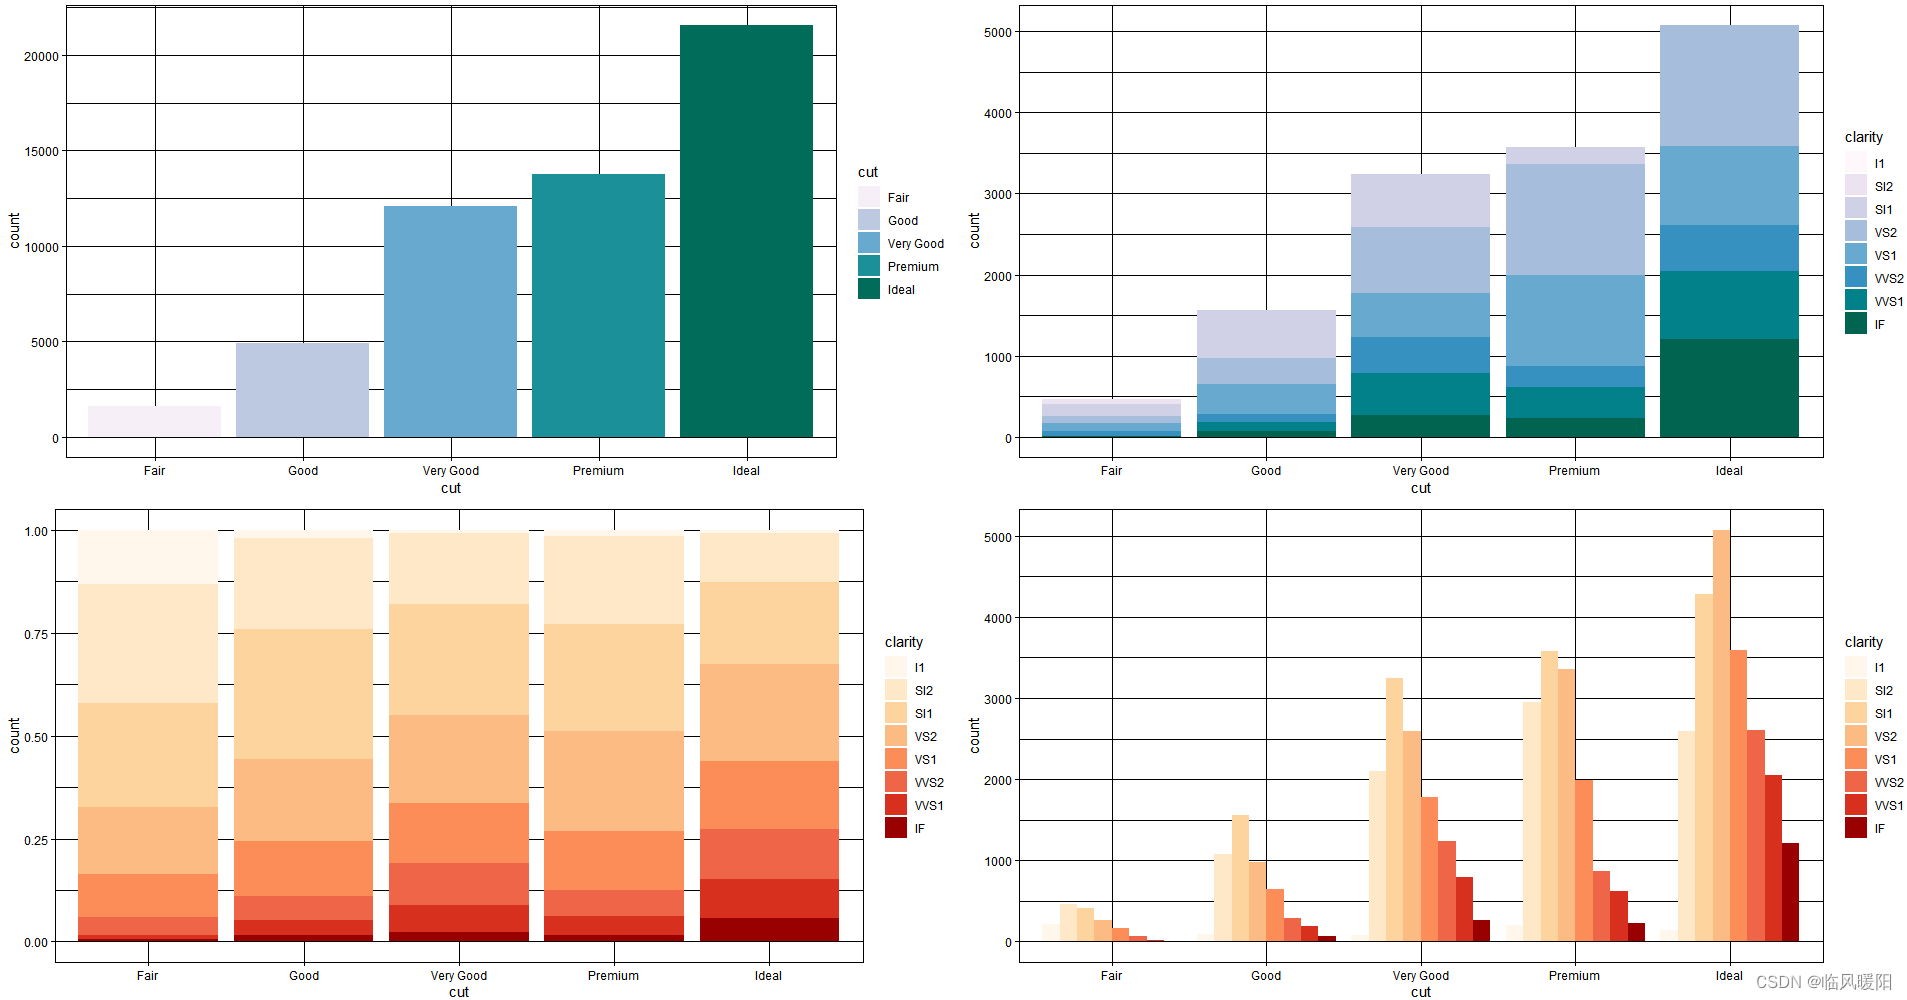
scale_fill_brewer(palette = "Set2")
# 堆积直方图
p2 <- ggplot(data = diamonds) +
geom_bar(mapping = aes(x = cut, fill = clarity), position = "identity") +
theme_linedraw() +
scale_fill_brewer(palette = "Set2")
# 累积直方图
p3 <- ggplot(data = diamonds) +
geom_bar(mapping = aes(x = cut, fill = clarity), position = "fill") +
theme_linedraw() +
scale_fill_brewer(palette = "Set3")
# 分类直方图
p4 <- ggplot(data = diamonds) +
geom_bar(mapping = aes(x = cut, fill = clarity), position = "dodge") +
theme_linedraw() +
scale_fill_brewer(palette = "Set3")
# 普通的直方图
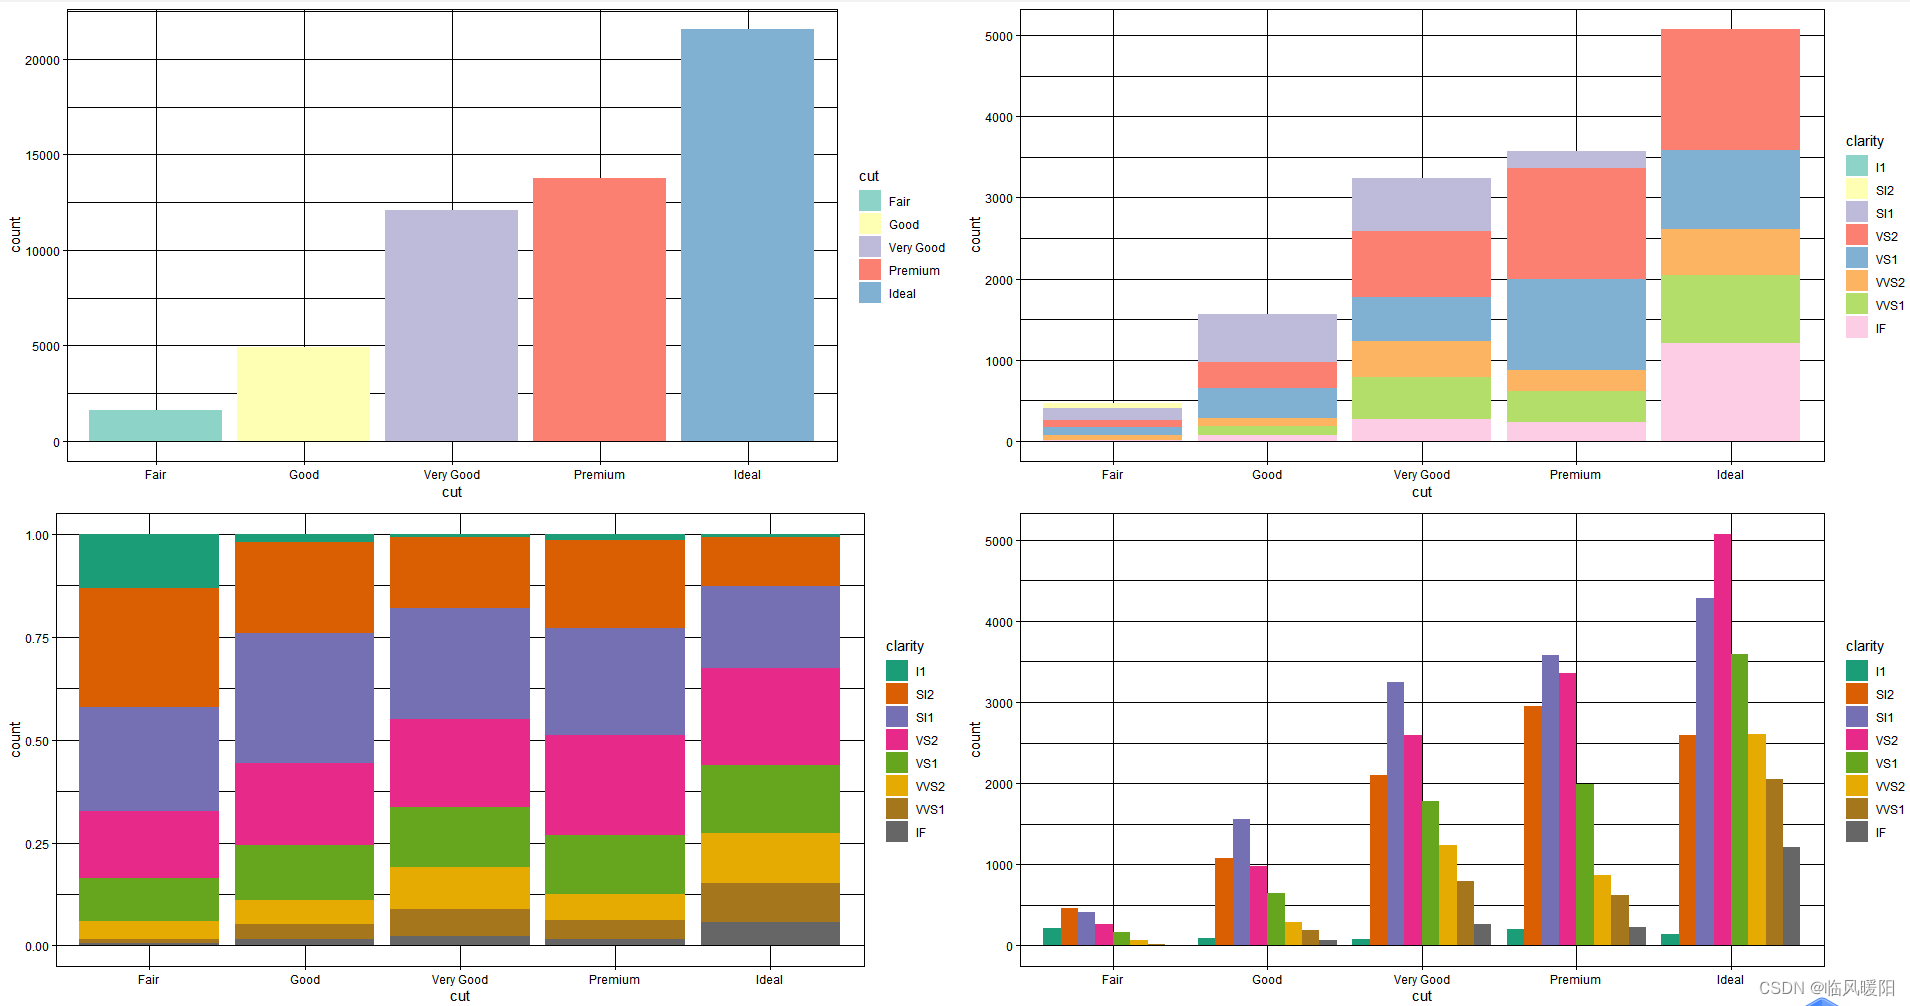
p1 <- ggplot(data = diamonds) +
geom_bar(mapping = aes(x = cut, fill = cut)) +
theme_linedraw() +
scale_fill_brewer(palette = "Set3")
# 堆积直方图
p2 <- ggplot(data = diamonds) +
geom_bar(mapping = aes(x = cut, fill = clarity), position = "identity") +
theme_linedraw() +
scale_fill_brewer(palette = "Set3")
# 累积直方图
p3 <- ggplot(data = diamonds) +
geom_bar(mapping = aes(x = cut, fill = clarity), position = "fill") +
theme_linedraw() +
scale_fill_brewer(palette = "Dark2")
# 分类直方图
p4 <- ggplot(data = diamonds) +
geom_bar(mapping = aes(x = cut, fill = clarity), position = "dodge") +
theme_linedraw() +
scale_fill_brewer(palette = "Dark2")
# 普通的直方图
p1 <- ggplot(data = diamonds) +
  geom_bar(mapping = aes(x = cut, fill = cut)) +
  theme_linedraw() +
  scale_fill_brewer(palette = "Dark2")

# 堆积直方图
p2 <- ggplot(data = diamonds) +
  geom_bar(mapping = aes(x = cut, fill = clarity), position = "identity") +
  theme_linedraw() +
  scale_fill_brewer(palette = "Dark2")

# 累积直方图
p3 <- ggplot(data = diamonds) +
  geom_bar(mapping = aes(x = cut, fill = clarity), position = "fill") +
  theme_linedraw() +
  scale_fill_brewer(palette = "Paired")

# 分类直方图
p4 <- ggplot(data = diamonds) +
  geom_bar(mapping = aes(x = cut, fill = clarity), position = "dodge") +
  theme_linedraw() +
  scale_fill_brewer(palette = "Paired")

# 普通的直方图
p1 <- ggplot(data = diamonds) +
geom_bar(mapping = aes(x = cut, fill = cut)) +
theme_linedraw() +
scale_fill_brewer(palette = "Paired")
# 堆积直方图
p2 <- ggplot(data = diamonds) +
geom_bar(mapping = aes(x = cut, fill = clarity), position = "identity") +
theme_linedraw() +
scale_fill_brewer(palette = "Paired")
# 累积直方图
p3 <- ggplot(data = diamonds) +
geom_bar(mapping = aes(x = cut, fill = clarity), position = "fill") +
theme_linedraw() +
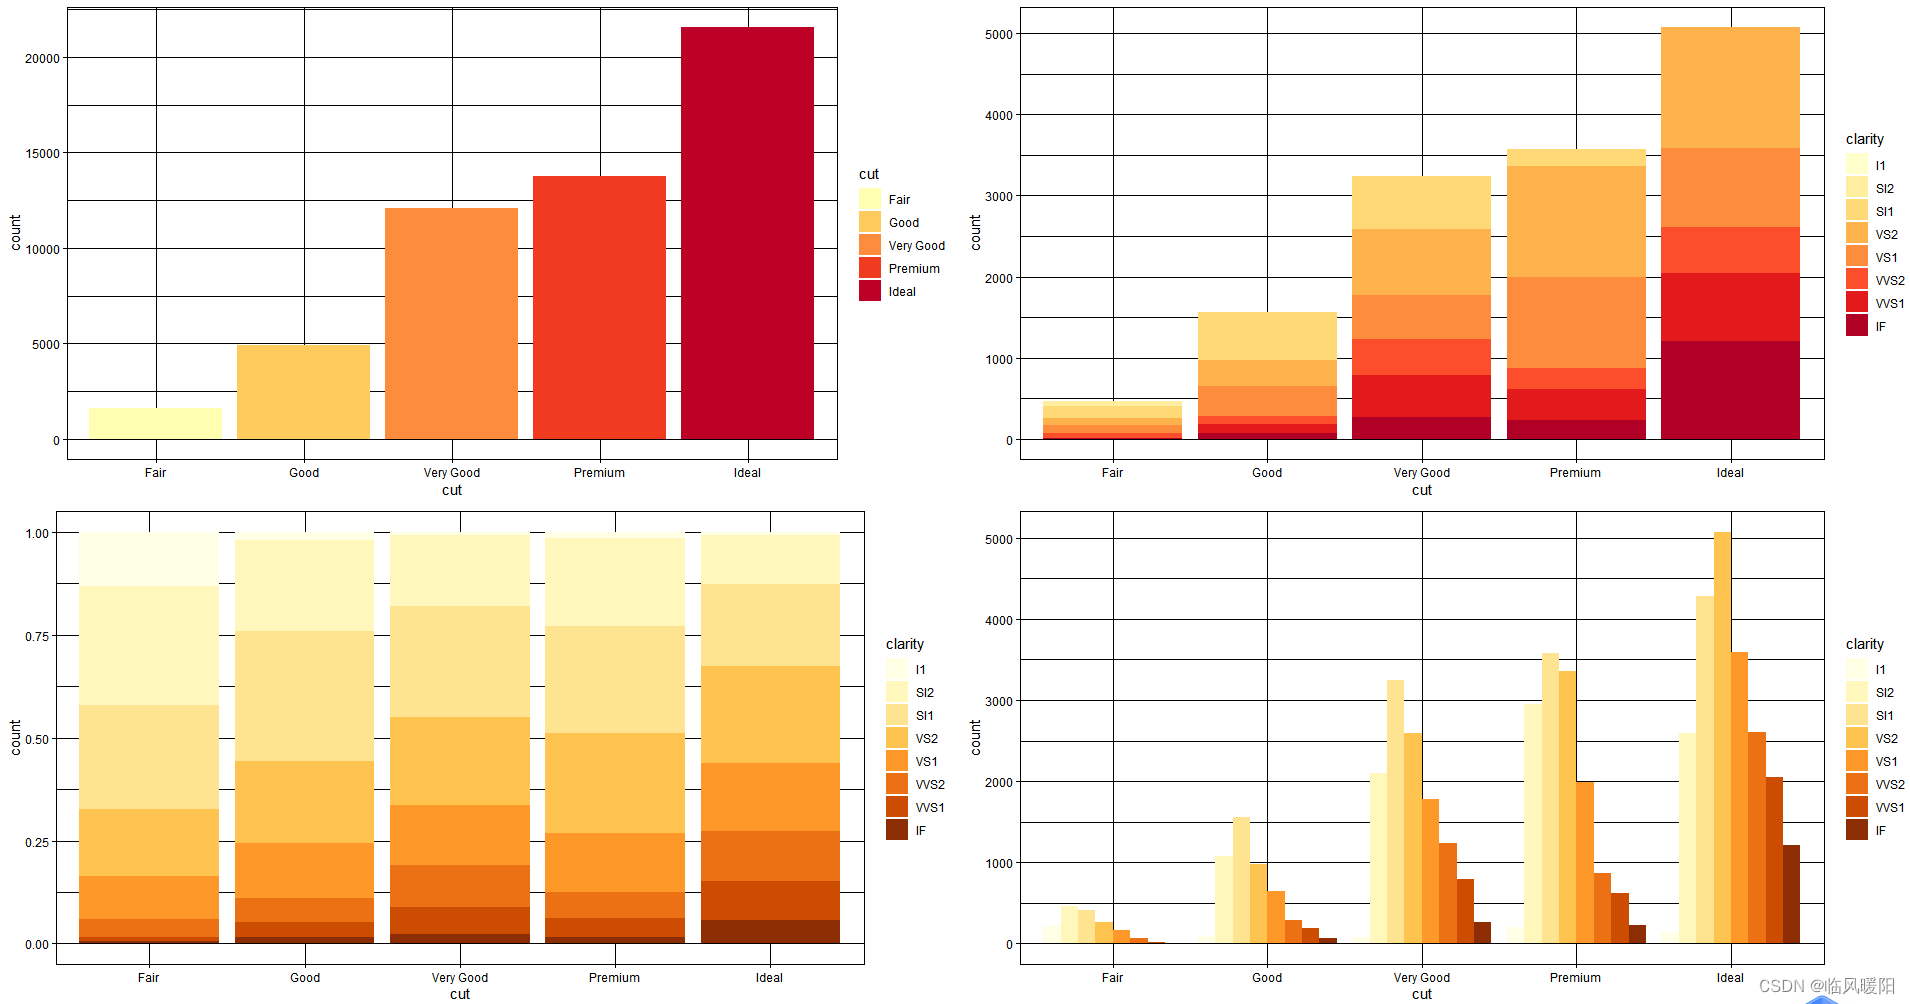
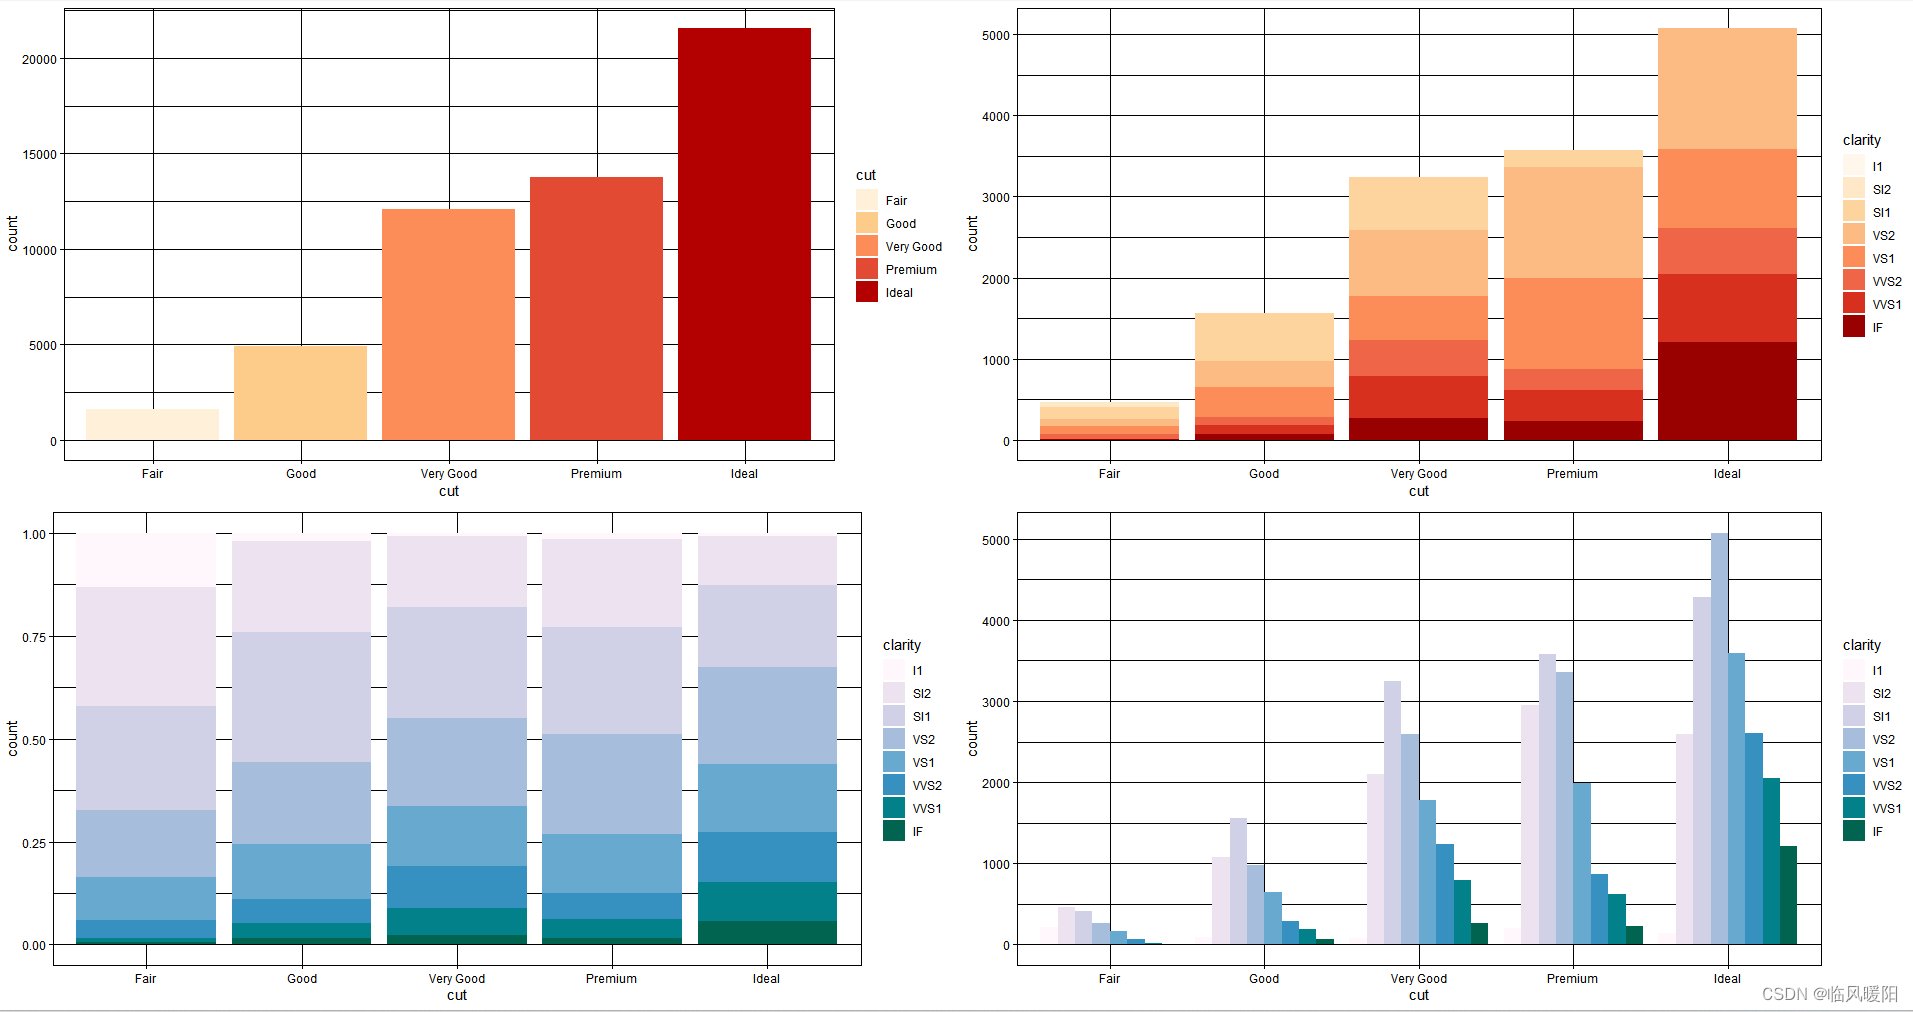
scale_fill_brewer(palette = "YlOrRd")
# 分类直方图
p4 <- ggplot(data = diamonds) +
geom_bar(mapping = aes(x = cut, fill = clarity), position = "dodge") +
theme_linedraw() +
scale_fill_brewer(palette = "YlOrRd")

# 普通的直方图
p1 <- ggplot(data = diamonds) +
  geom_bar(mapping = aes(x = cut, fill = cut)) +
  theme_linedraw() +
  scale_fill_brewer(palette = "YlOrRd")

# 堆积直方图
p2 <- ggplot(data = diamonds) +
  geom_bar(mapping = aes(x = cut, fill = clarity), position = "identity") +
  theme_linedraw() +
  scale_fill_brewer(palette = "YlOrRd")

# 累积直方图
p3 <- ggplot(data = diamonds) +
  geom_bar(mapping = aes(x = cut, fill = clarity), position = "fill") +
  theme_linedraw() +
  scale_fill_brewer(palette = "YlOrBr")

# 分类直方图
p4 <- ggplot(data = diamonds) +
  geom_bar(mapping = aes(x = cut, fill = clarity), position = "dodge") +
  theme_linedraw() +
  scale_fill_brewer(palette = "YlOrBr")
# 普通的直方图
p1 <- ggplot(data = diamonds) +
geom_bar(mapping = aes(x = cut, fill = cut)) +
theme_linedraw() +
scale_fill_brewer(palette = "YlOrBr")
# 堆积直方图
p2 <- ggplot(data = diamonds) +
geom_bar(mapping = aes(x = cut, fill = clarity), position = "identity") +
theme_linedraw() +
scale_fill_brewer(palette = "YlOrBr")
# 累积直方图
p3 <- ggplot(data = diamonds) +
geom_bar(mapping = aes(x = cut, fill = clarity), position = "fill") +
theme_linedraw() +
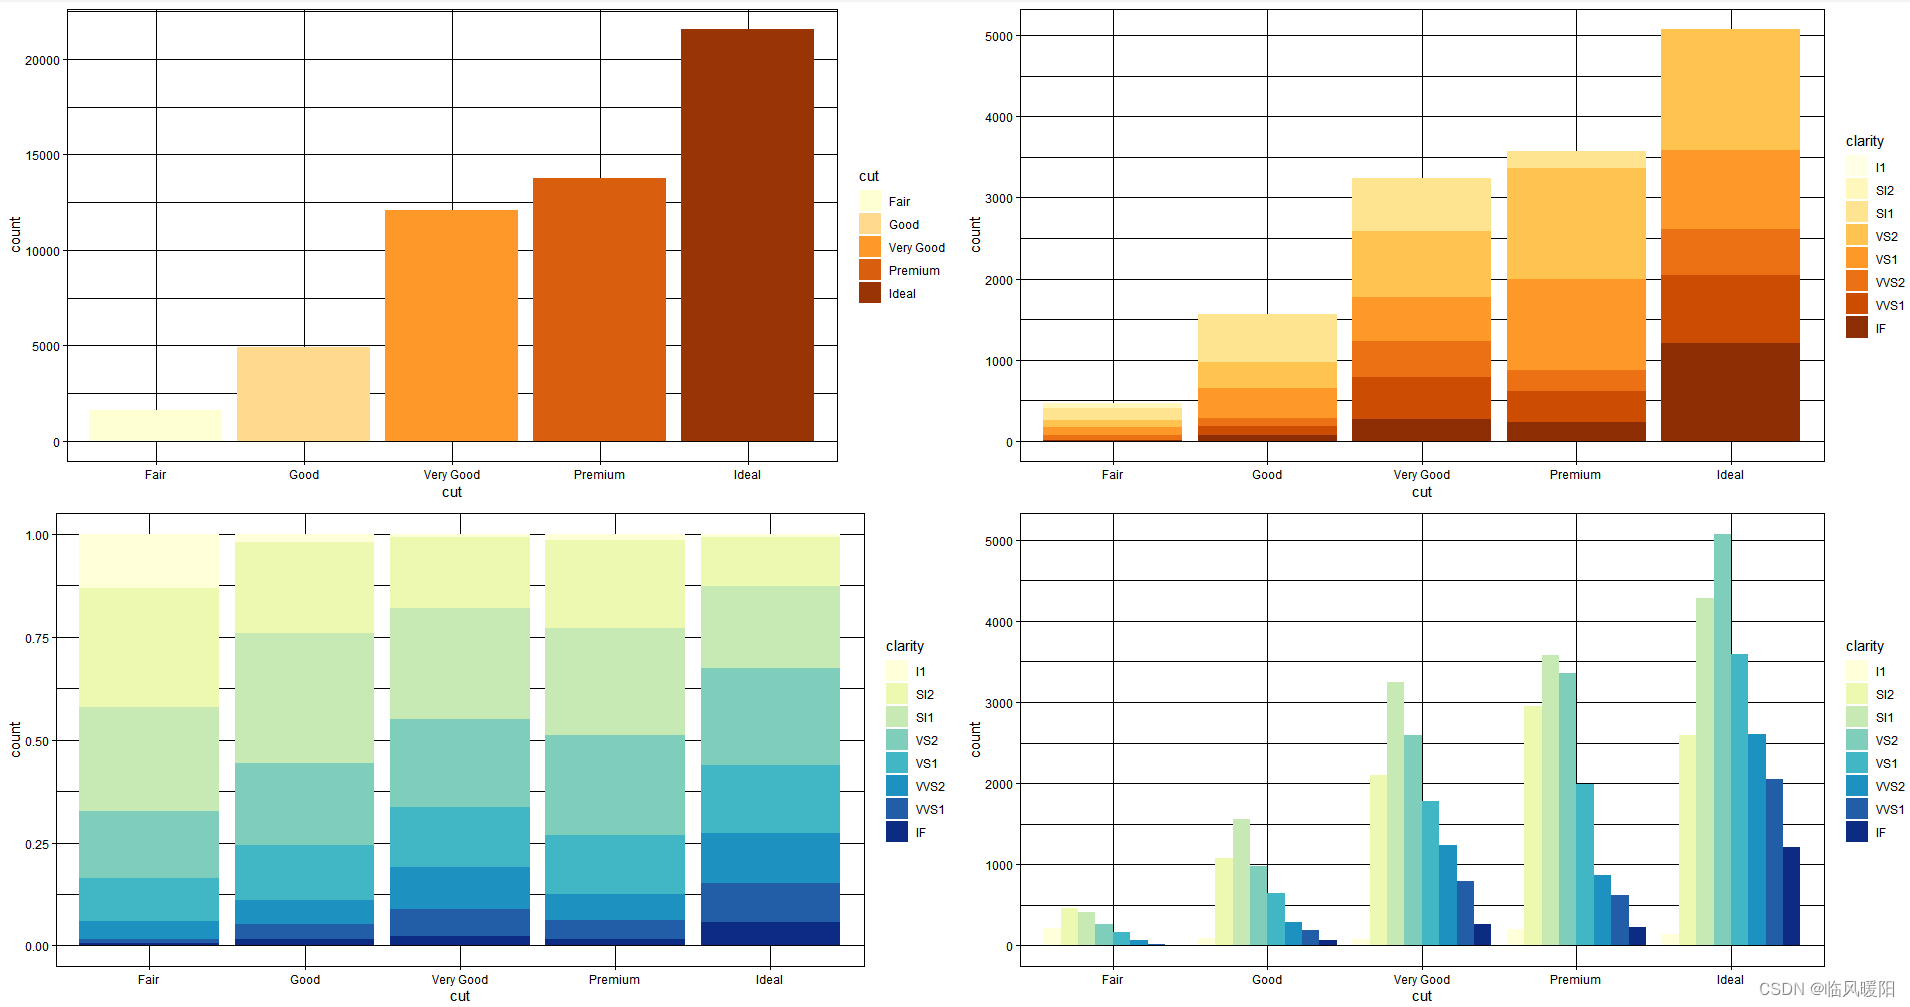
scale_fill_brewer(palette = "YlGnBu")
# 分类直方图
p4 <- ggplot(data = diamonds) +
geom_bar(mapping = aes(x = cut, fill = clarity), position = "dodge") +
theme_linedraw() +
scale_fill_brewer(palette = "YlGnBu")
# 普通的直方图
p1 <- ggplot(data = diamonds) +
geom_bar(mapping = aes(x = cut, fill = cut)) +
theme_linedraw() +
scale_fill_brewer(palette = "YlGnBu")
# 堆积直方图
p2 <- ggplot(data = diamonds) +
geom_bar(mapping = aes(x = cut, fill = clarity), position = "identity") +
theme_linedraw() +
scale_fill_brewer(palette = "YlGnBu")
# 累积直方图
p3 <- ggplot(data = diamonds) +
geom_bar(mapping = aes(x = cut, fill = clarity), position = "fill") +
theme_linedraw() +
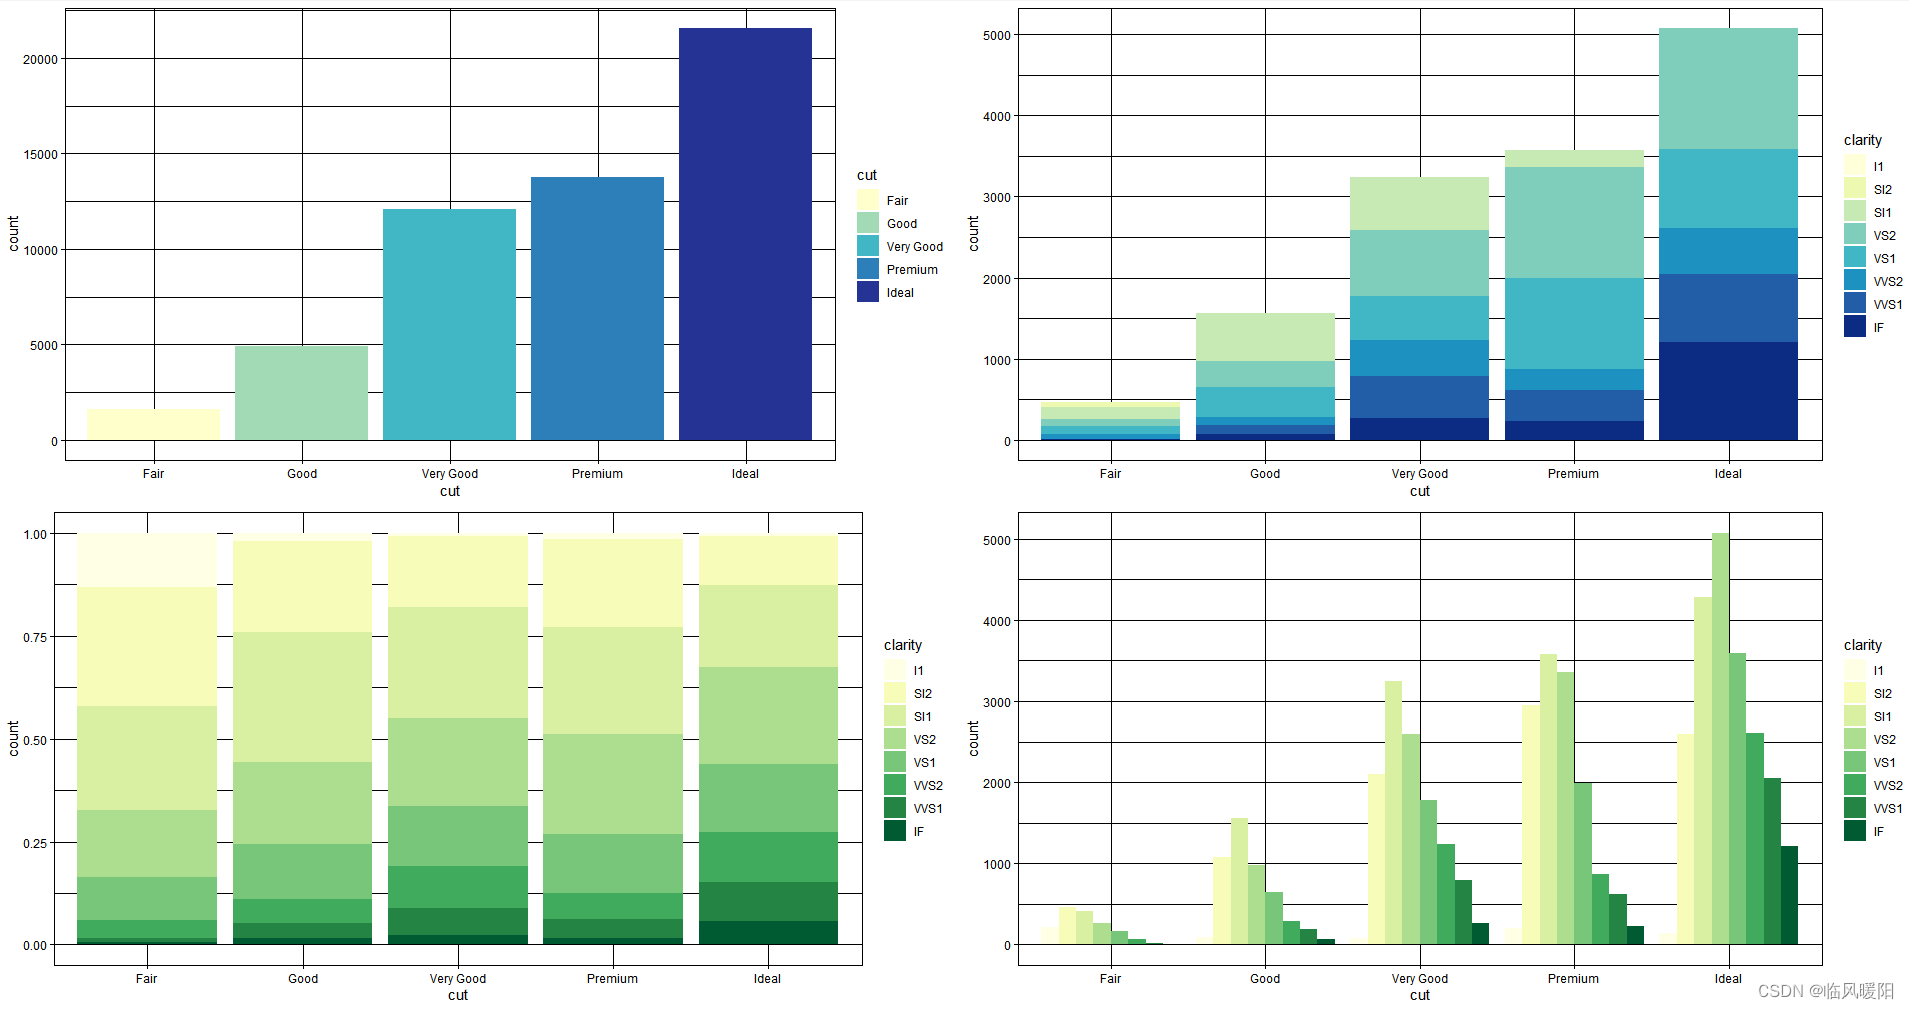
scale_fill_brewer(palette = "YlGn")
# 分类直方图
p4 <- ggplot(data = diamonds) +
geom_bar(mapping = aes(x = cut, fill = clarity), position = "dodge") +
theme_linedraw() +
scale_fill_brewer(palette = "YlGn")
# 普通的直方图
p1 <- ggplot(data = diamonds) +
  geom_bar(mapping = aes(x = cut, fill = cut)) +
  theme_linedraw() +
  scale_fill_brewer(palette = "YlGn")

# 堆积直方图
p2 <- ggplot(data = diamonds) +
  geom_bar(mapping = aes(x = cut, fill = clarity), position = "identity") +
  theme_linedraw() +
  scale_fill_brewer(palette = "YlGn")

# 累积直方图
p3 <- ggplot(data = diamonds) +
  geom_bar(mapping = aes(x = cut, fill = clarity), position = "fill") +
  theme_linedraw() +
  scale_fill_brewer(palette = "Reds")

# 分类直方图
p4 <- ggplot(data = diamonds) +
  geom_bar(mapping = aes(x = cut, fill = clarity), position = "dodge") +
  theme_linedraw() +
  scale_fill_brewer(palette = "Reds")
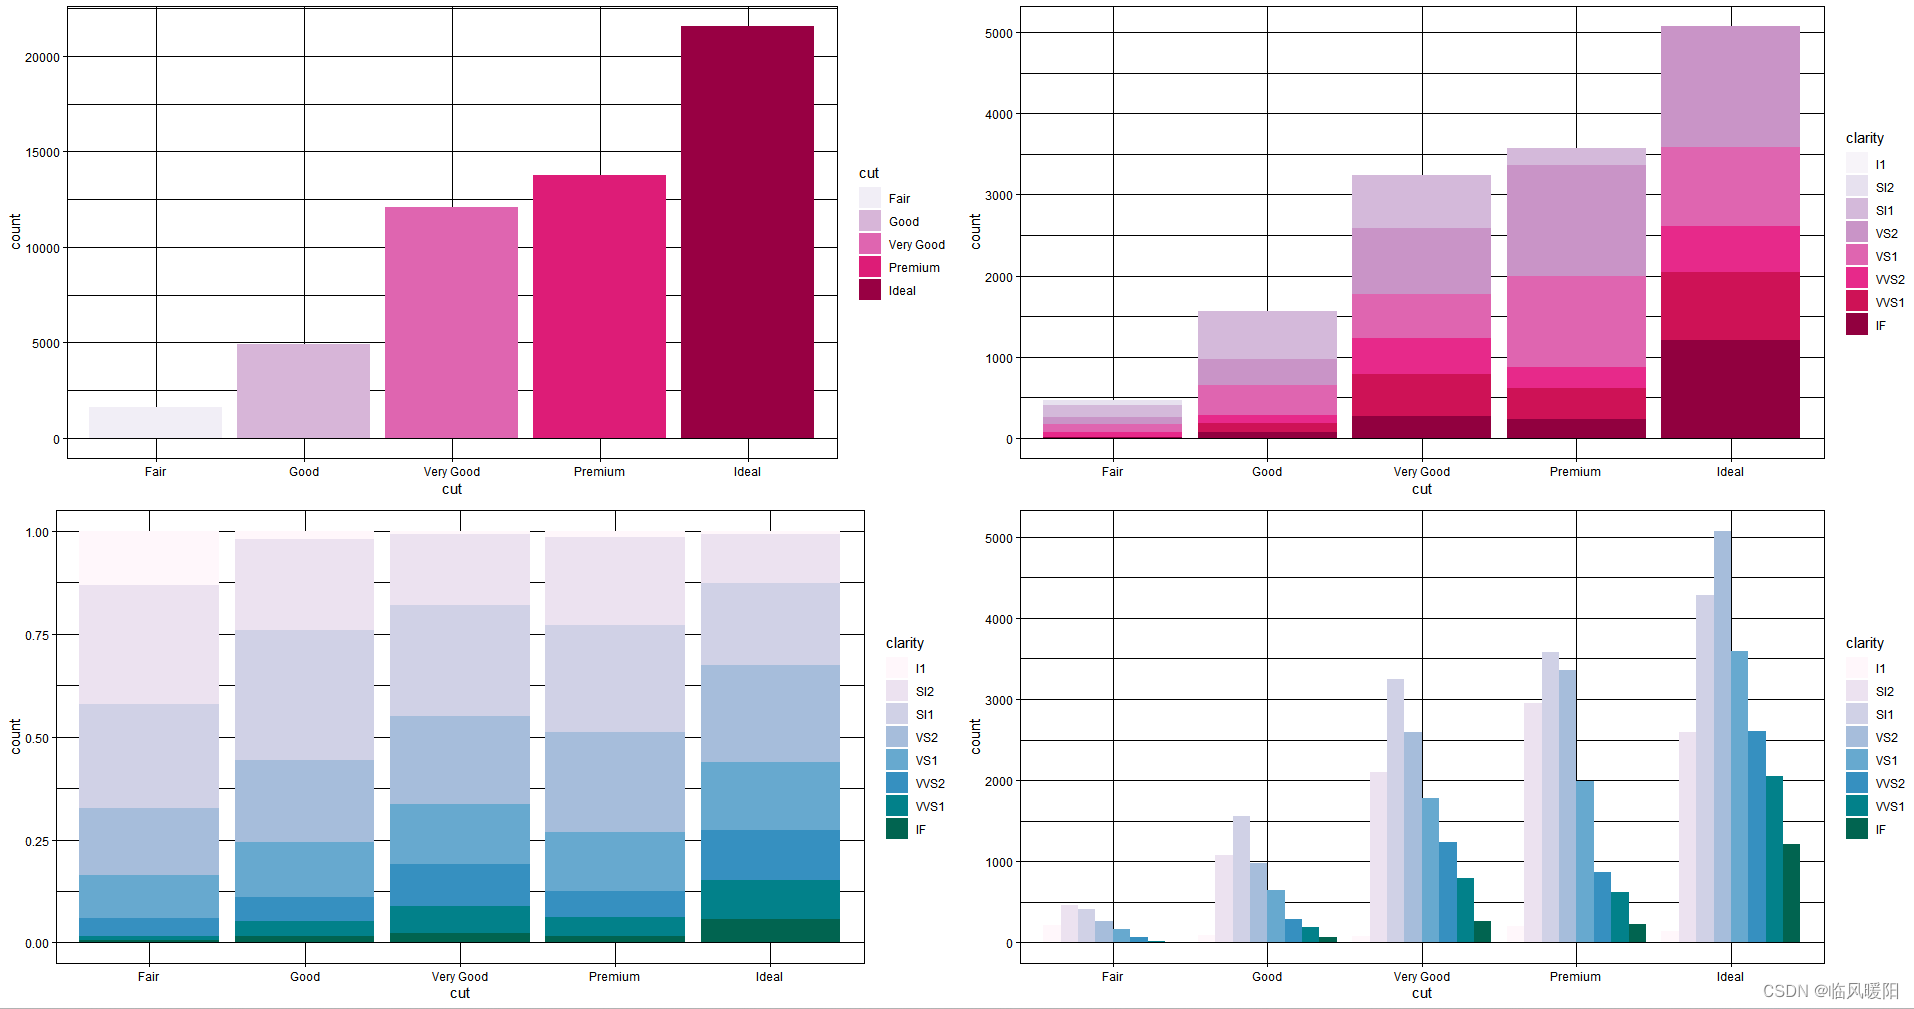
# 普通的直方图
p1 <- ggplot(data = diamonds) +
  geom_bar(mapping = aes(x = cut, fill = cut)) +
  theme_linedraw() +
  scale_fill_brewer(palette = "RdPu")

# 堆积直方图
p2 <- ggplot(data = diamonds) +
  geom_bar(mapping = aes(x = cut, fill = clarity), position = "identity") +
  theme_linedraw() +
  scale_fill_brewer(palette = "RdPu")

# 累积直方图
p3 <- ggplot(data = diamonds) +
  geom_bar(mapping = aes(x = cut, fill = clarity), position = "fill") +
  theme_linedraw() +
  scale_fill_brewer(palette = "YlGn")

# 分类直方图
p4 <- ggplot(data = diamonds) +
  geom_bar(mapping = aes(x = cut, fill = clarity), position = "dodge") +
  theme_linedraw() +
  scale_fill_brewer(palette = "YlGn")
# 普通的直方图
p1 <- ggplot(data = diamonds) +
geom_bar(mapping = aes(x = cut, fill = cut)) +
theme_linedraw() +
scale_fill_brewer(palette = "YlGn")
# 堆积直方图
p2 <- ggplot(data = diamonds) +
geom_bar(mapping = aes(x = cut, fill = clarity), position = "identity") +
theme_linedraw() +
scale_fill_brewer(palette = "YlGn")
# 累积直方图
p3 <- ggplot(data = diamonds) +
geom_bar(mapping = aes(x = cut, fill = clarity), position = "fill") +
theme_linedraw() +
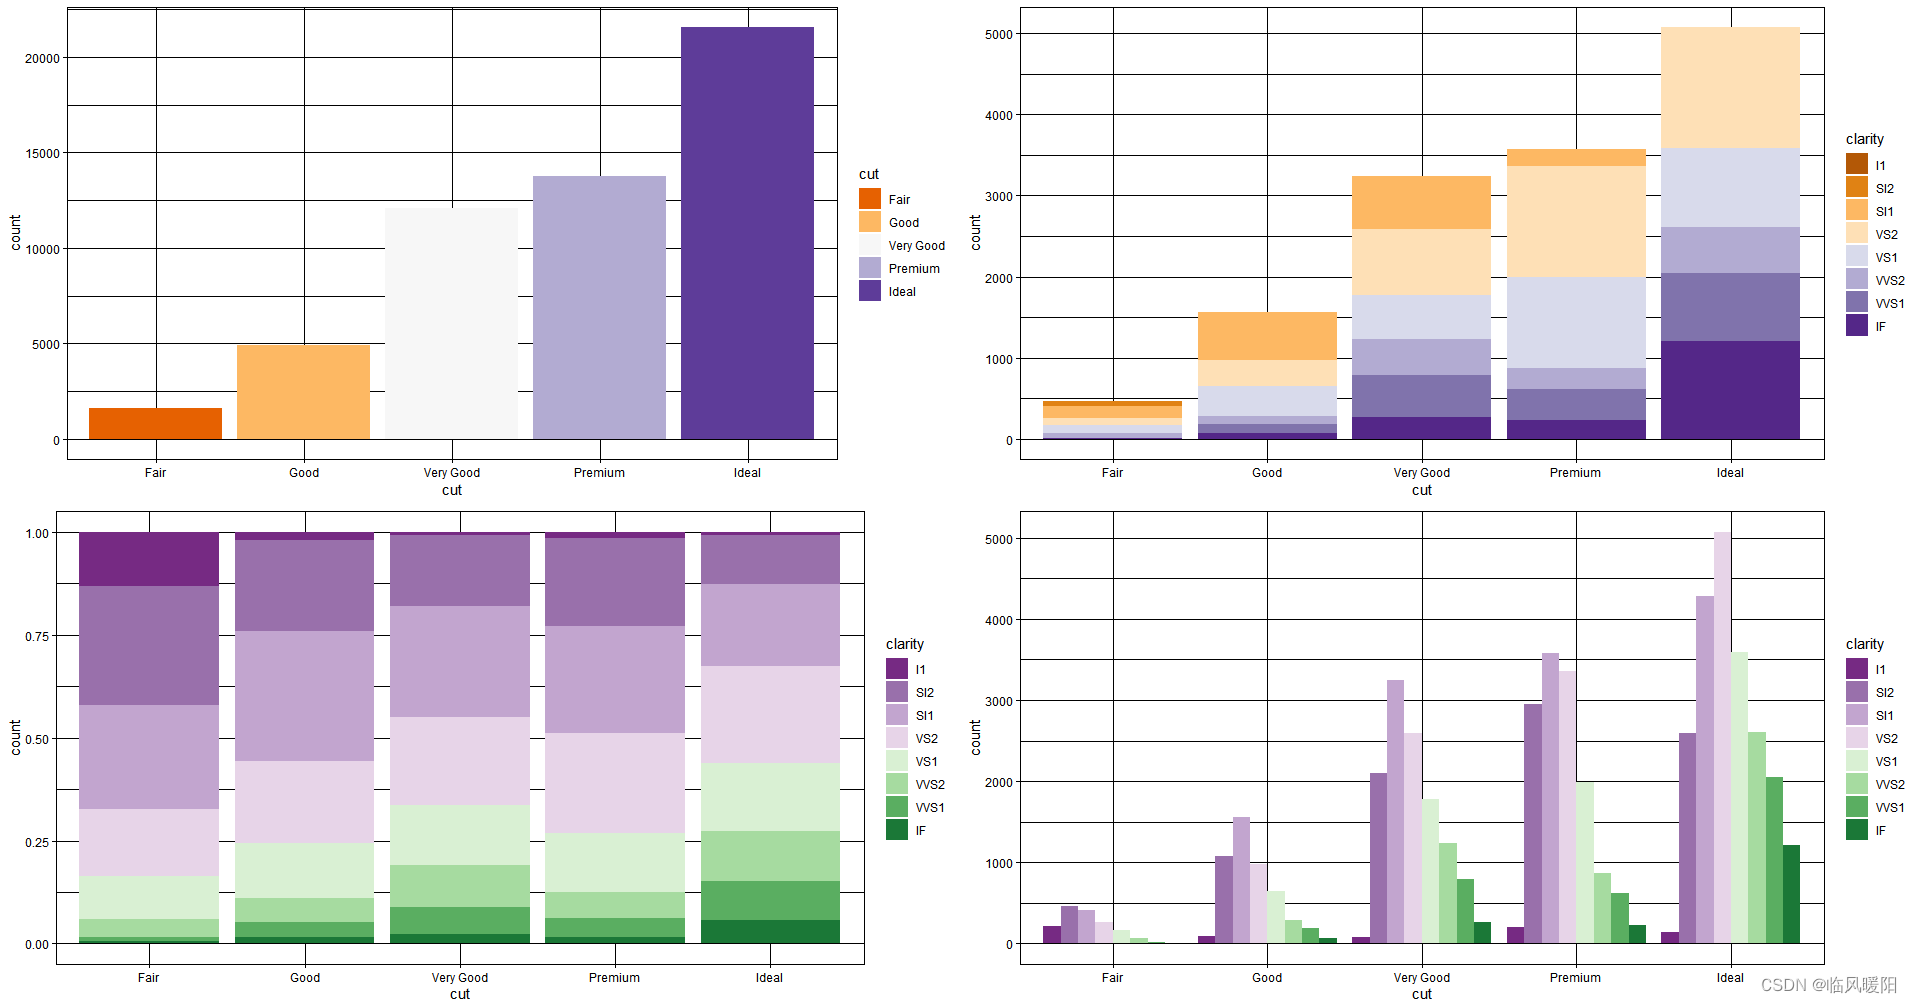
scale_fill_brewer(palette = "Purples")
# 分类直方图
p4 <- ggplot(data = diamonds) +
geom_bar(mapping = aes(x = cut, fill = clarity), position = "dodge") +
theme_linedraw() +
scale_fill_brewer(palette = "Purples")
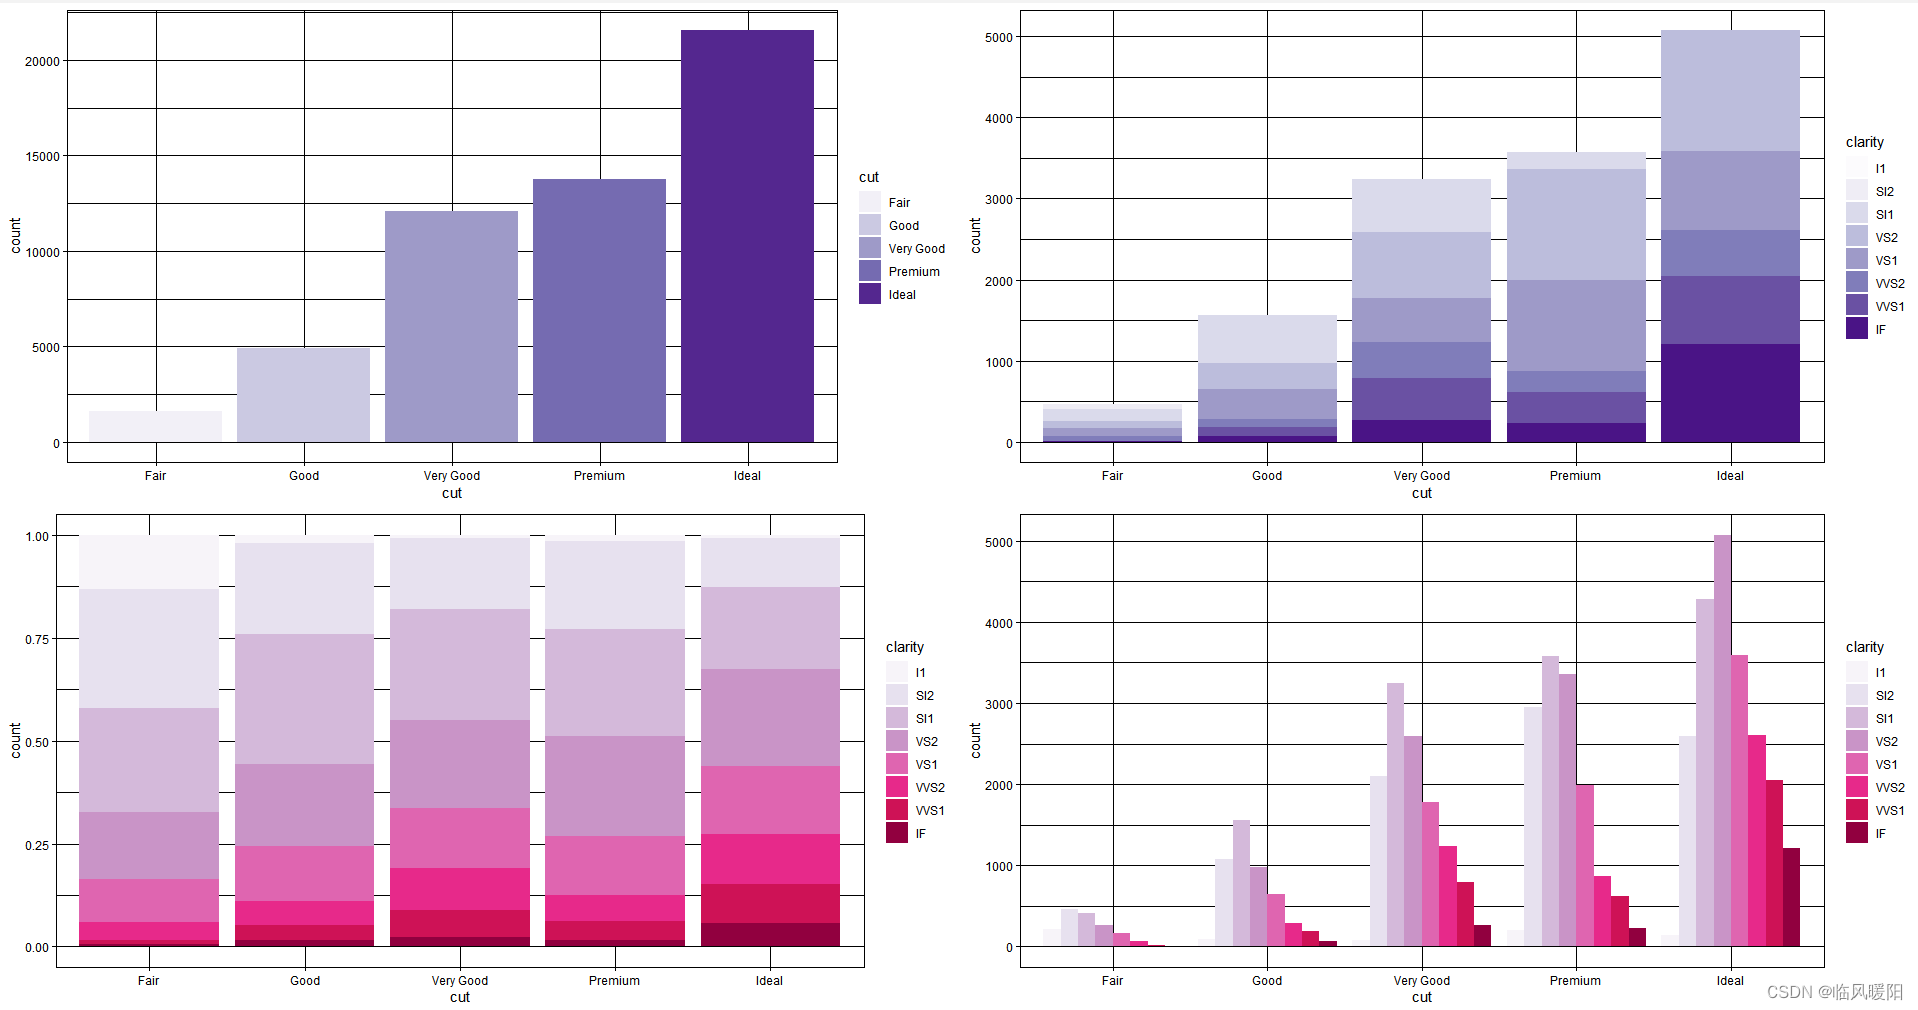
# 普通的直方图
p1 <- ggplot(data = diamonds) +
  geom_bar(mapping = aes(x = cut, fill = cut)) +
  theme_linedraw() +
  scale_fill_brewer(palette = "Purples")

# 堆积直方图
p2 <- ggplot(data = diamonds) +
  geom_bar(mapping = aes(x = cut, fill = clarity), position = "identity") +
  theme_linedraw() +
  scale_fill_brewer(palette = "Purples")

# 累积直方图
p3 <- ggplot(data = diamonds) +
  geom_bar(mapping = aes(x = cut, fill = clarity), position = "fill") +
  theme_linedraw() +
  scale_fill_brewer(palette = "PuRd")

# 分类直方图
p4 <- ggplot(data = diamonds) +
  geom_bar(mapping = aes(x = cut, fill = clarity), position = "dodge") +
  theme_linedraw() +
  scale_fill_brewer(palette = "PuRd")
# 普通的直方图
p1 <- ggplot(data = diamonds) +
  geom_bar(mapping = aes(x = cut, fill = cut)) +
  theme_linedraw() +
  scale_fill_brewer(palette = "PuRd")

# 堆积直方图
p2 <- ggplot(data = diamonds) +
  geom_bar(mapping = aes(x = cut, fill = clarity), position = "identity") +
  theme_linedraw() +
  scale_fill_brewer(palette = "PuRd")

# 累积直方图
p3 <- ggplot(data = diamonds) +
  geom_bar(mapping = aes(x = cut, fill = clarity), position = "fill") +
  theme_linedraw() +
  scale_fill_brewer(palette = "PuBuGn")

# 分类直方图
p4 <- ggplot(data = diamonds) +
  geom_bar(mapping = aes(x = cut, fill = clarity), position = "dodge") +
  theme_linedraw() +
  scale_fill_brewer(palette = "PuBuGn")
# 普通的直方图
p1 <- ggplot(data = diamonds) +
  geom_bar(mapping = aes(x = cut, fill = cut)) +
  theme_linedraw() +
  scale_fill_brewer(palette = "PuBuGn")

# 堆积直方图
p2 <- ggplot(data = diamonds) +
  geom_bar(mapping = aes(x = cut, fill = clarity), position = "identity") +
  theme_linedraw() +
  scale_fill_brewer(palette = "PuBuGn")

# 累积直方图
p3 <- ggplot(data = diamonds) +
  geom_bar(mapping = aes(x = cut, fill = clarity), position = "fill") +
  theme_linedraw() +
  scale_fill_brewer(palette = "PuBu")

# 分类直方图
p4 <- ggplot(data = diamonds) +
  geom_bar(mapping = aes(x = cut, fill = clarity), position = "dodge") +
  theme_linedraw() +
  scale_fill_brewer(palette = "PuBu")
# 普通的直方图
p1 <- ggplot(data = diamonds) +
  geom_bar(mapping = aes(x = cut, fill = cut)) +
  theme_linedraw() +
  scale_fill_brewer(palette = "OrRd")

# 堆积直方图
p2 <- ggplot(data = diamonds) +
  geom_bar(mapping = aes(x = cut, fill = clarity), position = "identity") +
  theme_linedraw() +
  scale_fill_brewer(palette = "OrRd")

# 累积直方图
p3 <- ggplot(data = diamonds) +
  geom_bar(mapping = aes(x = cut, fill = clarity), position = "fill") +
  theme_linedraw() +
  scale_fill_brewer(palette = "PuBuGn")

# 分类直方图
p4 <- ggplot(data = diamonds) +
  geom_bar(mapping = aes(x = cut, fill = clarity), position = "dodge") +
  theme_linedraw() +
  scale_fill_brewer(palette = "PuBuGn")
# 普通的直方图
p1 <- ggplot(data = diamonds) +
  geom_bar(mapping = aes(x = cut, fill = cut)) +
  theme_linedraw() +
  scale_fill_brewer(palette = "PuBuGn")

# 堆积直方图
p2 <- ggplot(data = diamonds) +
  geom_bar(mapping = aes(x = cut, fill = clarity), position = "identity") +
  theme_linedraw() +
  scale_fill_brewer(palette = "PuBuGn")

# 累积直方图
p3 <- ggplot(data = diamonds) +
  geom_bar(mapping = aes(x = cut, fill = clarity), position = "fill") +
  theme_linedraw() +
  scale_fill_brewer(palette = "PuBu")

# 分类直方图
p4 <- ggplot(data = diamonds) +
  geom_bar(mapping = aes(x = cut, fill = clarity), position = "dodge") +
  theme_linedraw() +
  scale_fill_brewer(palette = "PuBu")

# 普通的直方图
p1 <- ggplot(data = diamonds) +
geom_bar(mapping = aes(x = cut, fill = cut)) +
theme_linedraw() +
scale_fill_brewer(palette = "PuBuGn")
# 堆积直方图
p2 <- ggplot(data = diamonds) +
geom_bar(mapping = aes(x = cut, fill = clarity), position = "identity") +
theme_linedraw() +
scale_fill_brewer(palette = "PuBuGn")
# 累积直方图
p3 <- ggplot(data = diamonds) +
geom_bar(mapping = aes(x = cut, fill = clarity), position = "fill") +
theme_linedraw() +
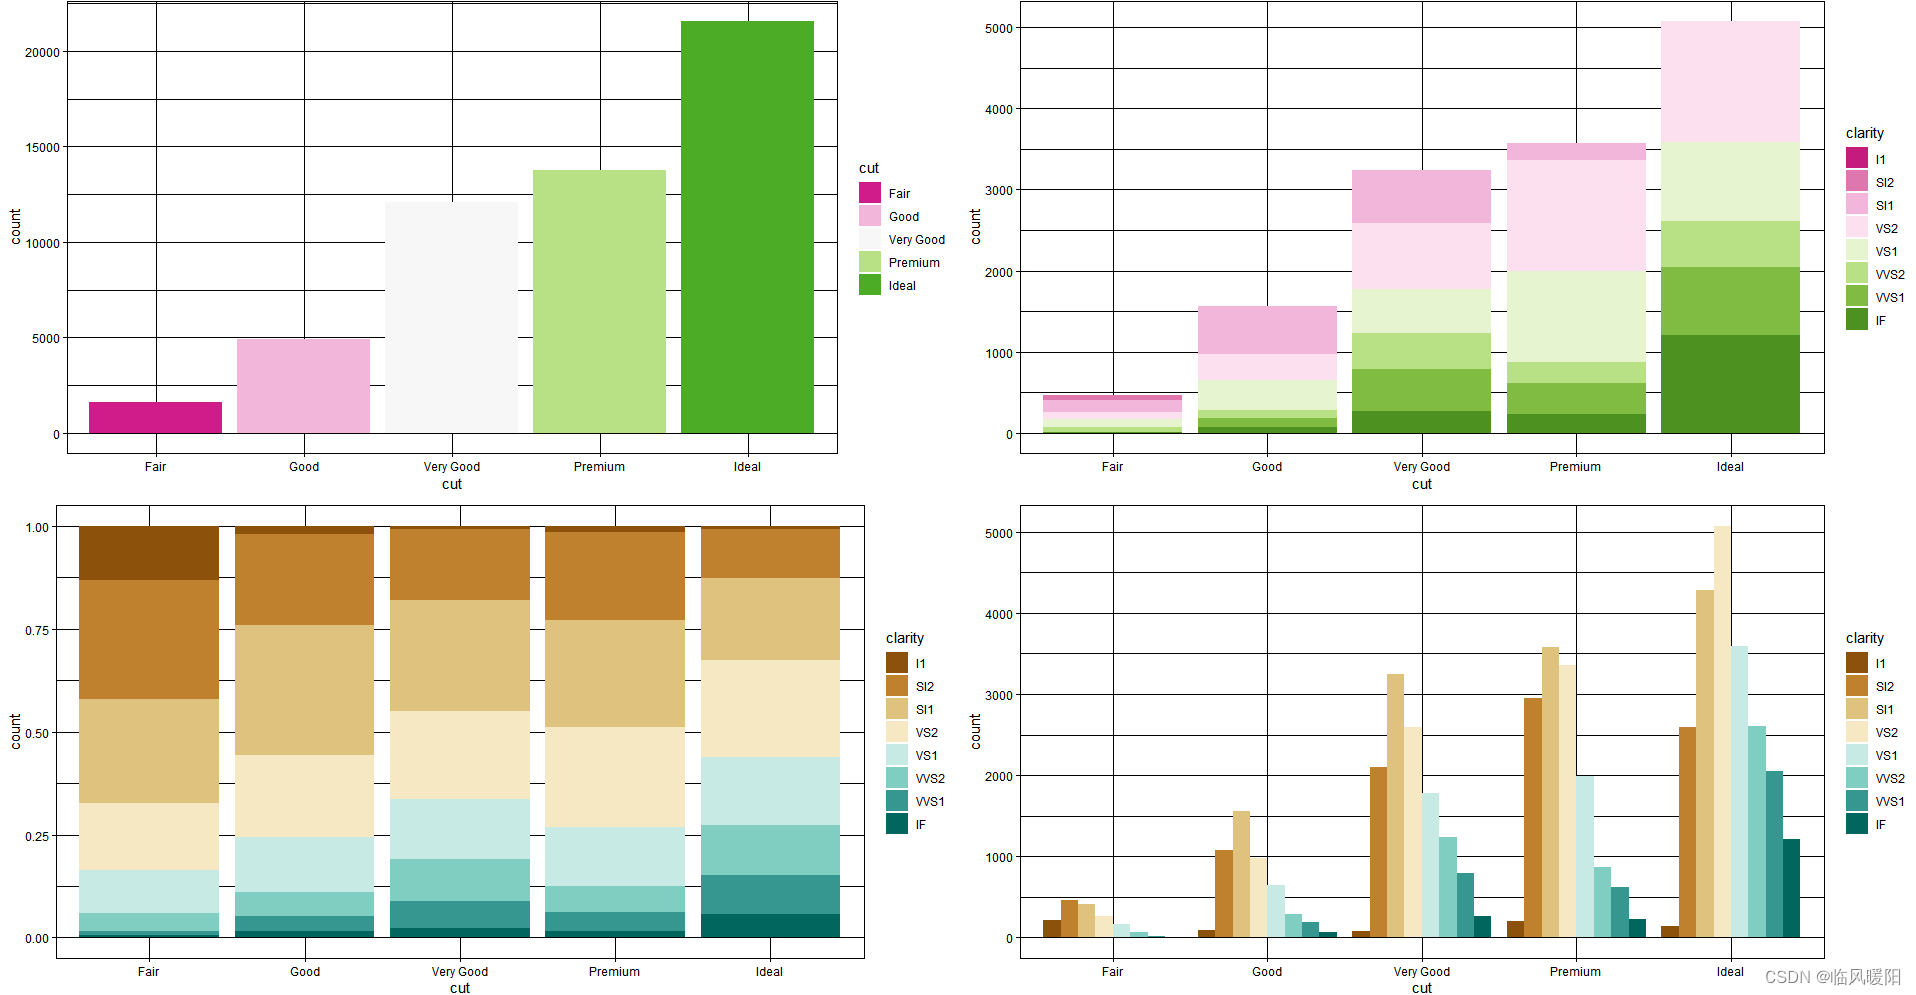
scale_fill_brewer(palette = "OrRd")
# 分类直方图
p4 <- ggplot(data = diamonds) +
geom_bar(mapping = aes(x = cut, fill = clarity), position = "dodge") +
theme_linedraw() +
scale_fill_brewer(palette = "OrRd")
# 普通的直方图
p1 <- ggplot(data = diamonds) +
geom_bar(mapping = aes(x = cut, fill = cut)) +
theme_linedraw() +
scale_fill_brewer(palette = "OrRd")
# 堆积直方图
p2 <- ggplot(data = diamonds) +
geom_bar(mapping = aes(x = cut, fill = clarity), position = "identity") +
theme_linedraw() +
scale_fill_brewer(palette = "OrRd")
# 累积直方图
p3 <- ggplot(data = diamonds) +
geom_bar(mapping = aes(x = cut, fill = clarity), position = "fill") +
theme_linedraw() +
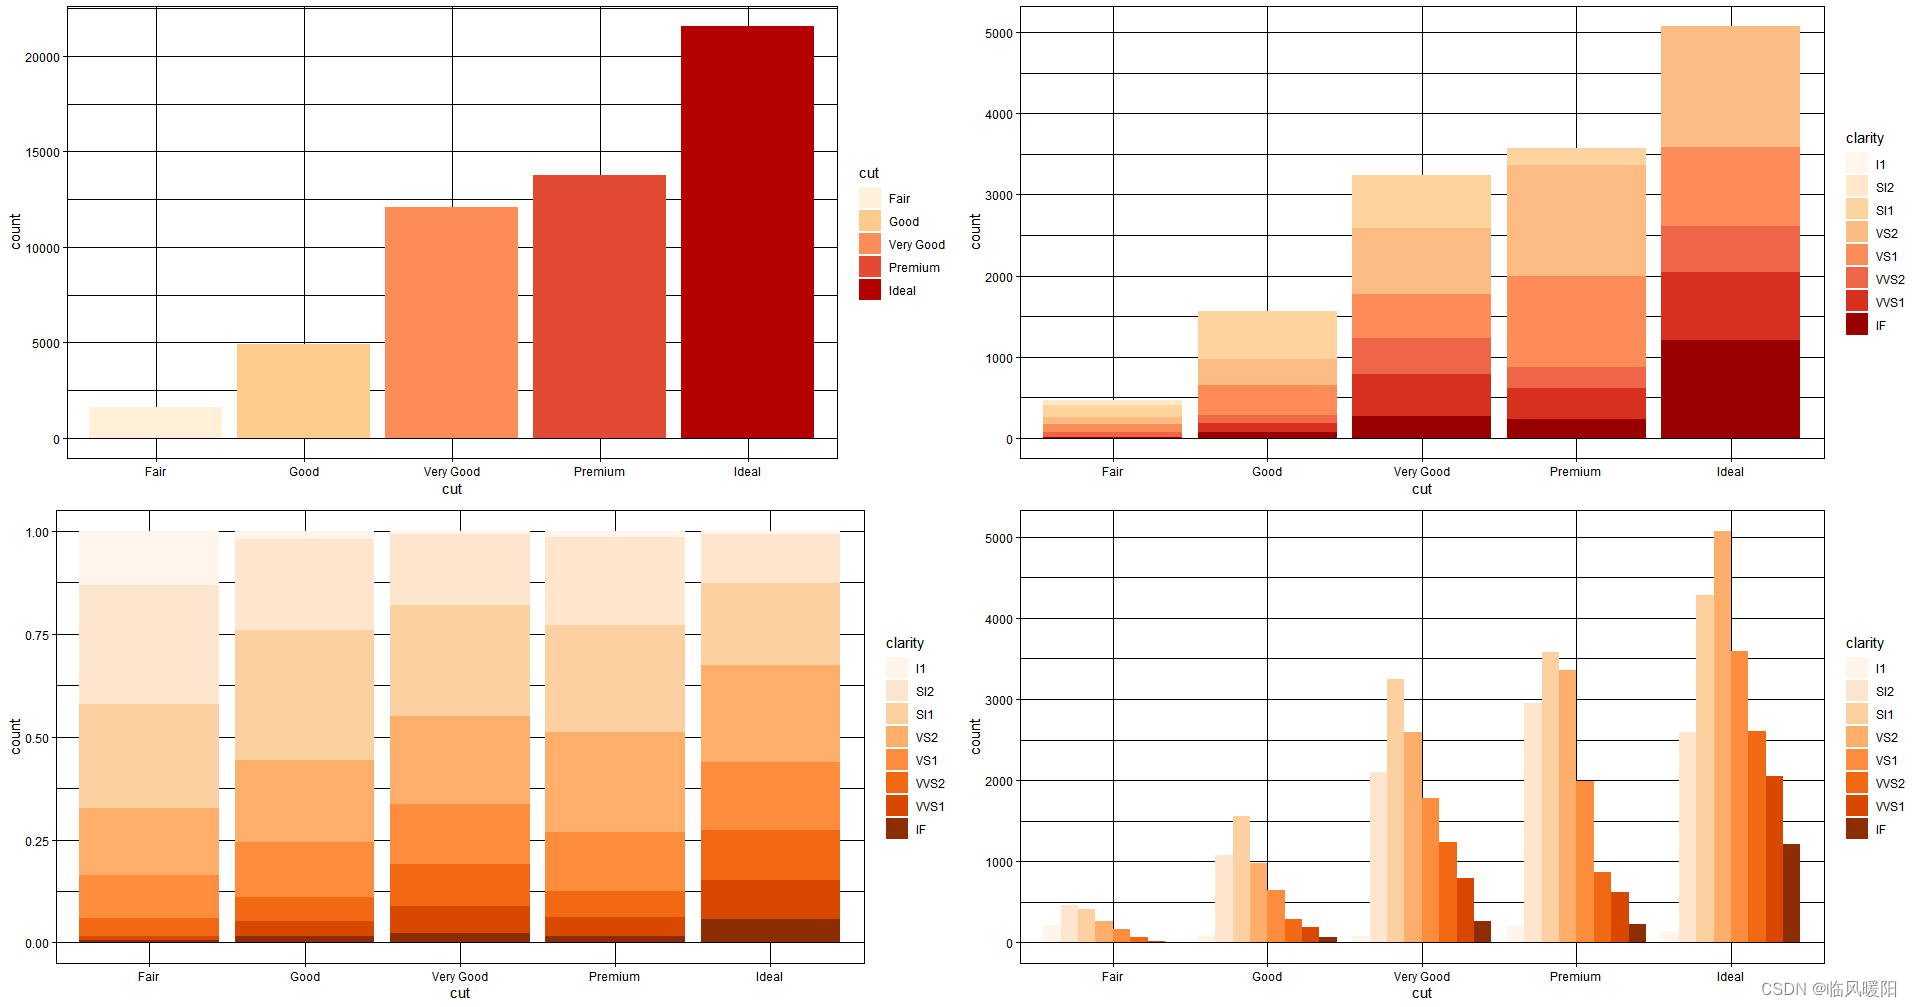
scale_fill_brewer(palette = "Oranges")
# 分类直方图
p4 <- ggplot(data = diamonds) +
geom_bar(mapping = aes(x = cut, fill = clarity), position = "dodge") +
theme_linedraw() +
scale_fill_brewer(palette = "Oranges")
# 普通的直方图
p1 <- ggplot(data = diamonds) +
geom_bar(mapping = aes(x = cut, fill = cut)) +
theme_linedraw() +
scale_fill_brewer(palette = "Oranges")
# 堆积直方图
p2 <- ggplot(data = diamonds) +
geom_bar(mapping = aes(x = cut, fill = clarity), position = "identity") +
theme_linedraw() +
scale_fill_brewer(palette = "Oranges")
# 累积直方图
p3 <- ggplot(data = diamonds) +
geom_bar(mapping = aes(x = cut, fill = clarity), position = "fill") +
theme_linedraw() +
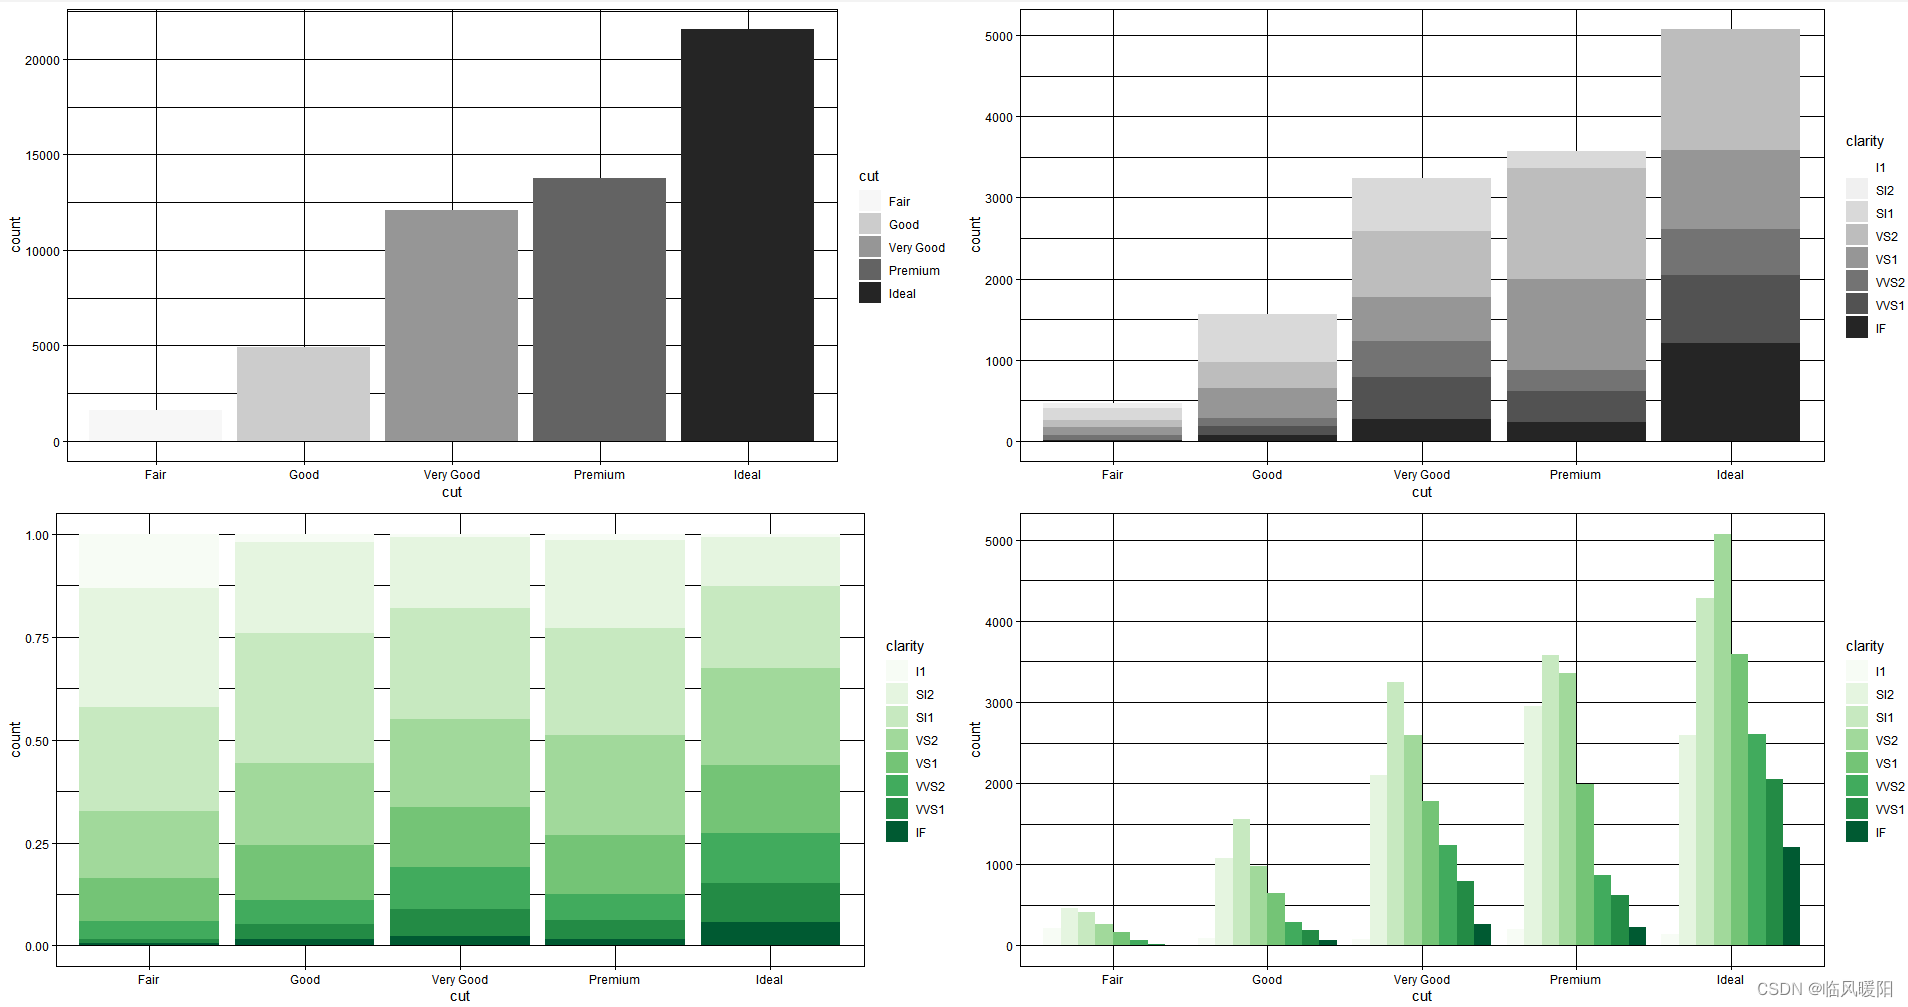
scale_fill_brewer(palette = "Greys")
# 分类直方图
p4 <- ggplot(data = diamonds) +
geom_bar(mapping = aes(x = cut, fill = clarity), position = "dodge") +
theme_linedraw() +
scale_fill_brewer(palette = "Greys")
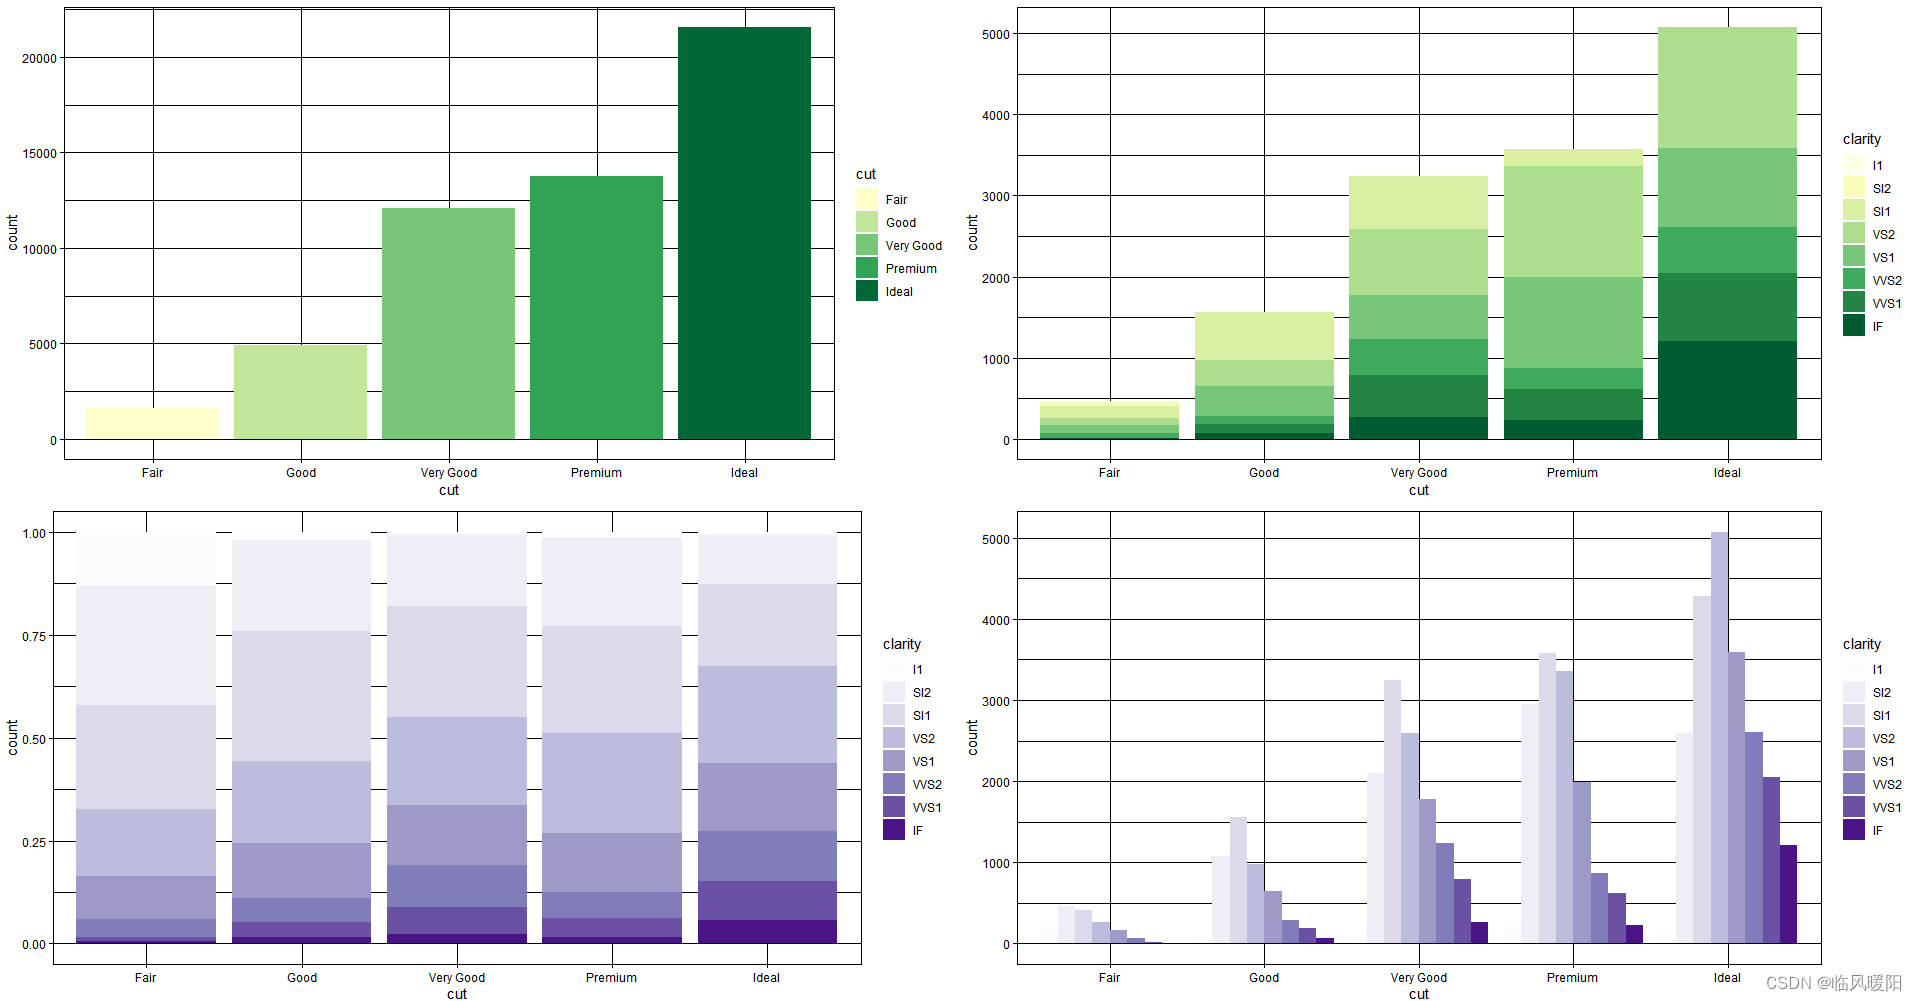
# 普通的直方图
p1 <- ggplot(data = diamonds) +
geom_bar(mapping = aes(x = cut, fill = cut)) +
theme_linedraw() +
scale_fill_brewer(palette = "Greys")
# 堆积直方图
p2 <- ggplot(data = diamonds) +
geom_bar(mapping = aes(x = cut, fill = clarity), position = "identity") +
theme_linedraw() +
scale_fill_brewer(palette = "Greys")
# 累积直方图
p3 <- ggplot(data = diamonds) +
geom_bar(mapping = aes(x = cut, fill = clarity), position = "fill") +
theme_linedraw() +
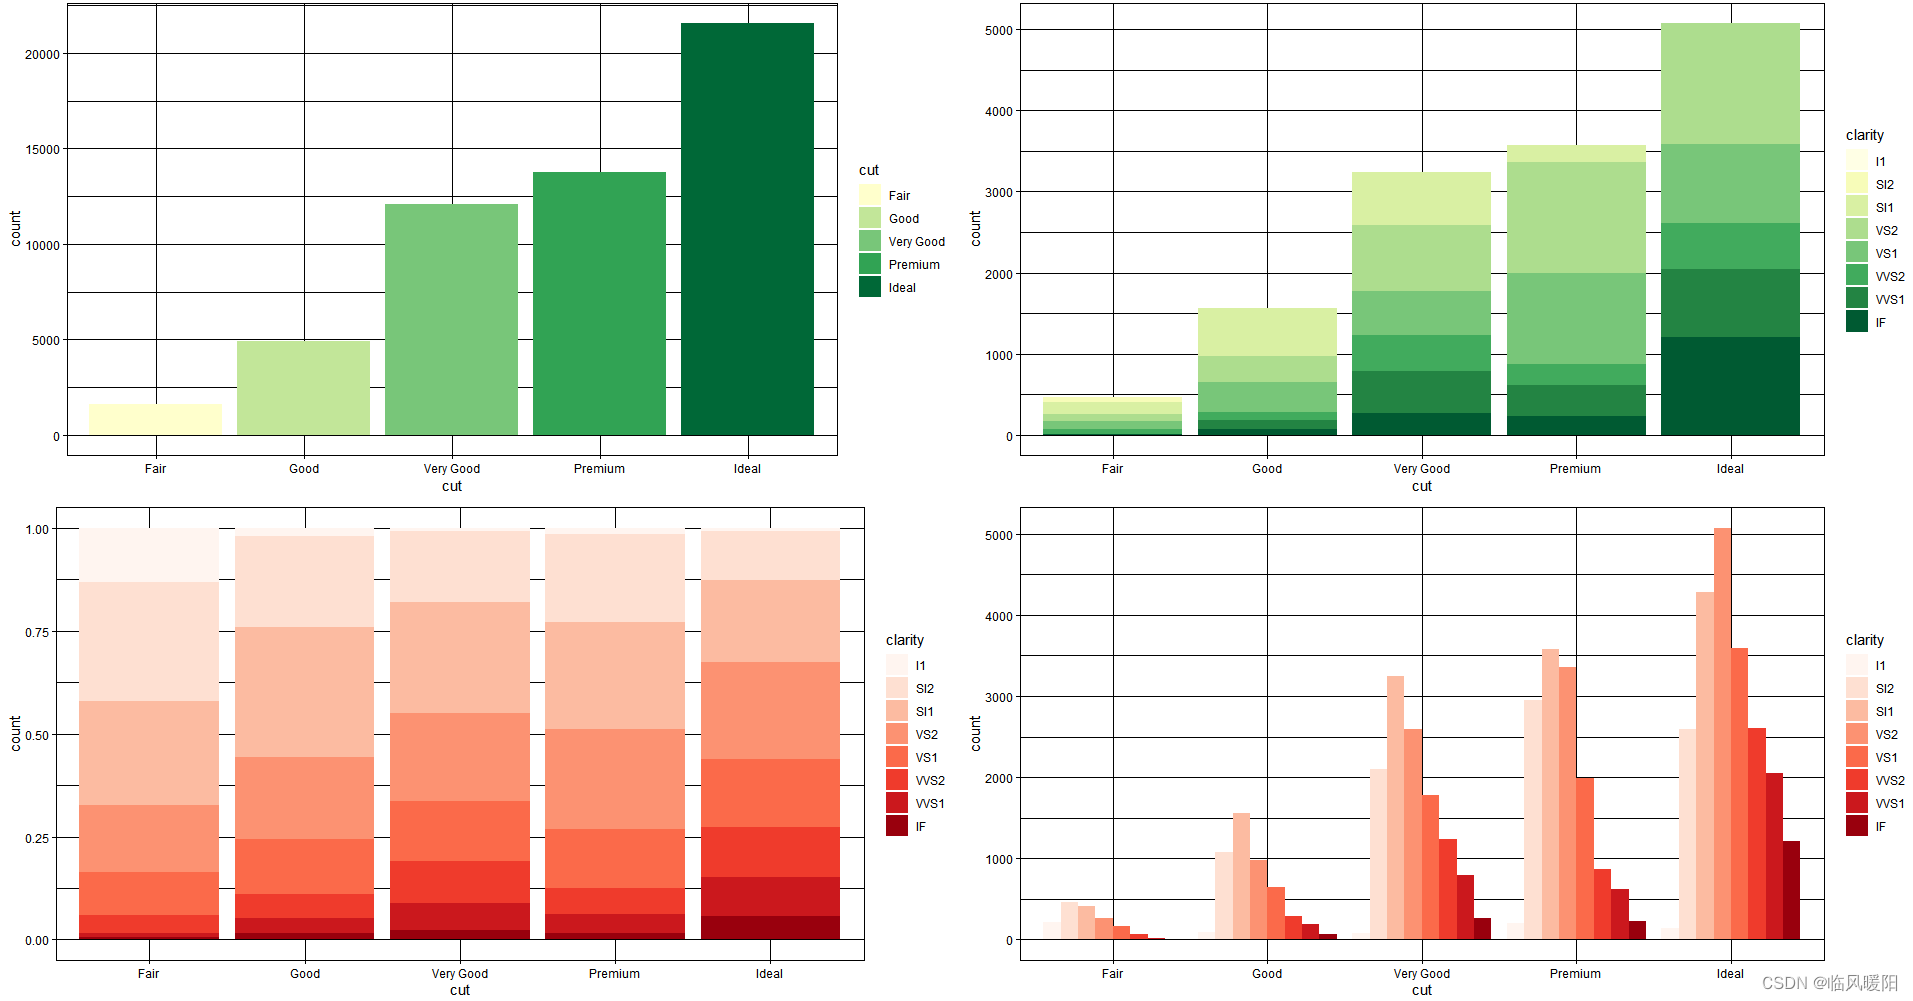
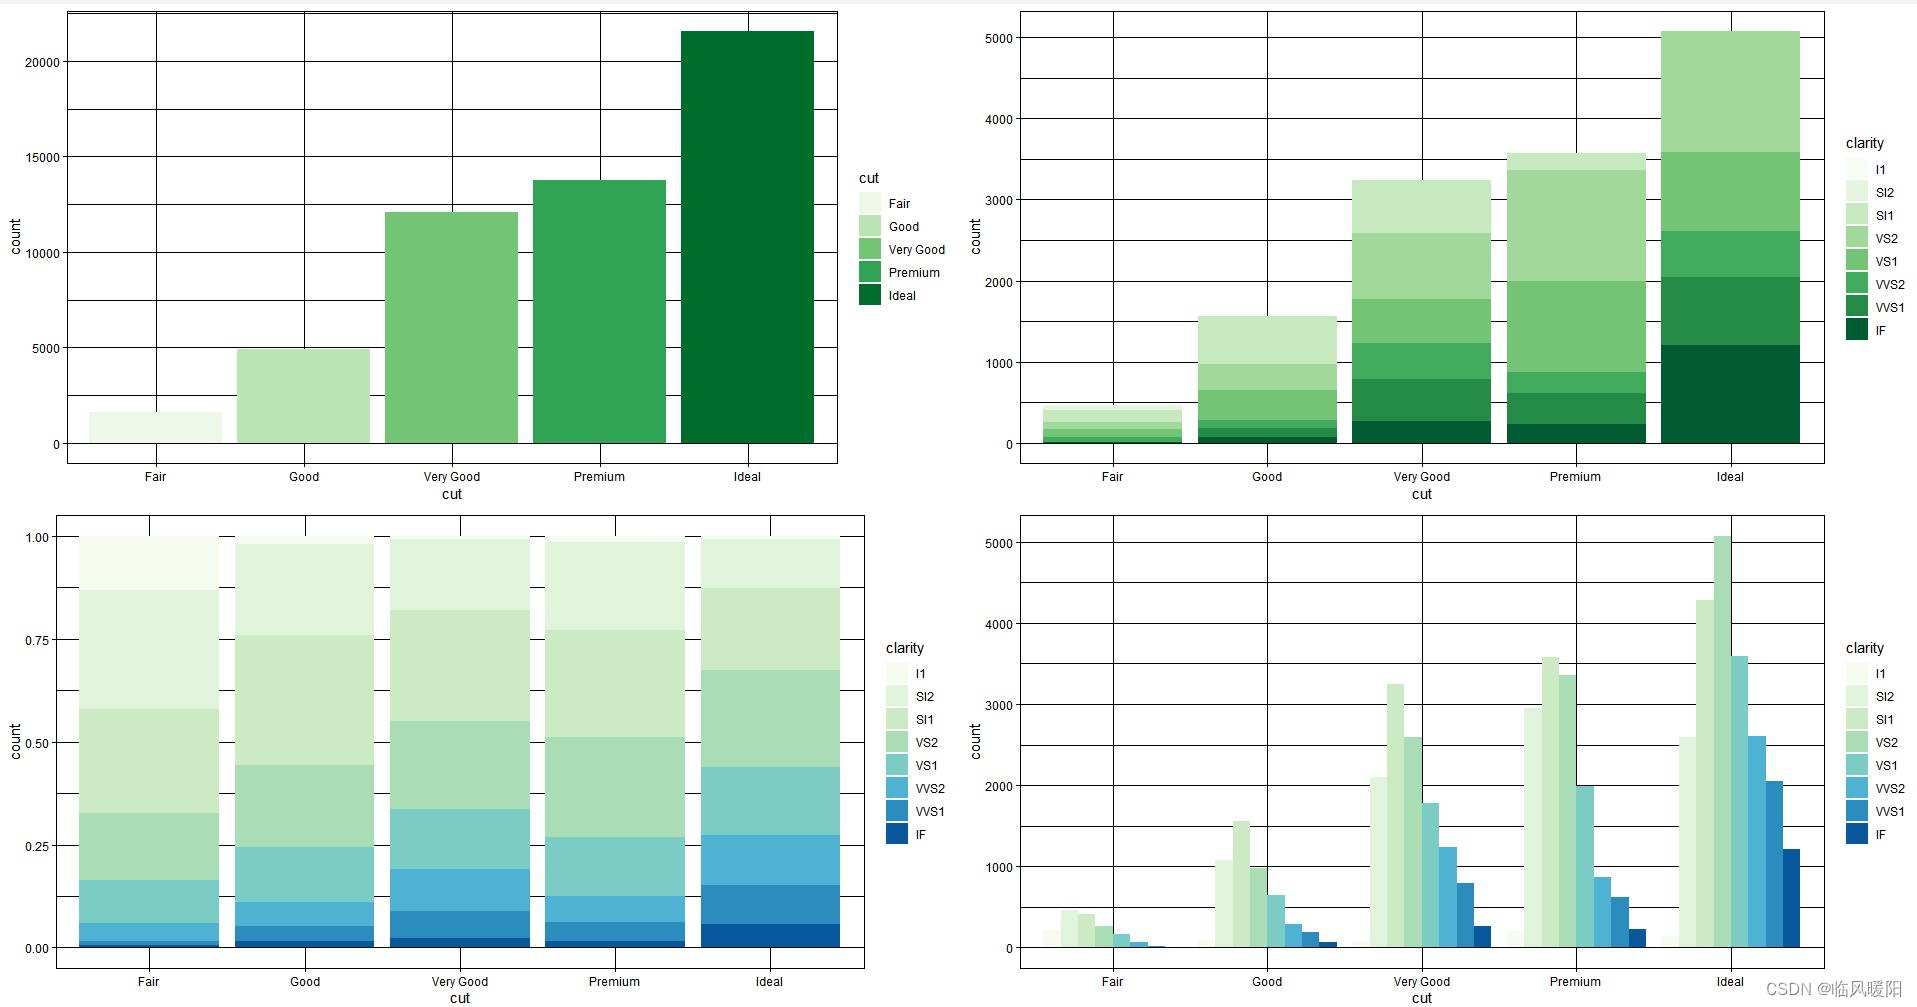
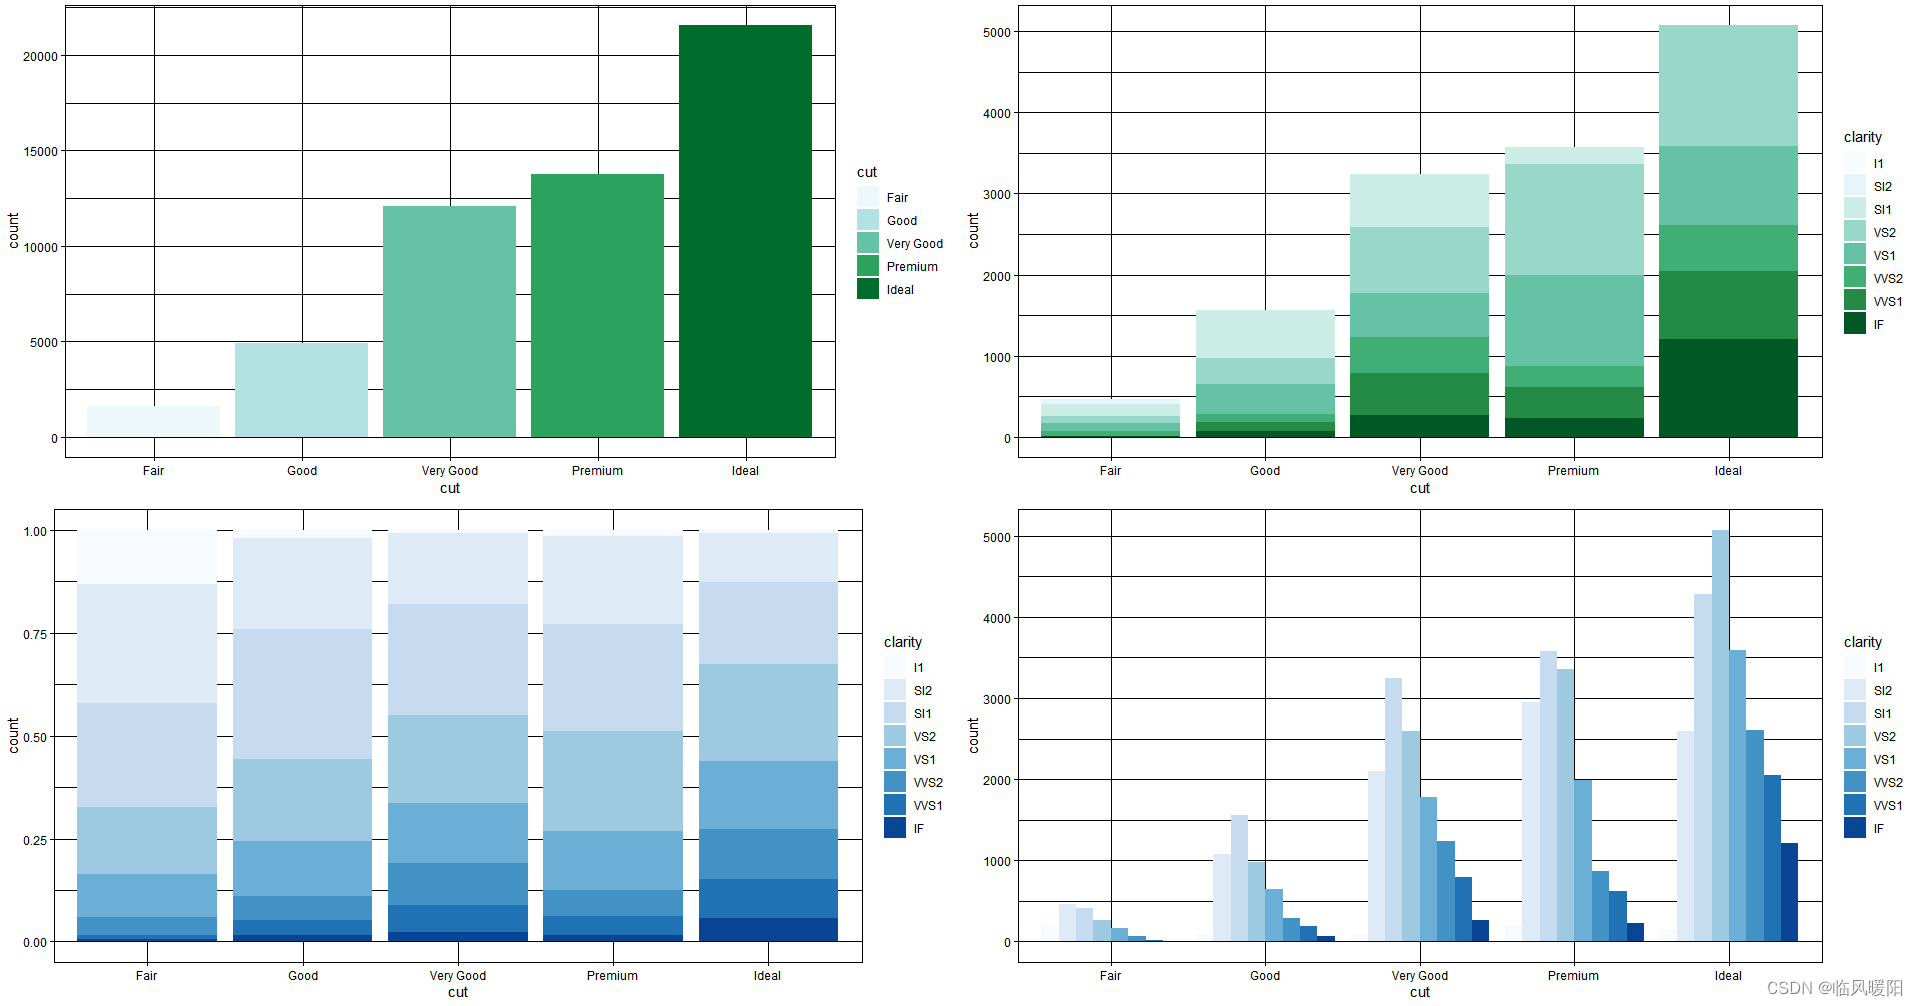
scale_fill_brewer(palette = "Greens")
# 分类直方图
p4 <- ggplot(data = diamonds) +
geom_bar(mapping = aes(x = cut, fill = clarity), position = "dodge") +
theme_linedraw() +
scale_fill_brewer(palette = "Greens")
# 普通的直方图
p1 <- ggplot(data = diamonds) +
  geom_bar(mapping = aes(x = cut, fill = cut)) +
  theme_linedraw() +
  scale_fill_brewer(palette = "Greens")

# 堆积直方图
p2 <- ggplot(data = diamonds) +
  geom_bar(mapping = aes(x = cut, fill = clarity), position = "identity") +
  theme_linedraw() +
  scale_fill_brewer(palette = "Greens")

# 累积直方图
p3 <- ggplot(data = diamonds) +
  geom_bar(mapping = aes(x = cut, fill = clarity), position = "fill") +
  theme_linedraw() +
  scale_fill_brewer(palette = "GnBu")

# 分类直方图
p4 <- ggplot(data = diamonds) +
  geom_bar(mapping = aes(x = cut, fill = clarity), position = "dodge") +
  theme_linedraw() +
  scale_fill_brewer(palette = "GnBu")
# 普通的直方图
p1 <- ggplot(data = diamonds) +
  geom_bar(mapping = aes(x = cut, fill = cut)) +
  theme_linedraw() +
  scale_fill_brewer(palette = "GnBu")

# 堆积直方图
p2 <- ggplot(data = diamonds) +
  geom_bar(mapping = aes(x = cut, fill = clarity), position = "identity") +
  theme_linedraw() +
  scale_fill_brewer(palette = "GnBu")

# 累积直方图
p3 <- ggplot(data = diamonds) +
  geom_bar(mapping = aes(x = cut, fill = clarity), position = "fill") +
  theme_linedraw() +
  scale_fill_brewer(palette = "BuPu")

# 分类直方图
p4 <- ggplot(data = diamonds) +
  geom_bar(mapping = aes(x = cut, fill = clarity), position = "dodge") +
  theme_linedraw() +
  scale_fill_brewer(palette = "BuPu")
# 普通的直方图
p1 <- ggplot(data = diamonds) +
  geom_bar(mapping = aes(x = cut, fill = cut)) +
  theme_linedraw() +
  scale_fill_brewer(palette = "BuPu")

# 堆积直方图
p2 <- ggplot(data = diamonds) +
  geom_bar(mapping = aes(x = cut, fill = clarity), position = "identity") +
  theme_linedraw() +
  scale_fill_brewer(palette = "BuPu")

# 累积直方图
p3 <- ggplot(data = diamonds) +
  geom_bar(mapping = aes(x = cut, fill = clarity), position = "fill") +
  theme_linedraw() +
  scale_fill_brewer(palette = "BuGn")

# 分类直方图
p4 <- ggplot(data = diamonds) +
  geom_bar(mapping = aes(x = cut, fill = clarity), position = "dodge") +
  theme_linedraw() +
  scale_fill_brewer(palette = "BuGn")

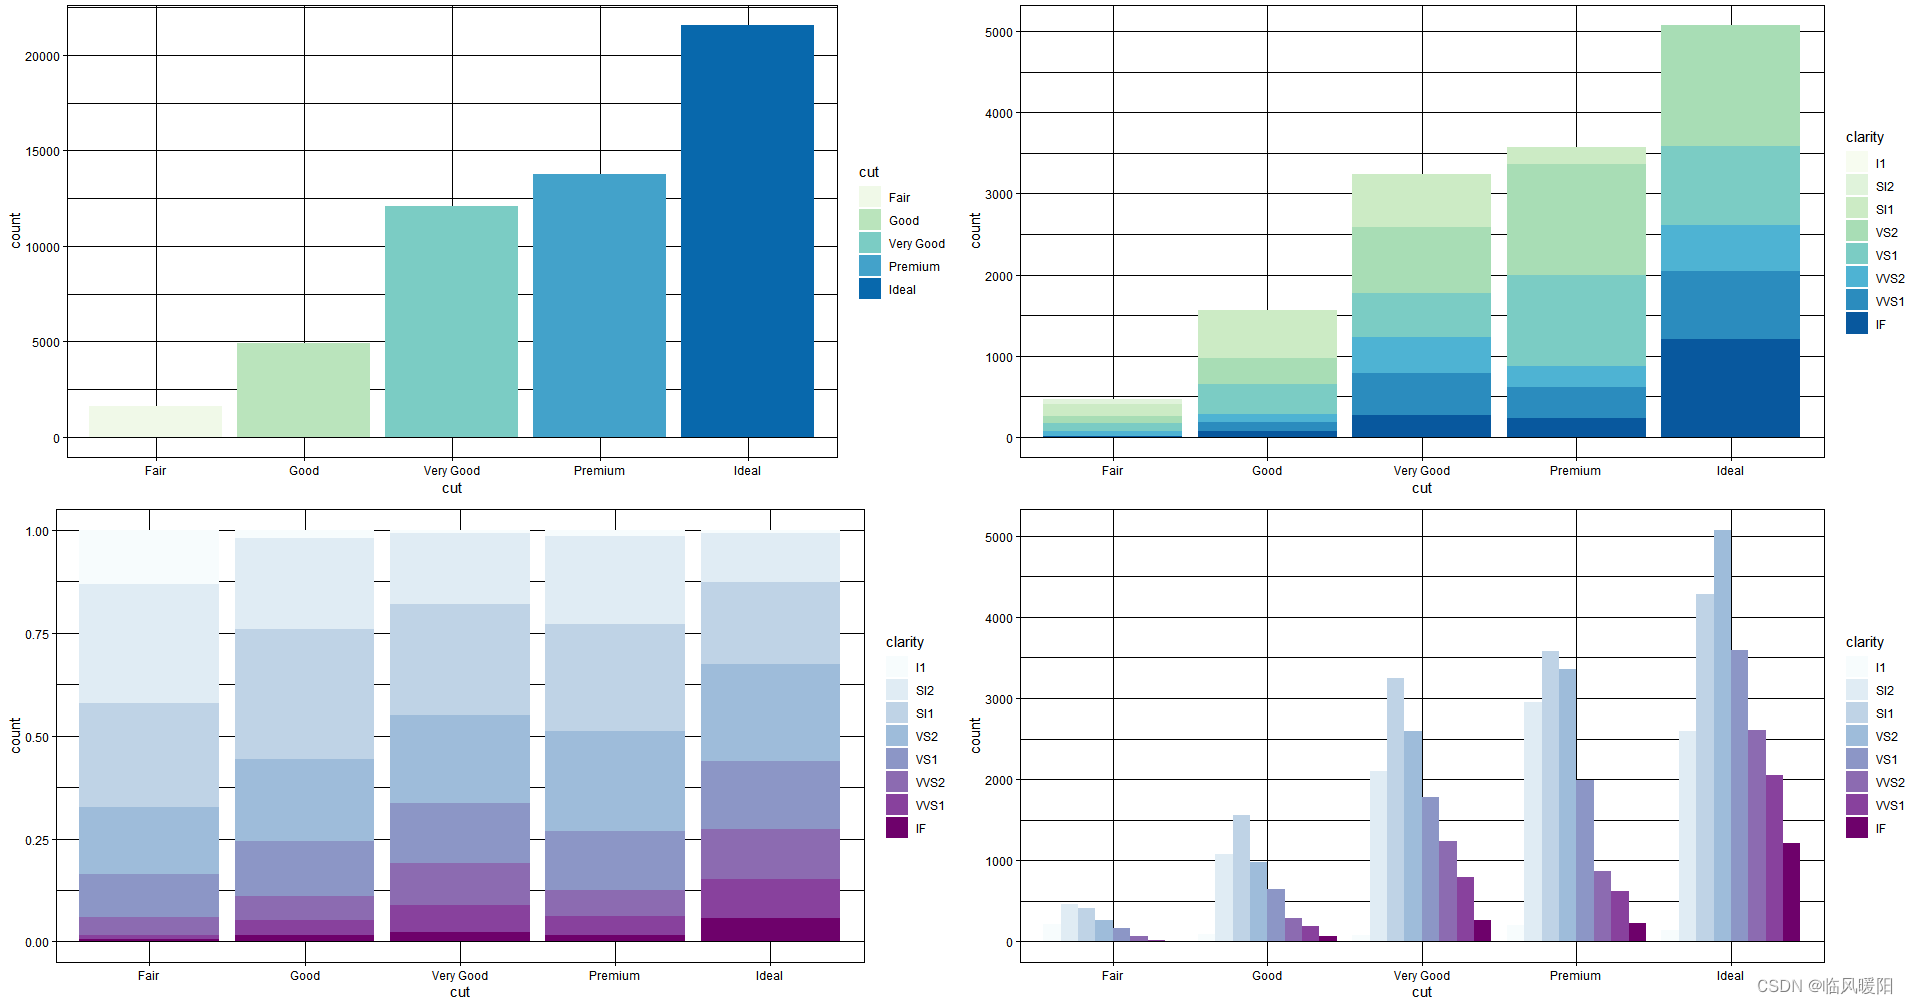
# 普通的直方图
p1 <- ggplot(data = diamonds) +
geom_bar(mapping = aes(x = cut, fill = cut)) +
theme_linedraw() +
scale_fill_brewer(palette = "BuGn")
# 堆积直方图
p2 <- ggplot(data = diamonds) +
geom_bar(mapping = aes(x = cut, fill = clarity), position = "identity") +
theme_linedraw() +
scale_fill_brewer(palette = "BuGn")
# 累积直方图
p3 <- ggplot(data = diamonds) +
geom_bar(mapping = aes(x = cut, fill = clarity), position = "fill") +
theme_linedraw() +
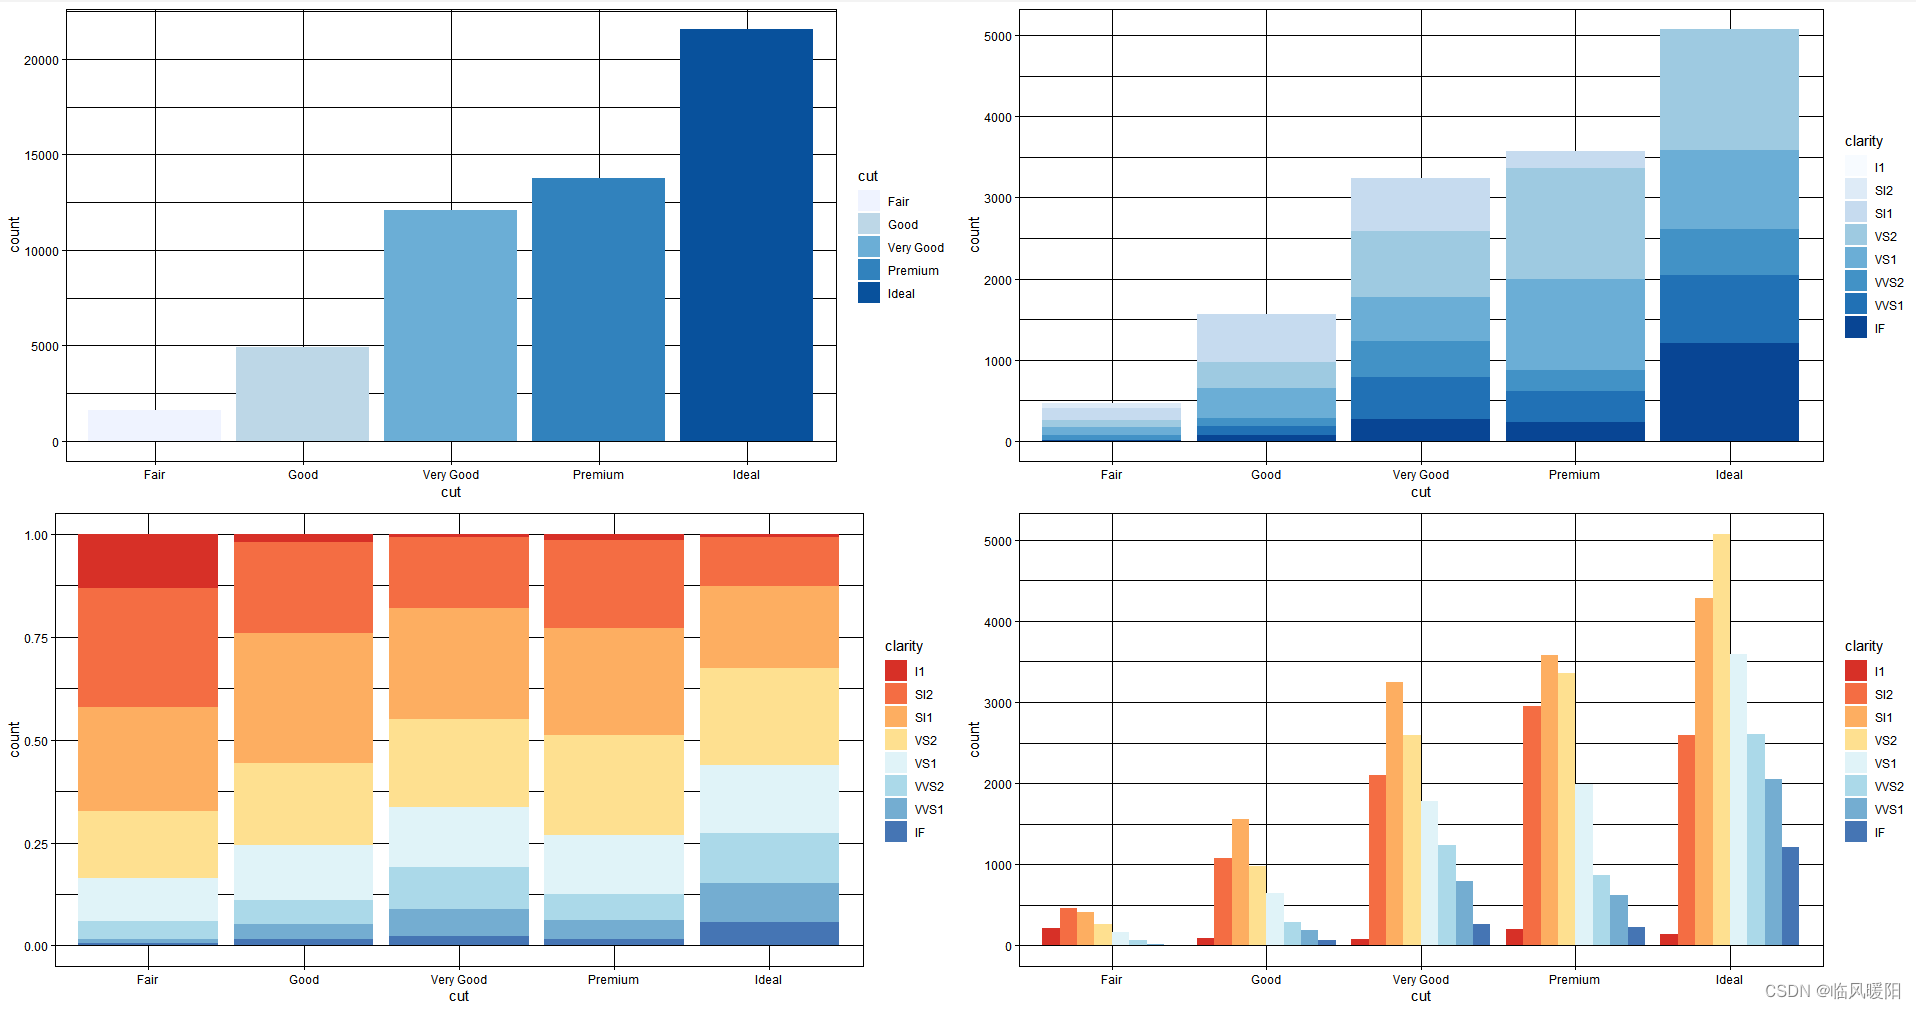
scale_fill_brewer(palette = "Blues")
# 分类直方图
p4 <- ggplot(data = diamonds) +
geom_bar(mapping = aes(x = cut, fill = clarity), position = "dodge") +
theme_linedraw() +
scale_fill_brewer(palette = "Blues")
# 普通的直方图
p1 <- ggplot(data = diamonds) +
geom_bar(mapping = aes(x = cut, fill = cut)) +
theme_linedraw() +
scale_fill_brewer(palette = "Blues")
# 堆积直方图
p2 <- ggplot(data = diamonds) +
geom_bar(mapping = aes(x = cut, fill = clarity), position = "identity") +
theme_linedraw() +
scale_fill_brewer(palette = "Blues")
# 累积直方图
p3 <- ggplot(data = diamonds) +
geom_bar(mapping = aes(x = cut, fill = clarity), position = "fill") +
theme_linedraw() +
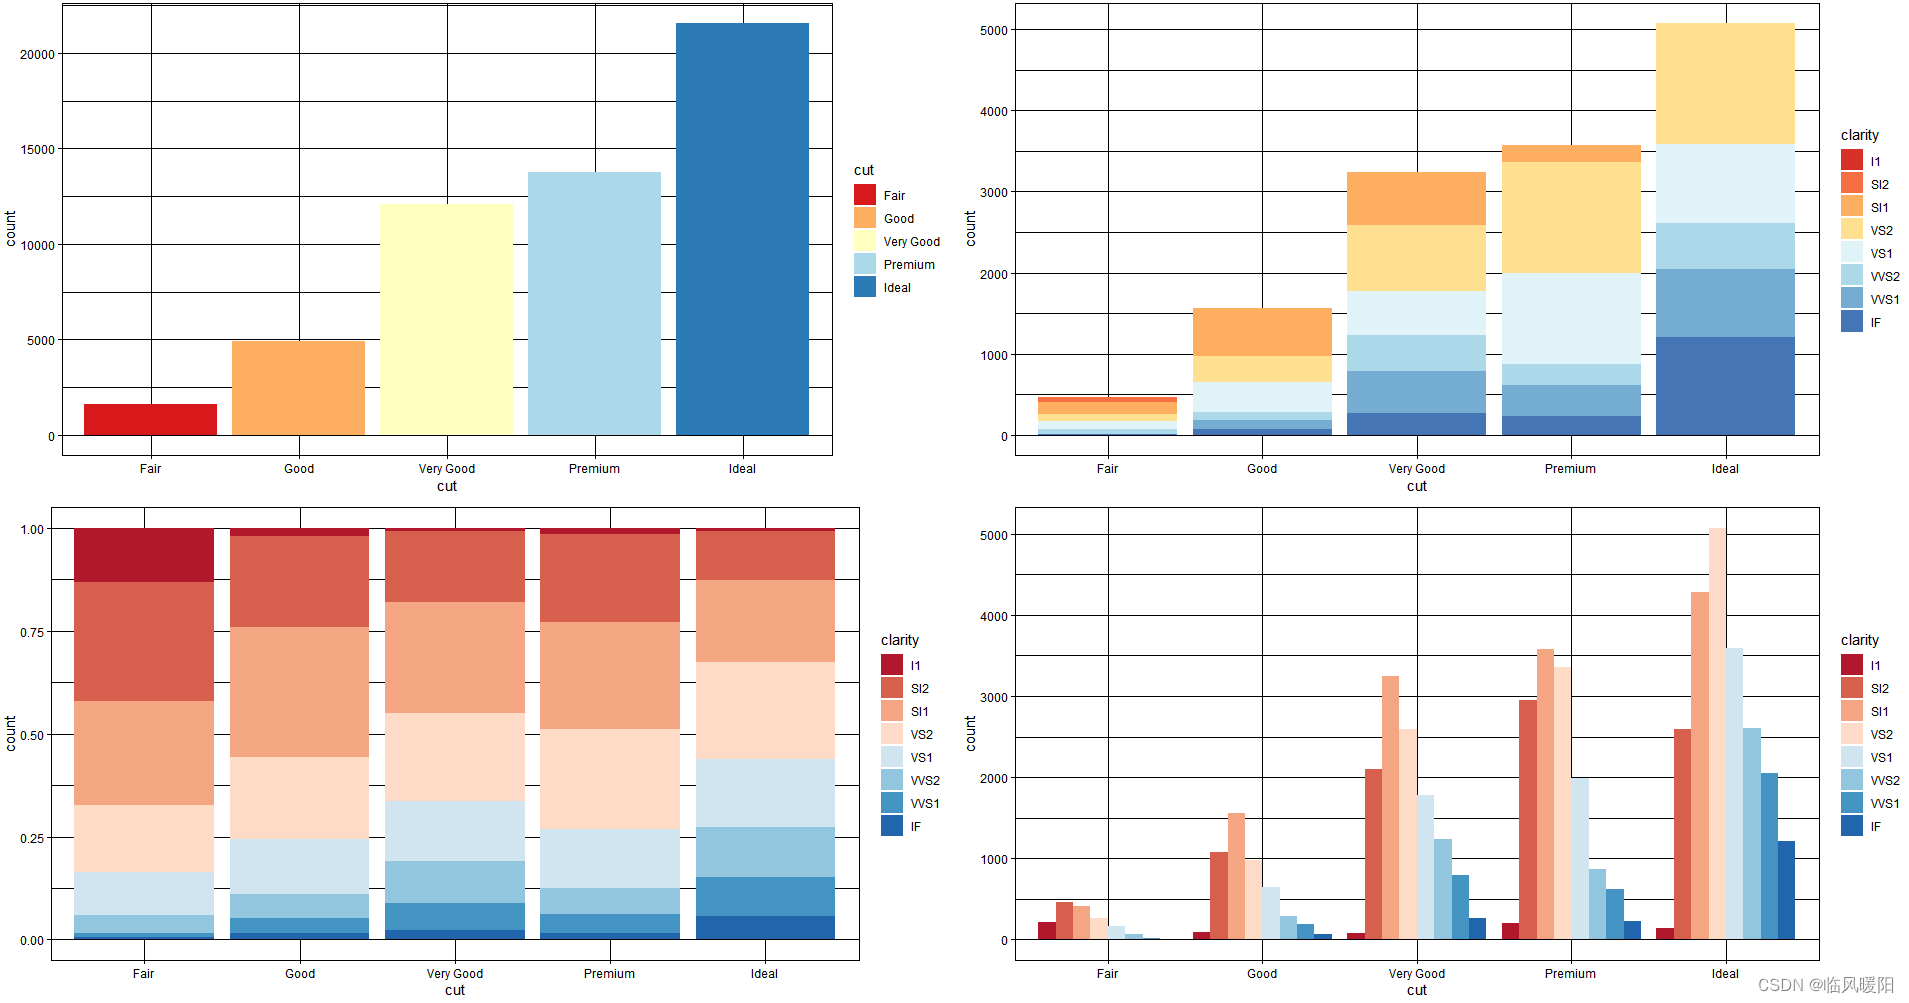
scale_fill_brewer(palette = "RdYlBu")
# 分类直方图
p4 <- ggplot(data = diamonds) +
geom_bar(mapping = aes(x = cut, fill = clarity), position = "dodge") +
theme_linedraw() +
scale_fill_brewer(palette = "RdYlBu")
# 普通的直方图
p1 <- ggplot(data = diamonds) +
geom_bar(mapping = aes(x = cut, fill = cut)) +
theme_linedraw() +
scale_fill_brewer(palette = "RdYlBu")
# 堆积直方图
p2 <- ggplot(data = diamonds) +
geom_bar(mapping = aes(x = cut, fill = clarity), position = "identity") +
theme_linedraw() +
scale_fill_brewer(palette = "RdYlBu")
# 累积直方图
p3 <- ggplot(data = diamonds) +
geom_bar(mapping = aes(x = cut, fill = clarity), position = "fill") +
theme_linedraw() +
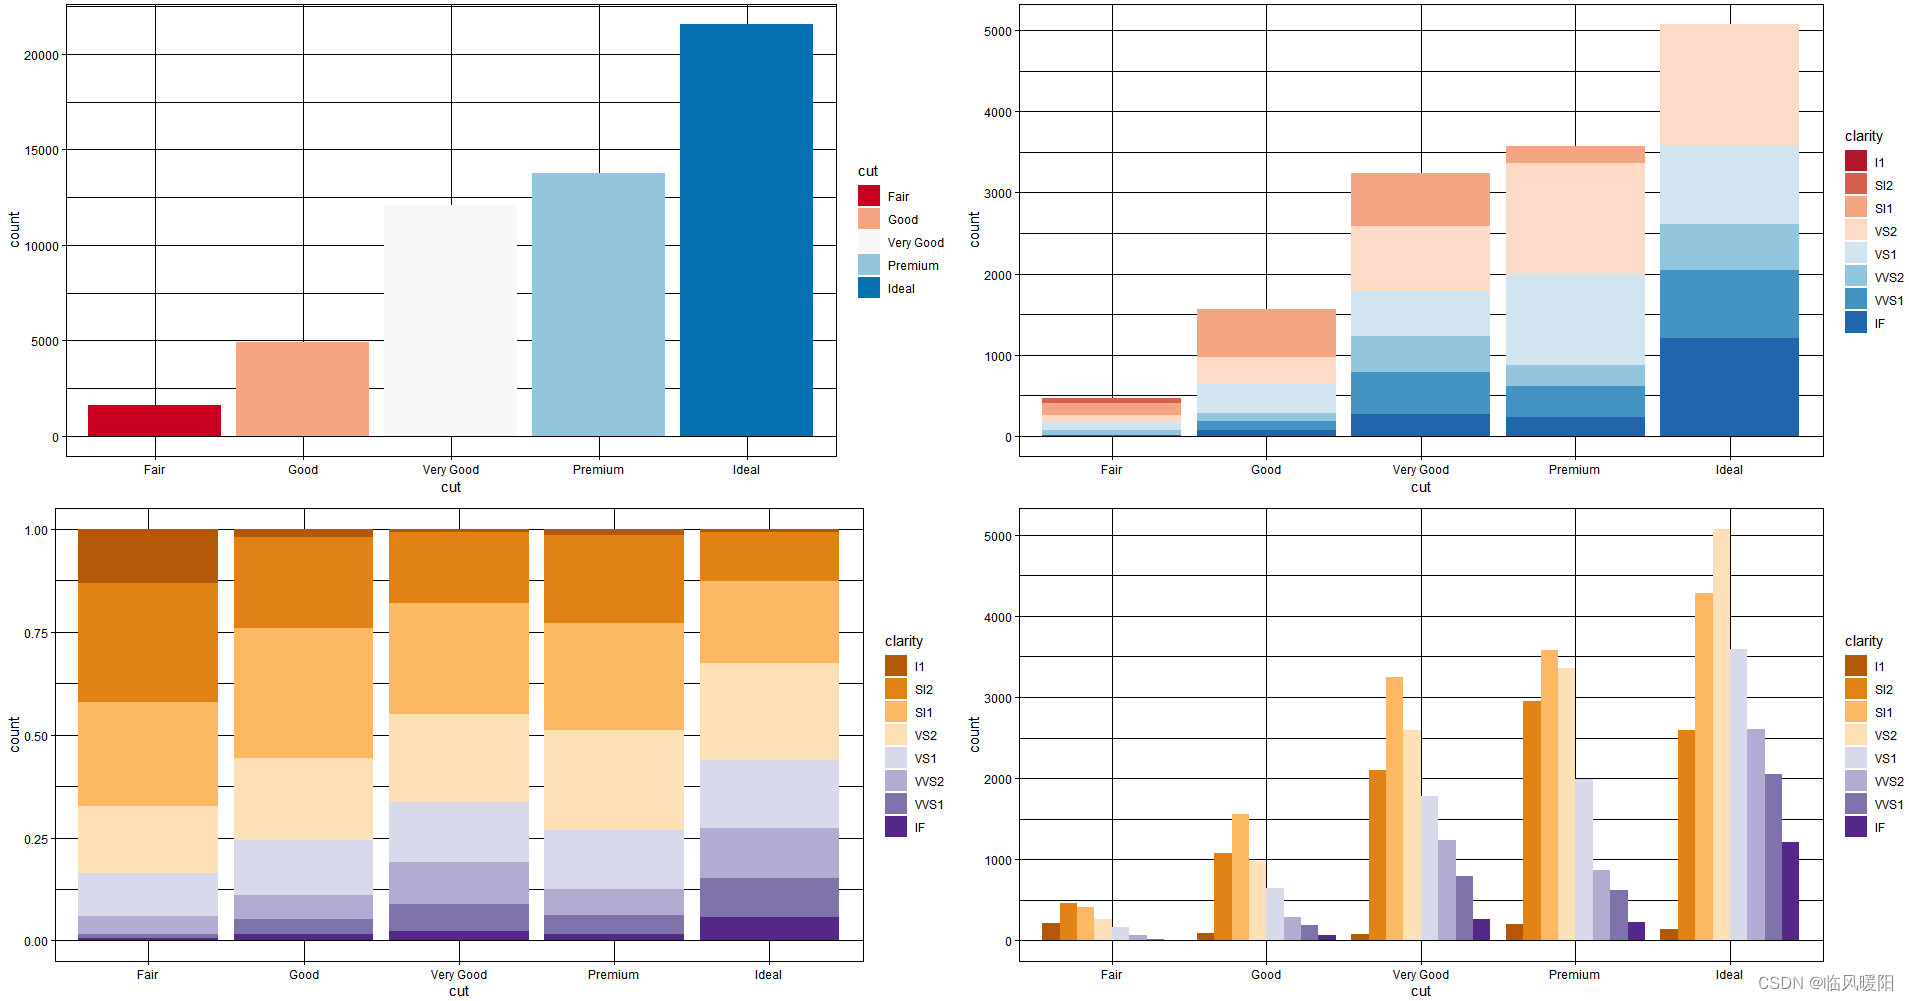
scale_fill_brewer(palette = "RdBu")
# 分类直方图
p4 <- ggplot(data = diamonds) +
geom_bar(mapping = aes(x = cut, fill = clarity), position = "dodge") +
theme_linedraw() +
scale_fill_brewer(palette = "RdBu")
# 普通的直方图
p1 <- ggplot(data = diamonds) +
  geom_bar(mapping = aes(x = cut, fill = cut)) +
  theme_linedraw() +
  scale_fill_brewer(palette = "RdBu")

# 堆积直方图
p2 <- ggplot(data = diamonds) +
  geom_bar(mapping = aes(x = cut, fill = clarity), position = "identity") +
  theme_linedraw() +
  scale_fill_brewer(palette = "RdBu")

# 累积直方图
p3 <- ggplot(data = diamonds) +
  geom_bar(mapping = aes(x = cut, fill = clarity), position = "fill") +
  theme_linedraw() +
  scale_fill_brewer(palette = "PuOr")

# 分类直方图
p4 <- ggplot(data = diamonds) +
  geom_bar(mapping = aes(x = cut, fill = clarity), position = "dodge") +
  theme_linedraw() +
  scale_fill_brewer(palette = "PuOr")
# 普通的直方图
p1 <- ggplot(data = diamonds) +
  geom_bar(mapping = aes(x = cut, fill = cut)) +
  theme_linedraw() +
  scale_fill_brewer(palette = "PuOr")

# 堆积直方图
p2 <- ggplot(data = diamonds) +
  geom_bar(mapping = aes(x = cut, fill = clarity), position = "identity") +
  theme_linedraw() +
  scale_fill_brewer(palette = "PuOr")

# 累积直方图
p3 <- ggplot(data = diamonds) +
  geom_bar(mapping = aes(x = cut, fill = clarity), position = "fill") +
  theme_linedraw() +
  scale_fill_brewer(palette = "PRGn")

# 分类直方图
p4 <- ggplot(data = diamonds) +
  geom_bar(mapping = aes(x = cut, fill = clarity), position = "dodge") +
  theme_linedraw() +
  scale_fill_brewer(palette = "PRGn")
# 普通的直方图
p1 <- ggplot(data = diamonds) +
  geom_bar(mapping = aes(x = cut, fill = cut)) +
  theme_linedraw() +
  scale_fill_brewer(palette = "PRGn")

# 堆积直方图
p2 <- ggplot(data = diamonds) +
  geom_bar(mapping = aes(x = cut, fill = clarity), position = "identity") +
  theme_linedraw() +
  scale_fill_brewer(palette = "PRGn")

# 累积直方图
p3 <- ggplot(data = diamonds) +
  geom_bar(mapping = aes(x = cut, fill = clarity), position = "fill") +
  theme_linedraw() +
  scale_fill_brewer(palette = "PiYG")

# 分类直方图
p4 <- ggplot(data = diamonds) +
  geom_bar(mapping = aes(x = cut, fill = clarity), position = "dodge") +
  theme_linedraw() +
  scale_fill_brewer(palette = "PiYG")

# 普通的直方图
p1 <- ggplot(data = diamonds) +
  geom_bar(mapping = aes(x = cut, fill = cut)) +
  theme_linedraw() +
  scale_fill_brewer(palette = "PiYG")

# 堆积直方图
p2 <- ggplot(data = diamonds) +
  geom_bar(mapping = aes(x = cut, fill = clarity), position = "identity") +
  theme_linedraw() +
  scale_fill_brewer(palette = "PiYG")

# 累积直方图
p3 <- ggplot(data = diamonds) +
  geom_bar(mapping = aes(x = cut, fill = clarity), position = "fill") +
  theme_linedraw() +
  scale_fill_brewer(palette = "BrBG")

# 分类直方图
p4 <- ggplot(data = diamonds) +
  geom_bar(mapping = aes(x = cut, fill = clarity), position = "dodge") +
  theme_linedraw() +
  scale_fill_brewer(palette = "BrBG")
参考文献:https://blog.csdn.net/weixin_46587777/article/details/124973766
开发工具:RStudio 2023.06.1 Build 524
微信Alt+A截屏工具