目录
2.2.6批量生成图片generateManyImage()
零、写在前面
QKX-ZSZ-4000岩体真三轴动静载荷试验仪器导出应力应变数据为txt文件,当需要批量制图时需要对每个数据文件进行单独操作,过程略微重复机械。特别是当制图要求变化时,需要重新批量绘制图片,故针对该试验仪器导出的数据采用Python进行数据处理并出图,并采用GUI进行交互,实现批量化重复操作。
使用的库主要有Pandas、Matplotlib、Tkinter
文章主要分为两部分:
①数据处理及制图(应力-应变曲线、应力-时间曲线)
②GUI界面
一、数据处理及制图
1.1数据读取与处理
由于需要画出应力-应变曲线与应力-时间曲线,于是根据三轴试验仪器导出的txt数据可以看出,我们需要的数据为时间、Z轴力与Z轴位移。
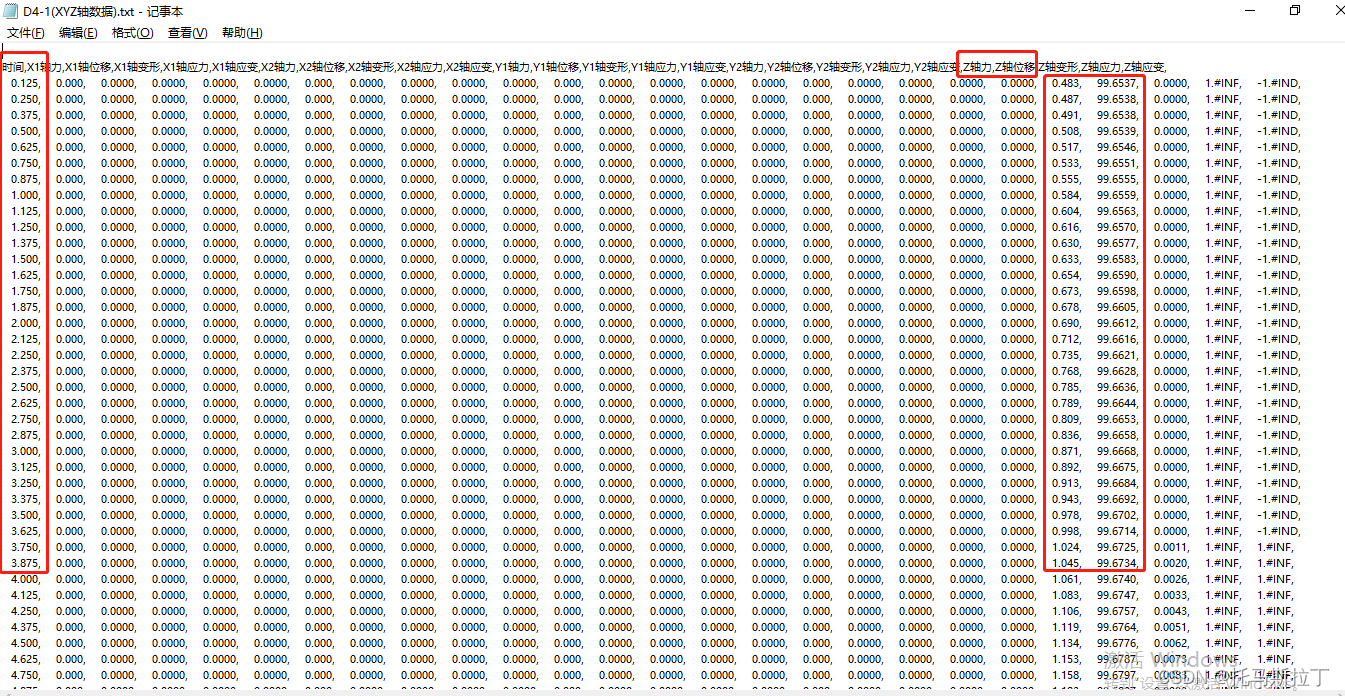
数据分为单轴抗拉与单轴抗拉数据,于是数据输出命名方式为L1-1或Y1-1,且数据只在后缀为“XYZ轴数据”的文件里。
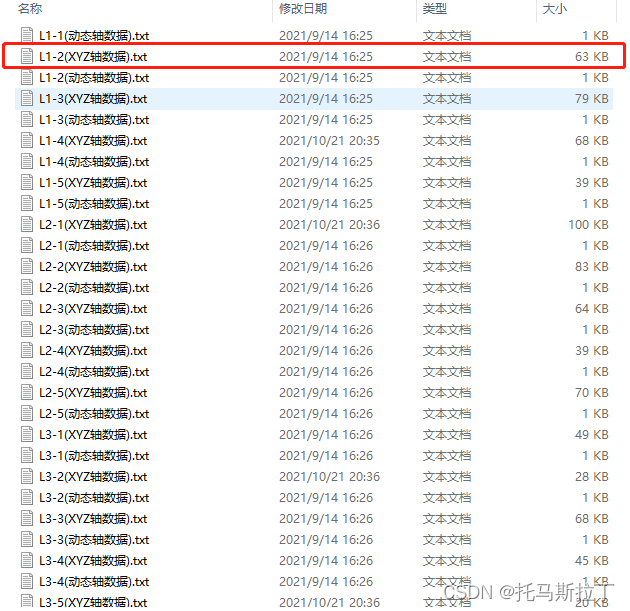
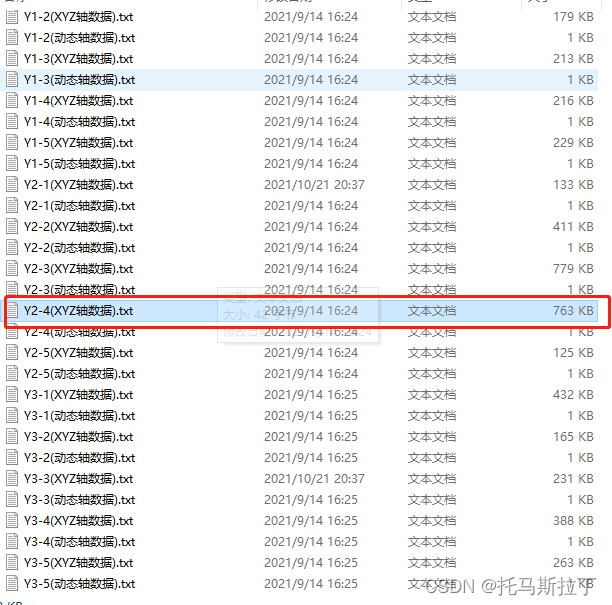
于是,根据上述数据命名规律,采用for循环+format控制每次需要读取的文件名,可以编写以下代码逐个读取文件:
单轴抗压与单轴抗拉关于应力与应变的计算此处不赘述,具体可以看岩石力学相关书籍。
#单轴抗压
for eachGroup in range(1,4):
    for eachIndex in range(1,6):
        test = pd.read_csv("Y{}-{}(XYZ轴数据).txt".format(eachGroup,eachIndex),encoding="gbk")[["时间","Z轴力","Z轴位移"]]
        test["stress"] = test["Z轴力"]*1000 / (np.pi * (50/2)**2)
        test["应变"] = (test["Z轴位移"] - test["Z轴位移"][0])/100


#单轴抗拉
for eachGroup in range(1,4):
    for eachIndex in range(1,6):
        test = pd.read_csv("L{}-{}(XYZ轴数据).txt".format(eachGroup,eachIndex),encoding="gbk")[["时间","Z轴力","Z轴位移"]]
        test["stress"] = 2*test["Z轴力"]*1000 / (np.pi * 50* 50)
        test["应变"] = (test["Z轴位移"] - test["Z轴位移"][0])/50
1.2制图
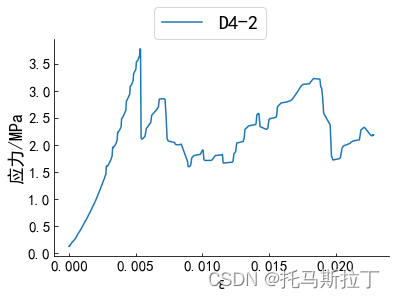
于是,根据试验数据计算出应力及应变后,可以绘制相关曲线:
xticks与yticks设置刻度大小
xlabel与ylabel设置横纵坐标文字及大小
legend设置图例大小及位置
savefig设置图片存储位置及清晰度
plt.xticks(fontsize=18)
plt.yticks(fontsize=18)
plt.xlabel("时间/s",fontsize=18)
plt.ylabel("应力/Mpa",fontsize=18)
plt.plot(test["时间"],test["stress"],label="L{}-{}".format(eachGroup,eachIndex))
plt.legend(fontsize=20,loc='upper left')
plt.savefig(".\图片\应力时间图:L{}-{}.jpg".format(eachGroup,eachIndex),dpi=500,bbox_inches = 'tight')
plt.show()


plt.xticks(fontsize=18)
plt.yticks(fontsize=18)
plt.xlabel("ε",fontsize=18)
plt.ylabel("应力/Mpa",fontsize=18)
plt.plot(test["应变"],test["stress"],label="L{}-{}".format(eachGroup,eachIndex))
plt.legend(fontsize=20,loc='upper left')
plt.savefig(".\图片\应力应变图:L{}-{}.jpg".format(eachGroup,eachIndex),dpi=500,bbox_inches = 'tight')
plt.show()
1.3完整代码
以单轴抗压为例:
for eachGroup in range(1,4):
    for eachIndex in range(1,6):
        test = pd.read_csv("Y{}-{}(XYZ轴数据).txt".format(eachGroup,eachIndex),encoding="gbk")[["时间","Z轴力","Z轴位移"]]
        test["stress"] = test["Z轴力"]*1000 / (np.pi * (50/2)**2)
        test["应变"] = (test["Z轴位移"] - test["Z轴位移"][0])/100

        plt.xticks(fontsize=18)
        plt.yticks(fontsize=18)
        plt.xlabel("时间/s",fontsize=18)
        plt.ylabel("应力/Mpa",fontsize=18)
        plt.plot(test["时间"],test["stress"],label="Y{}-{}".format(eachGroup,eachIndex))
        plt.legend(fontsize=20,loc='upper left')
        plt.savefig(".\图片\应力时间图:Y{}-{}.jpg".format(eachGroup,eachIndex),dpi=500,bbox_inches = 'tight')
        plt.show()


        plt.xticks(fontsize=18)
        plt.yticks(fontsize=18)
        plt.xlabel("ε",fontsize=18)
        plt.ylabel("应力/Mpa",fontsize=18)
        plt.plot(test["应变"],test["stress"],label="Y{}-{}".format(eachGroup,eachIndex))
        plt.legend(fontsize=20,loc='upper left')
        plt.savefig(".\图片\应力应变图:Y{}-{}.jpg".format(eachGroup,eachIndex),dpi=500,bbox_inches = 'tight')
        plt.show()
二、GUI界面
从第一部分可以看出,绘制相关图片的代码较为简单,主要就是批量读取数据,根据试验数据计算出相关计算参数,并批量绘制相关图片。但该过程需要安装Python及相关库,不方便他人使用,于是基于Tkinter编写GUI界面,并采用Anaconda对代码打包成exe文件(具体打包方法可以参考该链接)。
2.1完整代码
from tkinter import *
from tkinter import messagebox
from tkinter.filedialog import *

import numpy as np
import matplotlib.pyplot as plt
import pandas as pd

import matplotlib.ticker as ticker
import mpl_toolkits.axisartist as AA
from mpl_toolkits.axisartist.axislines import SubplotZero
import pylab

pylab.mpl.rcParams['font.sans-serif'] = ['SimHei']
plt.rcParams['axes.unicode_minus']=False  #用于解决不能显示负号的问题

class Application(Frame):
    def __init__(self,master=None):
        super().__init__(master)
        self.master = master
        self.pack()
        self.config(width=1000, height=600)

        self.creatWidget()


        self.but1Flag = 0
        self.but2Flag = 0
        self.but3Flag = 0
        self.SavePath = 0


    def creatWidget(self):
        #图片缩略图
        # self.imageShow = Text(self,width=110,height=32)
        self.imageShow1 = Text(self,width=60,height=22)
        self.imageShow1.place(x=15,y=25)

        self.imageShow2 = Text(self,width=60,height=22)
        self.imageShow2.place(x=445,y=25)


        #上传文件
        btnSelectFileDGS10 = Button(self,text="1.批量选择文件",command=self.selectFileDGS10,bg="white")
        btnSelectFileDGS10.place(x=260,y=340)

        # 保存图片
        btnSavePath = Button(self, text="2.设置保存位置", command=self.SavePath, bg="white")
        btnSavePath.place(x=360, y=340)

        #生成图片
        btn = Button(self,text="3.生成效果图", command=self.generateImage, bg="white")
        btn.place(x=460, y=340)

        #生成图片
        btn = Button(self,text="4.批量生成", command=self.generateManyImage, bg="white")
        btn.place(x=550, y=340)

        self.label1 = Label(self,text="应力-时间图")
        self.label1.place(x=180,y=2)

        self.label2 = Label(self,text="应力-应变图")
        self.label2.place(x=620,y=2)

        self.tip = Label(self,text="使用顺序:1->2->3->4")
        self.tip.place(x=10,y=450)


        self.labelXTick = Label(self,text="X轴刻度大小:")
        self.temp = StringVar(value="15")
        self.entryXTick = Entry(self,textvariable=self.temp)
        self.labelXTick.place(x=100,y=380)
        self.entryXTick.place(x=180,y=380,width=30)

        self.labelYTick = Label(self,text="Y轴刻度大小:")
        self.temp = StringVar(value="15")
        self.entryYTick = Entry(self,textvariable=self.temp)
        self.labelYTick.place(x=100,y=410)
        self.entryYTick.place(x=180,y=410,width=30)

        self.labelXLabel = Label(self,text="X轴名称大小:")
        self.temp = StringVar(value="18")
        self.entryXLabel = Entry(self,textvariable=self.temp)
        self.labelXLabel.place(x=200,y=380)
        self.entryXLabel.place(x=280,y=380,width=30)

        self.labelYLabel = Label(self,text="Y轴名称大小:")
        self.temp = StringVar(value="18")
        self.entryYLabel = Entry(self,textvariable=self.temp)
        self.labelYLabel.place(x=200,y=410)
        self.entryYLabel.place(x=280,y=410,width=30)

        self.labelXnameLeft = Label(self,text="左图X轴坐标名称:")
        self.temp = StringVar(value="时间/s")
        self.entryXnameLeft = Entry(self,textvariable=self.temp)
        self.labelXnameLeft.place(x=300,y=380)
        self.entryXnameLeft.place(x=400,y=380,width=70)

        self.labelYnameLeft = Label(self,text="左图Y轴坐标名称:")
        self.temp = StringVar(value="应力/MPa")
        self.entryYnameLeft = Entry(self,textvariable=self.temp)
        self.labelYnameLeft.place(x=300,y=410)
        self.entryYnameLeft.place(x=400,y=410,width=70)

        self.labelXnameRight = Label(self,text="右图X轴坐标名称:")
        self.temp = StringVar(value="ε")
        self.entryXnameRight = Entry(self,textvariable=self.temp)
        self.labelXnameRight.place(x=470,y=380)
        self.entryXnameRight.place(x=570,y=380,width=70)

        self.labelYnameRight = Label(self,text="右图Y轴坐标名称:")
        self.temp = StringVar(value="应力/MPa")
        self.entryYnameRight = Entry(self,textvariable=self.temp)
        self.labelYnameRight.place(x=470,y=410)
        self.entryYnameRight.place(x=570,y=410,width=70)


        self.choiceRithtTopEdgeVale= IntVar()
        self.choiceRithtTopEdgeVale.set(1)
        self.choiceRithtTopEdge = Checkbutton(self,text="去除右边与顶部边框",variable=self.choiceRithtTopEdgeVale)
        self.choiceRithtTopEdge.place(x=100,y=430)

    def SavePath(self):

        if self.but1Flag == 0:
            messagebox.showinfo("Error","请先选择数据完成步骤1!!!")
            return
        self.SavePath = askdirectory(title="设置保存位置")
        print(self.SavePath)
        if self.SavePath != "":
            self.but2Flag = 1
            self.savePathShow = Label(self,text="当前保存路径:"+self.SavePath)
            self.savePathShow.place(x=10,y=490)

    def generateManyImage(self):

        if self.but3Flag != 1:
            messagebox.showinfo("Error","请先完成步骤3!!!")
            return

        self.xTickScale = int(self.entryXTick.get())
        self.yTickScale = int(self.entryYTick.get())
        self.xLabelScale = int(self.entryXLabel.get())
        self.yLabelScale = int(self.entryYLabel.get())
        self.xLabelNameLeft = self.entryXnameLeft.get()
        self.yLabelNameLeft = self.entryYnameLeft.get()
        self.xLabelNameRight = self.entryXnameRight.get()
        self.yLabelNameRight = self.entryYnameRight.get()
        self.remoteTopRightEdge = self.choiceRithtTopEdgeVale.get()


        for each in self.pathDGS10:
#             test = pd.read_csv(each,encoding="gbk")[["时间","Y1轴变形 Z轴力"," Z轴位移","Z轴变形"]]
            test = pd.read_csv(each,encoding="gbk")[["时间","Z轴力","Z轴位移","Z轴变形"]]
#             print(test)
            if each.split("(")[0][-4] == "Y":
                test["stress"] = test["Z轴力"]*1000 / (np.pi * (50/2)**2)
                test["应变"] = (test["Z轴位移"] - test["Z轴位移"][0])/100
            elif each.split("(")[0][-4] == "L":
                test["stress"] = 2*test["Y1轴变形 Z轴力"]*1000 / (np.pi * 50* 50)
                test["应变"] = (test["Z轴位移"] - test["Z轴位移"][0])/50

            fig, ax=plt.subplots()
            ax.spines['top'].set_visible(not bool(self.remoteTopRightEdge))
            ax.spines['right'].set_visible(not bool(self.remoteTopRightEdge))
            plt.rcParams['xtick.direction'] = 'in'
            plt.rcParams['ytick.direction'] = 'in'
            plt.xticks(fontsize=self.xTickScale)
            plt.yticks(fontsize=self.yTickScale)
            plt.xlabel(self.xLabelNameLeft,fontsize=self.xLabelScale)
            plt.ylabel(self.yLabelNameLeft,fontsize=self.yLabelScale)
            plt.plot(test["时间"],test["stress"],label="B"+each.split("/")[-1].split(".")[0].split("(")[0])
#             plt.legend(fontsize=20,loc=[0.3,1])
            plt.legend(fontsize=20,loc="best")

            self.imagePath1 = self.SavePath + "/" + each.split("/")[-1].split(".")[0].split("(")[0]+"-(应力-时间).png"
            plt.savefig(self.imagePath1,bbox_inches='tight')
#             plt.show()
#             self.photo1 = PhotoImage(file=self.imagePath1)
#             self.imageShow1.image_create(1.0,image=self.photo1)

            fig, ax=plt.subplots()
            ax.spines['top'].set_visible(not bool(self.remoteTopRightEdge))
            ax.spines['right'].set_visible(not bool(self.remoteTopRightEdge))
            plt.rcParams['xtick.direction'] = 'in'
            plt.rcParams['ytick.direction'] = 'in'
            plt.xticks(fontsize=self.xTickScale)
            plt.yticks(fontsize=self.yTickScale)
            plt.xlabel(self.xLabelNameRight,fontsize=self.xLabelScale)
            plt.ylabel(self.yLabelNameRight,fontsize=self.yLabelScale)
            plt.plot(test["应变"],test["stress"],label="B"+each.split("/")[-1].split(".")[0].split("(")[0])
#             plt.legend(fontsize=20,loc=[0.3,1])
            plt.legend(fontsize=20,loc="best")

            self.imagePath2 = self.SavePath + "/" + each.split("/")[-1].split(".")[0].split("(")[0]+"-(应力-应变).png"
            plt.savefig(self.imagePath2,bbox_inches='tight')
#             plt.show()
#             self.photo2 = PhotoImage(file=self.imagePath2)
#             self.imageShow2.image_create(1.0,image=self.photo2)


    def generateImage(self):

        if self.but2Flag == 0:
            messagebox.showinfo("Error","请先选择图片保存路径完成步骤2!!!")
            return

        self.xTickScale = int(self.entryXTick.get())
        self.yTickScale = int(self.entryYTick.get())
        self.xLabelScale = int(self.entryXLabel.get())
        self.yLabelScale = int(self.entryYLabel.get())
        self.xLabelNameLeft = self.entryXnameLeft.get()
        self.yLabelNameLeft = self.entryYnameLeft.get()
        self.xLabelNameRight = self.entryXnameRight.get()
        self.yLabelNameRight = self.entryYnameRight.get()

        self.remoteTopRightEdge = self.choiceRithtTopEdgeVale.get()


#         test = pd.read_csv(self.pathDGS10[0],encoding="gbk")[["时间","Y1轴变形 Z轴力"," Z轴位移","Z轴变形"]]
#         test = pd.read_csv(each,encoding="gbk")[["时间","Z轴力","Z轴位移","Z轴变形"]]
        test = pd.read_csv(self.pathDGS10[0],encoding="gbk")[["时间","Z轴力","Z轴位移","Z轴变形"]]

#         print(self.pathDGS10[0],self.pathDGS10[0].split("(")[0][-4])
        if self.pathDGS10[0].split("(")[0][-4] == "Y":
            test["stress"] = test["Z轴力"]*1000 / (np.pi * (50/2)**2)
            test["应变"] = (test["Z轴位移"] - test["Z轴位移"][0])/100
        elif self.pathDGS10[0].split("(")[0][-4] == "L":
            test["stress"] = 2*test["Z轴力"]*1000 / (np.pi * 50* 50)
            test["应变"] = (test["Z轴位移"] - test["Z轴位移"][0])/50


#         tempStrain = (test[np.abs(test["stress"] - test["stress"].max()/2)<0.05].iloc[0][" Z轴位移"] - test[" Z轴位移"][0])/100
#         print(test["Y1轴变形 Z轴力"].max(),test["stress"].max(),tempStrain,test["stress"].max()/2/tempStrain/1000)

        fig, ax=plt.subplots()
        ax.spines['top'].set_visible(not bool(self.remoteTopRightEdge))
        ax.spines['right'].set_visible(not bool(self.remoteTopRightEdge))
        plt.rcParams['xtick.direction'] = 'in'
        plt.rcParams['ytick.direction'] = 'in'
        plt.xticks(fontsize=self.xTickScale)
        plt.yticks(fontsize=self.yTickScale)
        plt.xlabel(self.xLabelNameLeft,fontsize=self.xLabelScale)
        plt.ylabel(self.yLabelNameLeft,fontsize=self.yLabelScale)
        plt.plot(test["时间"],test["stress"],label="B"+self.pathDGS10[0].split("/")[-1].split(".")[0].split("(")[0])
#         plt.legend(fontsize=20,loc=[0.3,1])
        plt.legend(fontsize=20,loc="best")

        self.imagePath1 = self.SavePath + "/" + self.pathDGS10[0].split("/")[-1].split(".")[0].split("(")[0]+"-(应力-时间).png"
        plt.savefig(self.imagePath1,dpi=63,bbox_inches='tight')
        plt.clf() #此处需要修改,不需要show出来
        self.photo1 = PhotoImage(file=self.imagePath1)
        self.imageShow1.image_create(1.0,image=self.photo1)

        fig, ax=plt.subplots()
        ax.spines['top'].set_visible(not bool(self.remoteTopRightEdge))
        ax.spines['right'].set_visible(not bool(self.remoteTopRightEdge))
        plt.rcParams['xtick.direction'] = 'in'
        plt.rcParams['ytick.direction'] = 'in'
        plt.xticks(fontsize=self.xTickScale)
        plt.yticks(fontsize=self.yTickScale)
        plt.xlabel(self.xLabelNameRight,fontsize=self.xLabelScale)
        plt.ylabel(self.yLabelNameRight,fontsize=self.yLabelScale)
        plt.plot(test["应变"],test["stress"],label="B"+self.pathDGS10[0].split("/")[-1].split(".")[0].split("(")[0])
#         plt.legend(fontsize=20,loc=[0.3,1])
        plt.legend(fontsize=20,loc="best")

        self.imagePath2 = self.SavePath + "/" + self.pathDGS10[0].split("/")[-1].split(".")[0].split("(")[0]+"-(应力-时间).png"
        plt.savefig(self.imagePath2,dpi=63,bbox_inches='tight')
        plt.clf()
        self.photo2 = PhotoImage(file=self.imagePath2)
        self.imageShow2.image_create(1.0,image=self.photo2)

        self.but3Flag = 1


    def selectFile(self):

        temp = askopenfilenames(title="批量选择文件")
        self.pathDGS10 = []
        for each in temp:
            if "XYZ" in each:
                self.pathDGS10.append(each)
        if len(self.pathDGS10) != 0:
            self.but1Flag = 1
            self.selectFileShow = Label(self,text="共选择:"+str(len(self.pathDGS10))+"个文件!")
            self.selectFileShow.place(x=10,y=470)


if __name__ == '__main__':
    root = Tk()
    root.title("一键生成单轴图片")
    root.geometry("875x600+200+50")
    root.resizable(0,0)
    app = Application(master=root)
    root.mainloop()
    print("test1")
2.2部分代码说明
2.2.1经典GUI程序类的写法
"""经典的 GUI 程序的写法"""
from tkinter import *
from tkinter import messagebox
class Application(Frame):
    """一个经典的 GUI 程序的类的写法"""
    def __init__(self, master=None):
        super().__init__(master) # super()
        self.master = master self.pack()
        self.createWidget()

    def createWidget(self):
        """创建组件"""
        pass

    def action(self):
        """执行函数"""
        pass

if __name__ == '__main__':
    root = Tk()
    root.geometry("400x100+200+300")
    root.title("一个经典的 GUI 程序类的测试")
    app = Application(master=root)
    root.mainloop()
根据该框架,本文GUI代码整体上分为以下部分:
from tkinter import *
from tkinter import messagebox
from tkinter.filedialog import *

import numpy as np
import matplotlib.pyplot as plt
import pandas as pd

import matplotlib.ticker as ticker
import mpl_toolkits.axisartist as AA
from mpl_toolkits.axisartist.axislines import SubplotZero
import pylab

pylab.mpl.rcParams['font.sans-serif'] = ['SimHei']
plt.rcParams['axes.unicode_minus']=False  #用于解决不能显示负号的问题

class Application(Frame):
    def __init__(self,master=None):
        super().__init__(master)
        self.master = master
        self.pack()
        self.config(width=1000, height=600)

        self.creatWidget()

        self.but1Flag = 0
        self.but2Flag = 0
        self.but3Flag = 0
        self.SavePath = 0


    def creatWidget(self):
        pass

    def SavePath(self):
        pass

    def generateManyImage(self):
        pass

    def generateImage(self):
        pass

    def selectFile(self):
        pass


if __name__ == '__main__':
    root = Tk()
    root.title("一键生成单轴图片")
    root.geometry("875x600+200+50")
    root.resizable(0,0)
    app = Application(master=root)
    root.mainloop()
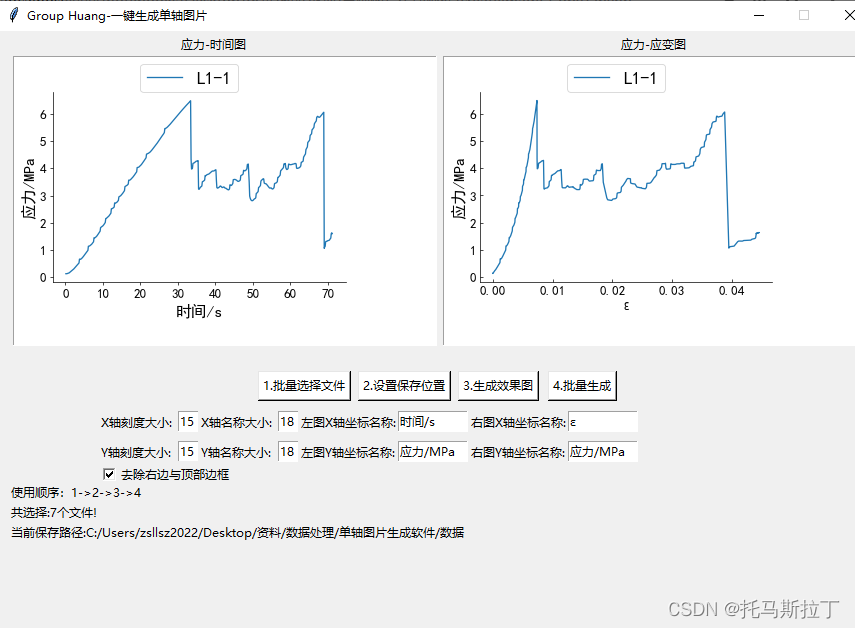
2.2.2创建控件creatWidget()
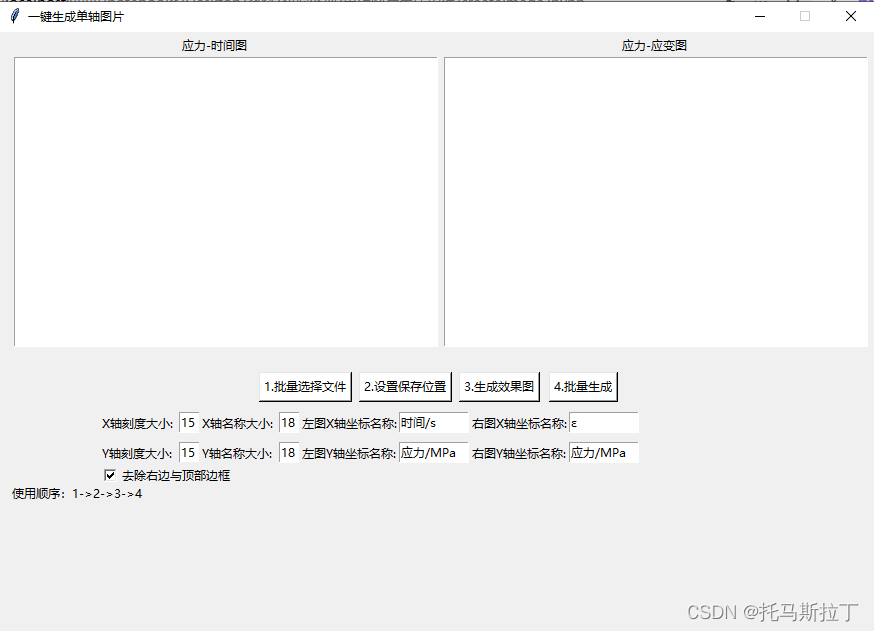
创建控件(按钮、文本标签、文本栏),并采用place方法放置在相应位置。
    def creatWidget(self):
        #图片缩略图
        # self.imageShow = Text(self,width=110,height=32)
        self.imageShow1 = Text(self,width=60,height=22)
        self.imageShow1.place(x=15,y=25)

        self.imageShow2 = Text(self,width=60,height=22)
        self.imageShow2.place(x=445,y=25)


        #上传文件
        btnSelectFileDGS10 = Button(self,text="1.批量选择文件",command=self.selectFileDGS10,bg="white")
        btnSelectFileDGS10.place(x=260,y=340)

        # 保存图片
        btnSavePath = Button(self, text="2.设置保存位置", command=self.SavePath, bg="white")
        btnSavePath.place(x=360, y=340)

        #生成图片
        btn = Button(self,text="3.生成效果图", command=self.generateImage, bg="white")
        btn.place(x=460, y=340)

        #生成图片
        btn = Button(self,text="4.批量生成", command=self.generateManyImage, bg="white")
        btn.place(x=550, y=340)

        self.label1 = Label(self,text="应力-时间图")
        self.label1.place(x=180,y=2)

        self.label2 = Label(self,text="应力-应变图")
        self.label2.place(x=620,y=2)

        self.tip = Label(self,text="使用顺序:1->2->3->4")
        self.tip.place(x=10,y=450)


        self.labelXTick = Label(self,text="X轴刻度大小:")
        self.temp = StringVar(value="15")
        self.entryXTick = Entry(self,textvariable=self.temp)
        self.labelXTick.place(x=100,y=380)
        self.entryXTick.place(x=180,y=380,width=30)

        self.labelYTick = Label(self,text="Y轴刻度大小:")
        self.temp = StringVar(value="15")
        self.entryYTick = Entry(self,textvariable=self.temp)
        self.labelYTick.place(x=100,y=410)
        self.entryYTick.place(x=180,y=410,width=30)

        self.labelXLabel = Label(self,text="X轴名称大小:")
        self.temp = StringVar(value="18")
        self.entryXLabel = Entry(self,textvariable=self.temp)
        self.labelXLabel.place(x=200,y=380)
        self.entryXLabel.place(x=280,y=380,width=30)

        self.labelYLabel = Label(self,text="Y轴名称大小:")
        self.temp = StringVar(value="18")
        self.entryYLabel = Entry(self,textvariable=self.temp)
        self.labelYLabel.place(x=200,y=410)
        self.entryYLabel.place(x=280,y=410,width=30)

        self.labelXnameLeft = Label(self,text="左图X轴坐标名称:")
        self.temp = StringVar(value="时间/s")
        self.entryXnameLeft = Entry(self,textvariable=self.temp)
        self.labelXnameLeft.place(x=300,y=380)
        self.entryXnameLeft.place(x=400,y=380,width=70)

        self.labelYnameLeft = Label(self,text="左图Y轴坐标名称:")
        self.temp = StringVar(value="应力/MPa")
        self.entryYnameLeft = Entry(self,textvariable=self.temp)
        self.labelYnameLeft.place(x=300,y=410)
        self.entryYnameLeft.place(x=400,y=410,width=70)

        self.labelXnameRight = Label(self,text="右图X轴坐标名称:")
        self.temp = StringVar(value="ε")
        self.entryXnameRight = Entry(self,textvariable=self.temp)
        self.labelXnameRight.place(x=470,y=380)
        self.entryXnameRight.place(x=570,y=380,width=70)

        self.labelYnameRight = Label(self,text="右图Y轴坐标名称:")
        self.temp = StringVar(value="应力/MPa")
        self.entryYnameRight = Entry(self,textvariable=self.temp)
        self.labelYnameRight.place(x=470,y=410)
        self.entryYnameRight.place(x=570,y=410,width=70)


        self.choiceRithtTopEdgeVale= IntVar()
        self.choiceRithtTopEdgeVale.set(1)
        self.choiceRithtTopEdge = Checkbutton(self,text="去除右边与顶部边框",variable=self.choiceRithtTopEdgeVale)
        self.choiceRithtTopEdge.place(x=100,y=430)
效果如图:
2.2.3 批量选择文件selectFile()
批量选择文件并将文件名保存在列表,并在界面中显示一共选择多少个文件。
    def selectFile(self):

        temp = askopenfilenames(title="批量选择文件")
        self.pathDGS10 = []
        for each in temp:
            if "XYZ" in each:
                self.pathDGS10.append(each)
        if len(self.pathDGS10) != 0:
            self.but1Flag = 1
            self.selectFileShow = Label(self,text="共选择:"+str(len(self.pathDGS10))+"个文件!")
            self.selectFileShow.place(x=10,y=470)
注意:此处将but1Flag置为1
2.2.4设置保存位置SavePath()
由于在selectFile方法中将此处将but1Flag置为1,因此该方法中首先判断第一步是否完成,若未完成则不执行后续操作!因此类推,在完成设置保存路径操作后将but2Flag置为1,以此类推来完成步骤控制。
同样的,将保存路径保存在变量中,并在界面中显示当前保存路径。
    def SavePath(self):

        if self.but1Flag == 0:
            messagebox.showinfo("Error","请先选择数据完成步骤1!!!")
            return
        self.SavePath = askdirectory(title="设置保存位置")
        print(self.SavePath)
        if self.SavePath != "":
            self.but2Flag = 1
            self.savePathShow = Label(self,text="当前保存路径:"+self.SavePath)
            self.savePathShow.place(x=10,y=490)
2.2.5生成缩略图generateImage()
整体思路与第一部分相同,只是根据界面的控制读取相应参数,改变制图细节
    def generateImage(self):

        if self.but2Flag == 0:
            messagebox.showinfo("Error","请先选择图片保存路径完成步骤2!!!")
            return

        self.xTickScale = int(self.entryXTick.get())
        self.yTickScale = int(self.entryYTick.get())
        self.xLabelScale = int(self.entryXLabel.get())
        self.yLabelScale = int(self.entryYLabel.get())
        self.xLabelNameLeft = self.entryXnameLeft.get()
        self.yLabelNameLeft = self.entryYnameLeft.get()
        self.xLabelNameRight = self.entryXnameRight.get()
        self.yLabelNameRight = self.entryYnameRight.get()

        self.remoteTopRightEdge = self.choiceRithtTopEdgeVale.get()


#         test = pd.read_csv(self.pathDGS10[0],encoding="gbk")[["时间","Y1轴变形 Z轴力"," Z轴位移","Z轴变形"]]
#         test = pd.read_csv(each,encoding="gbk")[["时间","Z轴力","Z轴位移","Z轴变形"]]
        test = pd.read_csv(self.pathDGS10[0],encoding="gbk")[["时间","Z轴力","Z轴位移","Z轴变形"]]

#         print(self.pathDGS10[0],self.pathDGS10[0].split("(")[0][-4])
        if self.pathDGS10[0].split("(")[0][-4] == "Y":
            test["stress"] = test["Z轴力"]*1000 / (np.pi * (50/2)**2)
            test["应变"] = (test["Z轴位移"] - test["Z轴位移"][0])/100
        elif self.pathDGS10[0].split("(")[0][-4] == "L":
            test["stress"] = 2*test["Z轴力"]*1000 / (np.pi * 50* 50)
            test["应变"] = (test["Z轴位移"] - test["Z轴位移"][0])/50


#         tempStrain = (test[np.abs(test["stress"] - test["stress"].max()/2)<0.05].iloc[0][" Z轴位移"] - test[" Z轴位移"][0])/100
#         print(test["Y1轴变形 Z轴力"].max(),test["stress"].max(),tempStrain,test["stress"].max()/2/tempStrain/1000)

        fig, ax=plt.subplots()
        ax.spines['top'].set_visible(not bool(self.remoteTopRightEdge))
        ax.spines['right'].set_visible(not bool(self.remoteTopRightEdge))
        plt.rcParams['xtick.direction'] = 'in'
        plt.rcParams['ytick.direction'] = 'in'
        plt.xticks(fontsize=self.xTickScale)
        plt.yticks(fontsize=self.yTickScale)
        plt.xlabel(self.xLabelNameLeft,fontsize=self.xLabelScale)
        plt.ylabel(self.yLabelNameLeft,fontsize=self.yLabelScale)
        plt.plot(test["时间"],test["stress"],label="B"+self.pathDGS10[0].split("/")[-1].split(".")[0].split("(")[0])
#         plt.legend(fontsize=20,loc=[0.3,1])
        plt.legend(fontsize=20,loc="best")

        self.imagePath1 = self.SavePath + "/" + self.pathDGS10[0].split("/")[-1].split(".")[0].split("(")[0]+"-(应力-时间).png"
        plt.savefig(self.imagePath1,dpi=63,bbox_inches='tight')
        plt.clf() #此处需要修改,不需要show出来
        self.photo1 = PhotoImage(file=self.imagePath1)
        self.imageShow1.image_create(1.0,image=self.photo1)

        fig, ax=plt.subplots()
        ax.spines['top'].set_visible(not bool(self.remoteTopRightEdge))
        ax.spines['right'].set_visible(not bool(self.remoteTopRightEdge))
        plt.rcParams['xtick.direction'] = 'in'
        plt.rcParams['ytick.direction'] = 'in'
        plt.xticks(fontsize=self.xTickScale)
        plt.yticks(fontsize=self.yTickScale)
        plt.xlabel(self.xLabelNameRight,fontsize=self.xLabelScale)
        plt.ylabel(self.yLabelNameRight,fontsize=self.yLabelScale)
        plt.plot(test["应变"],test["stress"],label="B"+self.pathDGS10[0].split("/")[-1].split(".")[0].split("(")[0])
#         plt.legend(fontsize=20,loc=[0.3,1])
        plt.legend(fontsize=20,loc="best")

        self.imagePath2 = self.SavePath + "/" + self.pathDGS10[0].split("/")[-1].split(".")[0].split("(")[0]+"-(应力-时间).png"
        plt.savefig(self.imagePath2,dpi=63,bbox_inches='tight')
        plt.clf()
        self.photo2 = PhotoImage(file=self.imagePath2)
        self.imageShow2.image_create(1.0,image=self.photo2)

        self.but3Flag = 1
效果如图:
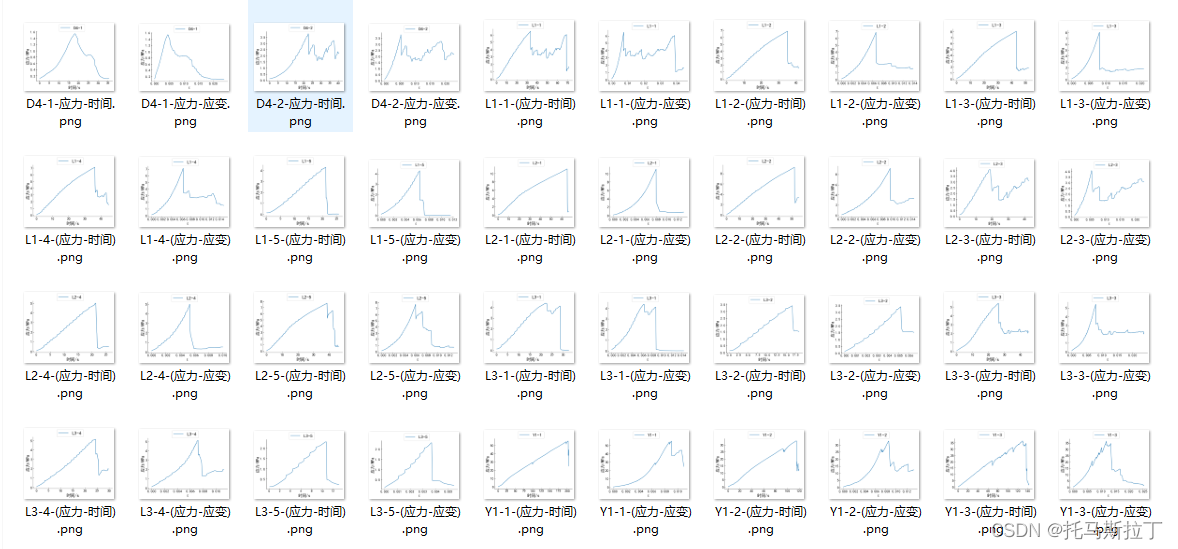
2.2.6批量生成图片generateManyImage()
与generateImage()方法大同小异,唯一区别就是在生成缩略图确定制图样式后通过遍历文件名列表批量出图!
    def generateManyImage(self):

        if self.but3Flag != 1:
            messagebox.showinfo("Error","请先完成步骤3!!!")
            return

        self.xTickScale = int(self.entryXTick.get())
        self.yTickScale = int(self.entryYTick.get())
        self.xLabelScale = int(self.entryXLabel.get())
        self.yLabelScale = int(self.entryYLabel.get())
        self.xLabelNameLeft = self.entryXnameLeft.get()
        self.yLabelNameLeft = self.entryYnameLeft.get()
        self.xLabelNameRight = self.entryXnameRight.get()
        self.yLabelNameRight = self.entryYnameRight.get()
        self.remoteTopRightEdge = self.choiceRithtTopEdgeVale.get()


        for each in self.pathDGS10:
#             test = pd.read_csv(each,encoding="gbk")[["时间","Y1轴变形 Z轴力"," Z轴位移","Z轴变形"]]
            test = pd.read_csv(each,encoding="gbk")[["时间","Z轴力","Z轴位移","Z轴变形"]]
#             print(test)
            if each.split("(")[0][-4] == "Y":
                test["stress"] = test["Z轴力"]*1000 / (np.pi * (50/2)**2)
                test["应变"] = (test["Z轴位移"] - test["Z轴位移"][0])/100
            elif each.split("(")[0][-4] == "L":
                test["stress"] = 2*test["Y1轴变形 Z轴力"]*1000 / (np.pi * 50* 50)
                test["应变"] = (test["Z轴位移"] - test["Z轴位移"][0])/50

            fig, ax=plt.subplots()
            ax.spines['top'].set_visible(not bool(self.remoteTopRightEdge))
            ax.spines['right'].set_visible(not bool(self.remoteTopRightEdge))
            plt.rcParams['xtick.direction'] = 'in'
            plt.rcParams['ytick.direction'] = 'in'
            plt.xticks(fontsize=self.xTickScale)
            plt.yticks(fontsize=self.yTickScale)
            plt.xlabel(self.xLabelNameLeft,fontsize=self.xLabelScale)
            plt.ylabel(self.yLabelNameLeft,fontsize=self.yLabelScale)
            plt.plot(test["时间"],test["stress"],label="B"+each.split("/")[-1].split(".")[0].split("(")[0])
#             plt.legend(fontsize=20,loc=[0.3,1])
            plt.legend(fontsize=20,loc="best")

            self.imagePath1 = self.SavePath + "/" + each.split("/")[-1].split(".")[0].split("(")[0]+"-(应力-时间).png"
            plt.savefig(self.imagePath1,bbox_inches='tight')
#             plt.show()
#             self.photo1 = PhotoImage(file=self.imagePath1)
#             self.imageShow1.image_create(1.0,image=self.photo1)

            fig, ax=plt.subplots()
            ax.spines['top'].set_visible(not bool(self.remoteTopRightEdge))
            ax.spines['right'].set_visible(not bool(self.remoteTopRightEdge))
            plt.rcParams['xtick.direction'] = 'in'
            plt.rcParams['ytick.direction'] = 'in'
            plt.xticks(fontsize=self.xTickScale)
            plt.yticks(fontsize=self.yTickScale)
            plt.xlabel(self.xLabelNameRight,fontsize=self.xLabelScale)
            plt.ylabel(self.yLabelNameRight,fontsize=self.yLabelScale)
            plt.plot(test["应变"],test["stress"],label="B"+each.split("/")[-1].split(".")[0].split("(")[0])
#             plt.legend(fontsize=20,loc=[0.3,1])
            plt.legend(fontsize=20,loc="best")

            self.imagePath2 = self.SavePath + "/" + each.split("/")[-1].split(".")[0].split("(")[0]+"-(应力-应变).png"
            plt.savefig(self.imagePath2,bbox_inches='tight')
效果:
最后,可以将该程序使用Anaconda打包成exe,无需安装Python及相关库,方便使用。