系统性能监控(2)
内存
看内存的使用
[root@xiaoyang ~] free -h
              total        used        free      shared  buff/cache   available
Mem:           3.7G        240M        2.8G         11M        705M        3.2G
Swap:          2.0G          0B        2.0G
[root@xiaoyang ~]#
Mem 物理内存的
Swap 交换分区
total = used+free+shared+buff/cache
buffer :在内存里是零时存放数据的地方 data 从内存到磁盘 —>写操作
cache: 在内存里是零时存放数据的地方 data 从磁盘到内存 —>读操作
available: 能够给下一个进程提供的可用空间 free + buff/cache 里的可用空间
Swap 当物理内存不足的话,会从磁盘调过来
这是交换分区,从磁盘里拿出一块空间充当内存使用 以前有个潜规则:swap分区建议设置为物理内存的两倍
[root@xiaoyang ~] cat /proc/sys/vm/swappiness
30
[root@xiaoyang ~]#
virtual memory 虚拟内存=物理内存+swap分区
swappiness 当物理内存只剩下百分之30的时候就使用交换分区

swappiness
零时修改
[root@xiaoyang ~] cat  /proc/sys/vm/swappiness
30
[root@xiaoyang ~] echo 0 >/proc/sys/vm/swappiness  当物理内存只剩下0的时候就使用交换分区
[root@xiaoyang ~] cat  /proc/sys/vm/swappiness
0
[root@xiaoyang ~]#
永久修改
[root@xiaoyang ~] vim /etc/sysctl.conf
[root@xiaoyang ~] cat /etc/sysctl.conf
# sysctl settings are defined through files in
# /usr/lib/sysctl.d/, /run/sysctl.d/, and /etc/sysctl.d/.
#
# Vendors settings live in /usr/lib/sysctl.d/.
# To override a whole file, create a new file with the same in
# /etc/sysctl.d/ and put new settings there. To override
# only specific settings, add a file with a lexically later
# name in /etc/sysctl.d/ and put new settings there.
#
# For more information, see sysctl.conf(5) and sysctl.d(5).
vm.swappiness=0
[root@xiaoyang ~] sysctl -p
vm.swappiness = 0
[root@xiaoyang ~]#
看内存信息
cat /proc/meminfo
清空一下,buffer /cache 缓存
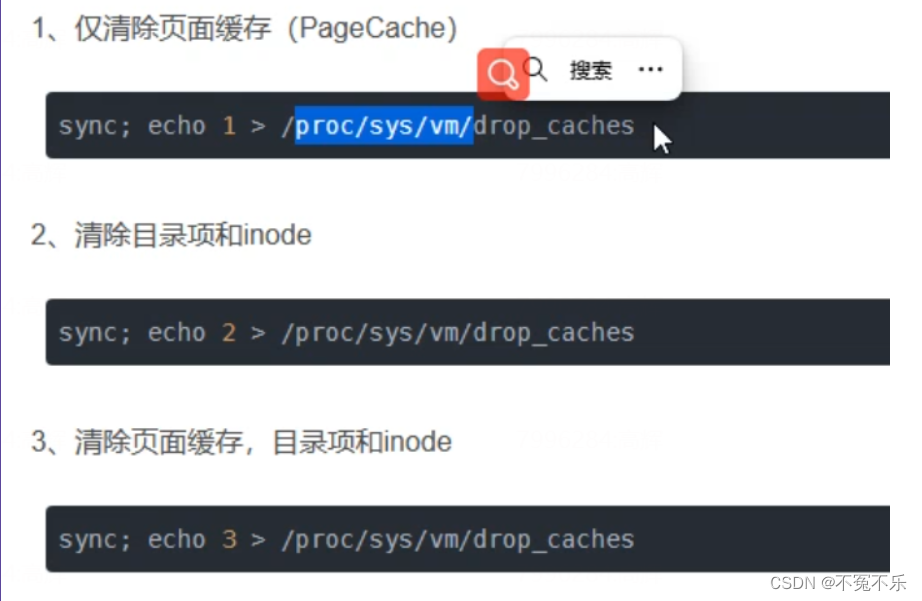
3的效果好
清空缓存:
[root@xiaoyang ~] sync ; echo 3 >/proc/sys/vm/drop_caches
[root@xiaoyang ~] free -h
              total        used        free      shared  buff/cache   available
Mem:           3.7G        231M        3.4G         11M         52M        3.3G
Swap:          2.0G          0B        2.0G
[root@xiaoyang ~]#
以上行为清除缓存里的数据,有风险,会导致数据丢失
dstat,可以看page in/out
[root@xiaoyang ~] dstat
You did not select any stats, using -cdngy by default.
----total-cpu-usage---- -dsk/total- -net/total- ---paging-- ---system--
usr sys idl wai hiq siq| read  writ| recv  send|  in   out | int   csw
  0   0 100   0   0   0|  13k 1497B|   0     0 |   0     0 |  59   104
  0   0 100   0   0   0|   0     0 |  60B  818B|   0     0 |  60    97
  0   1 100   0   0   0|   0     0 |  60B  338B|   0     0 |  53    83
  0   0 100   0   0   0|   0     0 | 120B  398B|   0     0 |  54    87
system 中的int是被打断的次数
csw 是上下文切换
dstat -ma 可以看到很多信息
看到磁盘,cpu等
[root@xiaoyang ~] dstat -ma
------memory-usage----- ----total-cpu-usage---- -dsk/total- -net/total- ---paging-- ---system--
 used  buff  cach  free|usr sys idl wai hiq siq| read  writ| recv  send|  in   out | int   csw
 252M    0  45.9M 3473M|  0   0 100   0   0   0|  13k 1481B|   0     0 |   0     0 |  59   103
 252M    0  45.9M 3473M|  0   0 100   0   0   0|   0     0 |  60B 1034B|   0     0 |  59    96
 252M    0  45.9M 3473M|  0   0 100   0   0   0|   0     0 |  60B  418B|   0     0 |  55    91
 252M    0  45.9M 3473M|  0   0 100   0   0   0|   0     0 |  60B  418B|   0     0 |  72   105
 252M    0  45.9M 3473M|  0   0 100   0   0   0|   0     0 |  60B  418B|   0     0 |  68    97
找出消耗CPU最多的十个进程,还有内存
两种方法 一种是 top —-》P(cpu)
M—->(内存)
第二种:
ps aux|more
[root@xiaoyang ~]# ps aux|more
USER        PID %CPU %MEM    VSZ   RSS TTY      STAT START   TIME COMMAND
root          1  0.0  0.1 125384  3896 ?        Ss   16:44   0:01 /usr/lib/systemd/systemd --switched-root --system --deserialize
 22
root          2  0.0  0.0      0     0 ?        S    16:44   0:00 [kthreadd]
root          4  0.0  0.0      0     0 ?        S<   16:44   0:00 [kworker/0:0H]
root          5  0.0  0.0      0     0 ?        S    16:44   0:00 [kworker/u256:0]
root          6  0.0  0.0      0     0 ?        S    16:44   0:00 [ksoftirqd/0]
root          7  0.0  0.0      0     0 ?        S    16:44   0:00 [migration/0]
root          8  0.0  0.0      0     0 ?        S    16:44   0:00 [rcu_bh]
root          9  0.0  0.0      0     0 ?        S    16:44   0:00 [rcu_sched]
root         10  0.0  0.0      0     0 ?        S<   16:44   0:00 [lru-add-drain]
root         11  0.0  0.0      0     0 ?        S    16:44   0:00 [watchdog/0]
root         12  0.0  0.0      0     0 ?        S    16:44   0:00 [watchdog/1]
root         13  0.0  0.0      0     0 ?        S    16:44   0:00 [migration/1]
root         14  0.0  0.0      0     0 ?        S    16:44   0:00 [ksoftirqd/1]
root         16  0.0  0.0      0     0 ?        S<   16:44   0:00 [kworker/1:0H]
root         18  0.0  0.0      0     0 ?        S    16:44   0:00 [kdevtmpfs]
root         19  0.0  0.0      0     0 ?        S<   16:44   0:00 [netns]
root         20  0.0  0.0      0     0 ?        S    16:44   0:00 [khungtaskd]
root         21  0.0  0.0      0     0 ?        S<   16:44   0:00 [writeback]
root         22  0.0  0.0      0     0 ?        S<   16:44   0:00 [kintegrityd]
root         23  0.0  0.0      0     0 ?        S<   16:44   0:00 [bioset]
root         24  0.0  0.0      0     0 ?        S<   16:44   0:00 [bioset]
root         25  0.0  0.0      0     0 ?        S<   16:44   0:00 [bioset]
root         26  0.0  0.0      0     0 ?        S<   16:44   0:00 [kblockd]
root         27  0.0  0.0      0     0 ?        S<   16:44   0:00 [md]
root         28  0.0  0.0      0     0 ?        S<   16:44   0:00 [edac-poller]
[root@xiaoyang ~]#
[root@xiaoyang ~] ps aux|tail -n +2|sort -k3 -rn|head
root        675  0.1  0.1 273192  4884 ?        Ssl  16:44   0:16 /usr/bin/vmtoolsd
root        980  0.0  0.1 222740  4644 ?        Ssl  16:44   0:01 /usr/sbin/rsyslogd -n
root        977  0.0  0.5 574284 19468 ?        Ssl  16:44   0:02 /usr/bin/python2 -Es /usr/sbin/tuned -l -P
root        976  0.0  0.1 112900  4344 ?        Ss   16:44   0:00 /usr/sbin/sshd -D
root          9  0.0  0.0      0     0 ?        S    16:44   0:00 [rcu_sched]
root          8  0.0  0.0      0     0 ?        S    16:44   0:00 [rcu_bh]
root        783  0.0  0.1 102904  5540 ?        S    16:44   0:00 /sbin/dhclient -d -q -sf /usr/libexec/nm-dhcp-helper -pf /var/run/dhclient-ens33.pid -lf /var/lib/NetworkManager/dhclient-9cabfa34-d47b-4024-85ee-2ed52a00621c-ens33.lease -cf /var/lib/NetworkManager/dhclient-ens33.conf ens33
root        704  0.0  0.0  99208  2708 ?        Ss   16:44   0:00 login -- root
root        701  0.0  0.0 126388  1628 ?        Ss   16:44   0:00 /usr/sbin/crond -n
root          7  0.0  0.0      0     0 ?        S    16:44   0:00 [migration/0]
[root@xiaoyang ~]# ps aux|tail -n +2|sort -k3 -rn|head |awk '{print $11,$3}'
/usr/bin/vmtoolsd 0.1
/usr/sbin/rsyslogd 0.0
/usr/bin/python2 0.0
/usr/sbin/sshd 0.0
[rcu_sched] 0.0
[rcu_bh] 0.0
/sbin/dhclient 0.0
login 0.0
/usr/sbin/crond 0.0
[migration/0] 0.0


cpu 使用率100% 内存使用率100% 有什么后果?
卡顿
业务程序异常: 老用户卡顿,新用户连接不进来
网络
端口扫描工具
[root@xiaoyang ~]# yum install nc nmap fping telnet -y
先一件安装
nc
[root@xiaoyang ~]# nc -z 8.219.110.232 22 不传输数据给对方
-z Zero-I/O mode, report connection status only 报告一下能不能连上
然后看 echo $? 看返回值
-w, --wait
[root@xiaoyang ~] nc -z -w 1  8.219.110.232 2233
[root@xiaoyang ~] echo $?
1
[root@xiaoyang ~]#
也可以测百度
nc -z -w 1 www.baidu.com 80
echo $?
nmap
[root@xiaoyang lianxi] nmap 192.168.209.143

Starting Nmap 6.40 ( http://nmap.org ) at 2023-05-08 22:41 CST
Nmap scan report for 192.168.209.143
Host is up (0.0000030s latency).
Not shown: 999 closed ports
PORT   STATE SERVICE
22/tcp open  ssh

Nmap done: 1 IP address (1 host up) scanned in 2.03 seconds
[root@xiaoyang lianxi]#
fping
可以探测,一个网段里哪些ip在使用,哪些没有使用
[root@xiaoyang lianxi] fping -g 192.168.209.0/24
curl
[root@xiaoyang lianxi] curl www.baidu.com
telnet
[root@xiaoyang lianxi] telnet www.baidu.com 80
Trying 14.119.104.254...
Connected to www.baidu.com.
Escape character is '^]'.
^Cq^C^C
Connection closed by foreign host.
[root@xiaoyang lianxi]#
看别人端口
nc
nmap
telent
看自己端口
netstat
lsof
ss
网络流量
ethtool 查看本机网卡和其他设备匹配的速度
ethtool ens33
dstat—》显示 CPU 使用率、内存使用率、磁盘 I/O、网络流量
dstat 是一个命令行工具,用于监测系统性能和资源使用情况。它可以显示 CPU 使用率、内存使用率、磁盘 I/O、网络流量等信息。dstat 可以帮助系统管理员快速定位系统性能瓶颈和资源瓶颈,从而优化系统性能。
dstat -ma
-N 可以指定看哪个端口
dstat -N ens33 22
iftop—》用于监控网络流量和带宽使用情况
iftop是一种网络监控工具,可用于监控网络流量和带宽使用情况。它以实时方式显示网络接口的传输情况,可以帮助用户快速识别网络瓶颈和异常流量。iftop可以在Linux、Unix和macOS等操作系统上运行。
yum install iftop -y
[root@xiaoyang lianxi] iftop
interface: ens33
IP address is: 192.168.209.143
MAC address is: 00:0c:29:9f:59:8a
[root@xiaoyang lianxi]#
glances—》监控CPU、内存、磁盘、网络、进程
glances是一种跨平台的实时系统和资源监控工具,它可以用于监控CPU、内存、磁盘、网络、进程等系统资源的使用情况。glances可以在终端中使用,也可以通过web界面进行监控。它支持多种操作系统,包括Linux、Windows、macOS等。
yum install glances -y
[root@xiaoyang lianxi]# glances
nethogs—>监控网络流量
nethogs 是一款 Linux 上的命令行工具,用于监控网络流量,可以实时显示每个进程的网络带宽使用情况。它可以按照进程、用户、协议等进行过滤和排序,帮助用户了解系统中哪些进程在占用网络带宽,以及它们占用的带宽情况。
yum install nethogs -y
sz,rz—》发送和传输文件
sz是发送文件到windows
rz是接收文件
[root@xiaoyang lianxi] rz

[root@xiaoyang lianxi] ls
1.txt           hehaotian.txt         lu           monitor.sh   taohuadao
2.txt           hehaotian.txt,bak     lu2          name.txt     test_big_file2.txt
3-7             hehaotian.txt.bakkup  lu3          nginx.log    test_big_file.txt
big_file.sh     hehaotian.txt=SUFFIX  lu4          nohup.out    user_pwd.txt
bill.txt        hengshan              lu8          passwd       web.txt
create_user.sh  honghuamiji           lu.c         sc.txt       wulin
gaohui.sh       ifcfg-ens33           mail.txt     sshd_config  啦啦啦(1).txt
gaohui.txt      ip.txt                monitor.log  state.txt
[root@xiaoyang lianxi] sz monitor.sh
[root@xiaoyang lianxi]#
一些问题
网络的速度由哪些地方可以决定
每条链路上最大的带宽
交换机和路由器可以限速的
防火墙都可以限速
1.硬件本身的速度
2,是否限制
如果知道本机开放了哪些端口
直接输入ss
ss -anplut
ss -an
netstat -anplut
[root@xiaoyang ~] netstat -anplut
Active Internet connections (servers and established)
Proto Recv-Q Send-Q Local Address           Foreign Address         State       PID/Program name
tcp        0      0 0.0.0.0:22              0.0.0.0:*               LISTEN      976/sshd
tcp        0      0 127.0.0.1:25            0.0.0.0:*               LISTEN      1212/master
tcp        0     36 192.168.209.143:22      192.168.209.1:53099     ESTABLISHED 2004/sshd: root@pts
tcp        0      0 192.168.209.143:22      192.168.209.1:53097     ESTABLISHED 1985/sshd: root@pts
tcp6       0      0 :::22                   :::*                    LISTEN      976/sshd
tcp6       0      0 ::1:25                  :::*                    LISTEN      1212/master
udp        0      0 0.0.0.0:68              0.0.0.0:*                           783/dhclient
udp        0      0 127.0.0.1:323           0.0.0.0:*                           686/chronyd
udp6       0      0 ::1:323                 :::*                                686/chronyd
[root@xiaoyang ~]#
没有的话就安装一下 net-tools
lsof命令
[root@xiaoyang ~] lsof -i:22
COMMAND  PID USER   FD   TYPE DEVICE SIZE/OFF NODE NAME
sshd     976 root    3u  IPv4  20857      0t0  TCP *:ssh (LISTEN)
sshd     976 root    4u  IPv6  20859      0t0  TCP *:ssh (LISTEN)
sshd    1985 root    3u  IPv4  33978      0t0  TCP xiaoyang:ssh->192.168.209.1:53097 (ESTABLISHED)
sshd    2004 root    3u  IPv4  34028      0t0  TCP xiaoyang:ssh->192.168.209.1:53099 (ESTABLISHED)
[root@xiaoyang ~]# lsof -p 884
看哪些进程访问这个文件
[root@xiaoyang ~] lsof /root
COMMAND  PID USER   FD   TYPE DEVICE SIZE/OFF     NODE NAME
bash    1443 root  cwd    DIR  253,0     4096 33574977 /root
bash    1987 root  cwd    DIR  253,0     4096 33574977 /root
bash    2006 root  cwd    DIR  253,0     4096 33574977 /root
lsof    2387 root  cwd    DIR  253,0     4096 33574977 /root
lsof    2388 root  cwd    DIR  253,0     4096 33574977 /root
[root@xiaoyang ~]#
通过端口看某个服务是否运行
查看监听状态:
[root@xiaoyang ~] netstat -anplut|grep LISTEN
tcp        0      0 0.0.0.0:22              0.0.0.0:*               LISTEN      976/sshd
tcp        0      0 127.0.0.1:25            0.0.0.0:*               LISTEN      1212/master
tcp6       0      0 :::22                   :::*                    LISTEN      976/sshd
tcp6       0      0 ::1:25                  :::*                    LISTEN      1212/master
[root@xiaoyang ~]#
怎么看交换机的每个口的网络流量,路由器
使用监控软件
zabbix
Prometheus
需要在路由器和交换机开启 snmp协议 简单网络管理协议
ethtool ens33
怎么知道自己的网卡是百兆还是千兆
Speed: 1000Mb/s
ethtool ens33
[root@xiaoyang ~] ethtool ens33
Settings for ens33:
	Supported ports: [ TP ]
	Supported link modes:   10baseT/Half 10baseT/Full
	                        100baseT/Half 100baseT/Full
	                        1000baseT/Full
	Supported pause frame use: No
	Supports auto-negotiation: Yes
	Supported FEC modes: Not reported
	Advertised link modes:  10baseT/Half 10baseT/Full
	                        100baseT/Half 100baseT/Full
	                        1000baseT/Full
	Advertised pause frame use: No
	Advertised auto-negotiation: Yes
	Advertised FEC modes: Not reported
	Speed: 1000Mb/s
	Duplex: Full
	Port: Twisted Pair
	PHYAD: 0
	Transceiver: internal
	Auto-negotiation: on
	MDI-X: off (auto)
	Supports Wake-on: d
	Wake-on: d
	Current message level: 0x00000007 (7)
			       drv probe link
	Link detected: yes
磁盘
读写速度 IO速度 input 和 output
tps
iops
sar
sar命令是系统性能分析工具,用于收集系统的各种性能数据,如CPU使用率、内存使用情况、磁盘I/O、网络流量等,并将这些数据以指定的时间间隔进行记录和统计,以便用户能够更好地了解系统的性能状况,从而进行系统性能优化。
[root@xiaoyang lianxi] sar -d 1 3
Linux 3.10.0-1160.el7.x86_64 (xiaoyang) 	2023年05月08日 	_x86_64_	(2 CPU)

23时05分59秒       DEV       tps  rd_sec/s  wr_sec/s  avgrq-sz  avgqu-sz     await     svctm     %util
23时06分00秒   dev11-0      0.00      0.00      0.00      0.00      0.00      0.00      0.00      0.00
23时06分00秒    dev8-0    179.00      0.00 171960.00    960.67      0.08      0.46      0.44      7.90
23时06分00秒  dev253-0    179.00      0.00 171960.00    960.67      0.08      0.46      0.44      7.90
23时06分00秒  dev253-1      0.00      0.00      0.00      0.00      0.00      0.00      0.00      0.00

23时06分00秒       DEV       tps  rd_sec/s  wr_sec/s  avgrq-sz  avgqu-sz     await     svctm     %util
23时06分01秒   dev11-0      0.00      0.00      0.00      0.00      0.00      0.00      0.00      0.00
23时06分01秒    dev8-0      0.00      0.00      0.00      0.00      0.00      0.00      0.00      0.00
23时06分01秒  dev253-0      0.00      0.00      0.00      0.00      0.00      0.00      0.00      0.00
23时06分01秒  dev253-1      0.00      0.00      0.00      0.00      0.00      0.00      0.00      0.00

23时06分01秒       DEV       tps  rd_sec/s  wr_sec/s  avgrq-sz  avgqu-sz     await     svctm     %util
23时06分02秒   dev11-0      0.00      0.00      0.00      0.00      0.00      0.00      0.00      0.00
23时06分02秒    dev8-0      0.00      0.00      0.00      0.00      0.00      0.00      0.00      0.00
23时06分02秒  dev253-0      0.00      0.00      0.00      0.00      0.00      0.00      0.00      0.00
23时06分02秒  dev253-1      0.00      0.00      0.00      0.00      0.00      0.00      0.00      0.00

平均时间:       DEV       tps  rd_sec/s  wr_sec/s  avgrq-sz  avgqu-sz     await     svctm     %util
平均时间:   dev11-0      0.00      0.00      0.00      0.00      0.00      0.00      0.00      0.00
平均时间:    dev8-0     59.67      0.00  57320.00    960.67      0.03      0.46      0.44      2.63
平均时间:  dev253-0     59.67      0.00  57320.00    960.67      0.03      0.46      0.44      2.63
平均时间:  dev253-1      0.00      0.00      0.00      0.00      0.00      0.00      0.00      0.00
[root@xiaoyang lianxi]#
tps是 每秒钟传输的次数
%util 繁忙度 越高,表示这块磁盘越忙
tps 每秒钟读写的速度
100%的时候,机器卡顿
iostat—》查看磁盘io的读写速度和繁忙度
iostat -x 查看磁盘io的读写速度和繁忙度
[root@xiaoyang lianxi] iostat -x
Linux 3.10.0-1160.el7.x86_64 (xiaoyang) 	2023年05月08日 	_x86_64_	(2 CPU)

avg-cpu:  %user   %nice %system %iowait  %steal   %idle
           0.01    0.00    0.07    0.00    0.00   99.92

Device:         rrqm/s   wrqm/s     r/s     w/s    rkB/s    wkB/s avgrq-sz avgqu-sz   await r_await w_await  svctm  %util
scd0              0.00     0.00    0.00    0.00     0.04     0.00   114.22     0.00    1.39    1.39    0.00   0.94   0.00
sda               0.00     0.02    0.40    0.23    14.80     8.29    72.66     0.00    0.47    0.48    0.46   0.27   0.02
dm-0              0.00     0.00    0.31    0.25    13.41     8.20    77.18     0.00    0.54    0.60    0.48   0.29   0.02
dm-1              0.00     0.00    0.00    0.00     0.09     0.00    50.09     0.00    0.14    0.14    0.00   0.09   0.00

[root@xiaoyang lianxi]#
看磁盘空间的使用情况,df -Th
[root@xiaoyang ~] dd if=/dev/zero of=/test.dd bs=1M count=1000
记录了1000+0 的读入
记录了1000+0 的写出
1048576000字节(1.0 GB)已复制,0.44042 秒,2.4 GB/秒
[root@xiaoyang ~] df -Th
文件系统                类型      容量  已用  可用 已用% 挂载点
devtmpfs                devtmpfs  1.9G     0  1.9G    0% /dev
tmpfs                   tmpfs     1.9G     0  1.9G    0% /dev/shm
tmpfs                   tmpfs     1.9G   12M  1.9G    1% /run
tmpfs                   tmpfs     1.9G     0  1.9G    0% /sys/fs/cgroup
/dev/mapper/centos-root xfs        17G  4.8G   13G   28% /
/dev/sda1               xfs      1014M  151M  864M   15% /boot
tmpfs                   tmpfs     378M     0  378M    0% /run/user/0
[root@xiaoyang ~]# ^C
[root@xiaoyang ~] rm -rf test.dd   删除产生的零时大文件
[root@xiaoyang ~] df -Th
文件系统                类型      容量  已用  可用 已用% 挂载点
devtmpfs                devtmpfs  1.9G     0  1.9G    0% /dev
tmpfs                   tmpfs     1.9G     0  1.9G    0% /dev/shm
tmpfs                   tmpfs     1.9G   12M  1.9G    1% /run
tmpfs                   tmpfs     1.9G     0  1.9G    0% /sys/fs/cgroup
/dev/mapper/centos-root xfs        17G  4.8G   13G   28% /
/dev/sda1               xfs      1014M  151M  864M   15% /boot
tmpfs                   tmpfs     378M     0  378M    0% /run/user/0
[root@xiaoyang ~]#
lsblk —>能看到磁盘多大
只能看到磁盘多大
df -Th -->查看磁盘容量
查看磁盘容量
iotop ---->看到哪个进程在大量的对磁盘进程读写
可以看到哪个进程在大量的对磁盘进程读写
总结一下
cpu
内存
网络带宽
磁盘容量和IO(tps/iops)
tps是什么?
每秒钟访问的速度(读,写)
%util 是什么?
繁忙度
用户访问我们的服务器特别慢,请你分析一下原因,如何去排查?
如果他访问第三方,快的话,那就是我们的问题
看cpu
看内存
看带宽
看IO读写空间和容量
用哪个命令一次性看到 —>glances
如果都正常,那就是负载均衡器或者运营商的问题
查看端口号
使用命令" netstat -tunlp " 可以查看当前所有端口的使用情况及对应的进程。其中,“-t” 表示TCP协议,“-u” 表示UDP协议,“-n” 表示不使用域名解析,“-l” 表示只列出监听的端口,“-p” 表示显示进程名和进程ID。