Tsar简介
Tsar是淘宝自己开发的一个采集工具,主要用来收集服务器的系统信息(如cpu,io,mem,tcp等),以及应用数据(如squid haproxy nginx等)。
收集到的数据存储在磁盘上,可以随时查询历史信息,输出方式灵活多样,另外支持将数据存储到mysql中,也可以将数据发送到nagios报警服务器。
Tsar在展示数据时,可以指定模块,并且可以对多条信息的数据进行merge输出,带—live参数可以输出秒级的实时信息。
Tsar能够比较方便的增加模块,只需要按照tsar的要求编写数据的采集函数和展现函数,就可以把自定义的模块加入到Tsar中。
总体架构
Tsar是基于模块化设计的程序,程序有两部分组成:框架和模块。
框架程序源代码主要在src目录,而模块源代码主要在modules目录中。
框架提供对配置文件的解析,模块的加载,命令行参数的解析,应用模块的接口对模块原始数据的解析与输出。 模块提供接口给框架调用。
Tsar依赖与cron每分钟执行采集数据,因此它需要系统安装并启用crond,安装后,tsar每分钟会执行
tsar --cron来定时采集信息,并且记录到原始日志文件。
Tsar的运行流程图
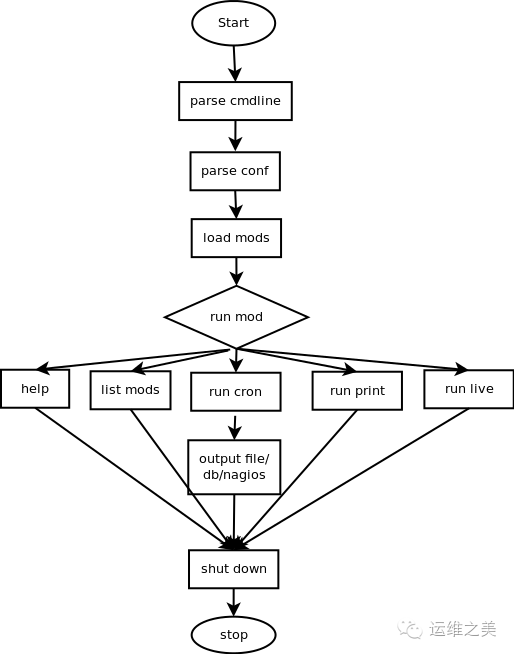
主要执行流程

1.解析输入
根据用户的输入,初始化一些全局信息,如间隔时间,是否merge,是否指定模块,运行模式2.读取配置文件信息
主要解析tsar的配置文件,如果include生效,则会解析include的配置文件
配置文件用来获得tsar需要加载的模块,输出方式,每一类输出方式包含的模块,和此输出方式的接收信息
如mod_cpu on代表采集cpu的信息
output_interface file,nagios表示向文件和nagios服务器发送采集信息和报警信息3.加载相应模块
根据配置文件的模块开启关闭情况,将模块的动态库load到系统4.tsar的三种运行模式
tsar在运行的时候有三种模式:
print模式仅仅输出指定的模块信息,默认显示最近一天的;
live模式是输出当前信息,可以精确到秒级
cron模式,此一般是crontab定时执行,每一分钟采集一次所有配置的模块信息,并将数据写入原始文件,在cron运行的时候 会判断是否配置输出到db或者nagios,如果配置则将相应格式的数据输出到对应接口。5.释放资源
程序最后,释放动态库,程序结束
项目地址: https://github.com/alibaba/tsar
Tsar安装
从github上检出代码
$ git clone git://github.com/alibaba/tsar.git
$ cd tsar
$ make
$ make install
从github上下载源码
$ wget -O tsar.zip https://github.com/alibaba/tsar/archive/master.zip --no-check-certificate
$ unzip tsar.zip
$ cd tsar
$ make
$ make install
安装后生成的文件
Tsar配置文件路径:/etc/tsar/tsar.conf,tsar的采集模块和输出的具体配置;
定时任务配置:/etc/cron.d/tsar,负责每分钟调用tsar执行采集任务;
日志文件轮转配置:/etc/logrotate.d/tsar,每个月会把tsar的本地存储进行轮转;
模块路径:/usr/local/tsar/modules,各个模块的动态库so文件;
Tsar配置
Tsar配置文件介绍
定时任务配置
$ cat  /etc/cron.d/tsar
# cron tsar collect once per minute
MAILTO=""
* * * * * root /usr/bin/tsar --cron > /dev/null 2>&1
如上所示,/etc/cron.d/tsar里面负责每分钟以root用户的角色调用tsar命令来执行数据采集。
日志文件轮转
$ cat /etc/logrotate.d/tsar
/var/log/tsar.data
{
monthly
rotate 120
create
nocompress
nodateext
notifempty
prerotate
/usr/bin/chattr -a /var/log/tsar.data
endscript
postrotate
/usr/bin/chattr +a /var/log/tsar.data
endscript
}
在日志文件轮转配置中,每个月会把tsar的本地存储进行轮转,此外这里也设定了数据在/var/log/tsar.data下
配置文件
/etc/tsar/tsar.conf负责tsar的采集模块和输出的具体配置;在这里配置启用哪些模块,输出等内容。
$ cat /etc/tsar/tsar.conf
####debug_level(INFO DEBUG WARN ERROR FATAL)
debug_level ERROR
####[module]
mod_cpu on
mod_mem on
mod_swap on
mod_tcp on
mod_udp on
mod_traffic on
mod_io on
mod_pcsw on
mod_partition on
mod_tcpx on
mod_load on
mod_apache off
mod_lvs off
mod_haproxy off
mod_squid off
mod_nginx off
mod_nginx_multiport off
mod_nginx_live off
#mod_nginx_sys_mport on 80 8080
mod_swift off
mod_swift_code off
mod_swift_domain off
mod_swift_esi off
mod_swift_fwd off
mod_swift_store off
mod_swift_swapdir off
mod_swift_purge off
mod_swift_sys off
mod_swift_tcmalloc off
mod_tmd off
mod_percpu off
mod_tcprt off
mod_proc off pidname
mod_pharos off
mod_tmd4 off
mod_keyserver off
#mod_erpc on /etc/tsar/erpc.conf
#mod_search on

####output_interface file,db,nagios
output_interface file

####[output_file] original data to store
output_file_path /var/log/tsar.data

####[output_stdio] these mod will be show as using tsar command
output_stdio_mod mod_swap,mod_partition,mod_cpu,mod_mem,mod_lvs,mod_haproxy,mod_traffic,mod_squid,mod_load,mod_tcp,mod_udp,mod_tcpx,mod_apache,mod_pcsw,mod_io,mod_percpu

####[output_db]
#output_db_mod mod_swap,mod_partition,mod_cpu,mod_mem,mod_traffic,mod_load,mod_tcp,mod_udp,mod_pcsw,mod_io
#output_db_addr console2:56677

####[output_tcp]
#output_tcp_mod mod_swap,mod_cpu
#output_tcp_addr localhost:9666
#output_tcp_merge on

####support include other mod conf
include /etc/tsar/conf.d/*.conf

####The IP address or the host running the NSCA daemon
#server_addr nagios.server.com
####The port on which the daemon is running - default is 5667
#server_port 8086
####The cycle of send alert to nagios
#cycle_time 300
####nsca client program
#send_nsca_cmd /usr/bin/send_nsca
#send_nsca_conf /home/a/conf/amon/send_nsca.conf

####tsar mod alert config file
####threshold servicename.key;w-min;w-max;c-min;cmax;
#threshold cpu.util;N;N;N;N;
常用参数说明
debug_level 指定tsar的运行级别,主要用来调试使用
mod_xxx on/off 开启指定模块
out_interface 设置输出类型,支持file,nagios,db
out_stdio_mod 设置用户终端默认显示的模块
output_db_mod 设置哪些模块输出到数据库
output_db_addr 数据库的ip和端口
output_nagios_mod 设置哪些模块输出到nagios
include 支持include配置,主要用来加载用户的自定义模块
cycle_time 指定上报的间隔时间,由于tsar每一分钟采集一次,上报时会判断是否符合时间间隔,如设置300的话,则在0,5等整点分钟会上报nagios
threshold 设置某个要报警项的阀值,前面是模块和要监控的具体名称,后面的四个数据代表报警的范围,warn和critical的范围
自定义模块配置文件
/etc/tsar/conf.d/这个目录下是用户的自定义模块配置文件,配置基本在用户开发自定义模块时确定,主要包含模块的开启,输出类型和报警范围
Tsar使用介绍
在Tsar的使用中,可以参考下面的帮助信息,完成对应的监控。
$ tsar -h
Usage: tsar [options]
Options:
    -check         查看最后一次的采集数据
    --check/-C     查看最后一次tsar的提醒信息,如:tsar --check / tsar --check --cpu --io
    --cron/-c      使用crond模式来进行tsar监控
    --interval/-i  指明tsar的间隔时间,默认单位分钟,默认显示间隔5分钟;带上--live参数则单位是秒,默认是5秒。
    --list/-L      列出启用的模块
    --live/-l      启用实时模式,类似iostat等,可以配合-i参数和模块参数使用。
    --file/-f      指定输入文件
    --ndays/-n     控制显示多长时间的历史数据,默认1天
    --date/-d      指定日期,YYYYMMDD或者n代表n天前
    --detail/-D    能够指定查看主要字段还是模块的所有字段
    --spec/-s      指定字段,tsar –cpu -s sys,util
    --watch/-w     显示最后多少分钟的记录. 如:tsar --watch 30 / tsar --watch 30 --cpu --io
    --merge/-m     对有多个数据的展示,进行汇总,如机器上跑了3个squid,可以用 tsar –squid -m的放式进行展示汇总。
    --item/-I      显示指定项目数据, 如:tsar --io -I sda
    -–help/-h      显示提示信息和模块信息
Modules Enabled:
    --cpu          列出cpu相关的监控计数
    --mem          物理内存的使用情况
    --swap         虚拟内存的使用情况
    --tcp          TCP协议IPV4的使用情况
    --udp          UDP协议IPV4的使用情况
    --traffic      网络传出的使用情况
    --io           Linux IO的情况
    --pcsw         进程和上下文切换
    --partition    磁盘使用情况
    --tcpx         TCP连接相关的数据参数
    --load         系统负载情况
tsar命令行主要担负显示历史数据和实时数据的功能,因此有控制展示模块和格式化输出的参数,默认不带任何参数/选项的情况下,tsar打印汇总信息。
tsar命令行主要显示给人看的,所以数据展示中都进行了k/m/g等的进位。
tsar命令会在显示20行数据后再次打印各个列的列头,以利于用户理解数据的含义。
tsar的列头信息包括2行,第一行为模块名,第二行为列名。
tsar输出最后会作min/avg/max的汇总统计,统计所展示中的最小/平均/最大数据。
Tsar使用实例
Tsar监控系统
查看可用的模块列表
$ tsar -L
tsar enable follow modules:
    cpu
    mem
    swap
    tcp
    udp
    traffic
    io
    pcsw
    partition
    tcpx
    load
查看指定模块的运行状况,模块是指tsar -L列出来的名称。如查看CPU运行情况
$ tsar --cpu
Time           -----------------------cpu----------------------
Time             user     sys    wait    hirq    sirq    util
18/05/16-09:20   0.03    0.08    0.01    0.00    0.02    0.12
18/05/16-09:25   0.00    0.02    0.00    0.00    0.01    0.04
18/05/16-09:30   0.00    0.02    0.00    0.00    0.02    0.05
查看实时数据
$ tsar -l
Time              ---cpu-- ---mem-- ---tcp-- -----traffic---- --sda--- --dm-0-- --dm-1-- --dm-2--  ---load-
Time                util     util   retran    bytin  bytout     util     util     util     util     load1
18/05/16-11:27:47   0.05    33.16     0.00    24.00   74.00     0.04     0.04     0.00     0.00      0.00
18/05/16-11:27:52   0.05    33.15     0.00    30.00   52.00     0.06     0.06     0.00     0.00      0.00
以1秒钟为间隔,实时打印tsar的概述数据
$ tsar -i 1 -l
Time              ---cpu-- ---mem-- ---tcp-- -----traffic---- --sda--- --dm-0-- --dm-1-- --dm-2--  ---load-
Time                util     util   retran    bytin  bytout     util     util     util     util     load1
18/05/16-10:17:17   0.25    33.13     0.00    60.00  314.00     0.00     0.00     0.00     0.00      0.00
18/05/16-10:17:18   0.00    33.13     0.00    60.00  202.00     0.50     0.50     0.00     0.00      0.00
tsar cpu监控
使用参数-–cpu可以监控系统的cpu,参数user表示用户空间cpu, sys内核空间cpu使用情况,wait是IO对应的cpu使用情况,hirq,sirq分别是硬件中断,软件中断的使用情况,util是系统使用cpu的总计情况。
$ tsar  --cpu
Time           -----------------------cpu----------------------
Time             user     sys    wait    hirq    sirq    util
18/05/16-09:20   0.03    0.08    0.01    0.00    0.02    0.12
18/05/16-09:25   0.00    0.02    0.00    0.00    0.01    0.04
显示一天内的cpu和内存历史数据,以1分钟为间隔
$ tsar --cpu --mem -i 1
Time           -----------------------cpu---------------------- -----------------------mem----------------------
Time             user     sys    wait    hirq    sirq    util     free    used    buff    cach   total    util
18/05/16-09:14   0.00    0.02    0.00    0.00    0.01    0.04     1.2G  456.9M   35.9M   95.8M    1.8G   24.54
18/05/16-09:15   0.01    0.02    0.00    0.00    0.02    0.05     1.2G  456.9M   35.9M   95.8M    1.8G   24.53
显示一天内cpu的历史信息,以1分钟为间隔
$ tsar --cpu -i 1
Time           -----------------------cpu---------------------- -----------------------mem----------------------
Time             user     sys    wait    hirq    sirq    util     free    used    buff    cach   total    util
18/05/16-09:14   0.00    0.02    0.00    0.00    0.01    0.04     1.2G  456.9M   35.9M   95.8M    1.8G   24.54
18/05/16-09:15   0.01    0.02    0.00    0.00    0.02    0.05     1.2G  456.9M   35.9M   95.8M    1.8G   24.53
tsar监控虚拟内存和load情况
$ tsar  --swap --load
Time           ---------------swap------------- -------------------load-----------------
Time            swpin  swpout   total    util    load1   load5  load15    runq    plit
18/05/16-09:20   0.00    0.00    1.9G    0.00     0.00    0.00    0.00    0.00  147.00
18/05/16-09:25   0.00    0.00    1.9G    0.00     0.00    0.00    0.00    0.00  147.00
以2秒钟为间隔,实时打印mem的数据
$ tsar --live --mem -i 2
Time              -----------------------mem----------------------
Time                free    used    buff    cach   total    util
18/05/16-11:30:59 905.8M  617.2M  219.4M  119.8M    1.8G   33.14
18/05/16-11:31:01 904.9M  618.1M  219.4M  119.8M    1.8G   33.19
tsar监控io使用情况
$ tsar --io
Time           ------------------------------------------sda-------------------------------------------
Time            rrqms   wrqms      rs      ws   rsecs   wsecs  rqsize  qusize   await   svctm    util
18/08/16-21:25   0.28    3.4K  184.40  389.25    4.9K   15.0K   35.47    3.00    6.35    0.29   16.44
18/08/16-21:30   0.00    3.2K  109.71  382.74    2.5K   14.5K   35.27    3.00    7.33    0.30   14.68
tsar监控网络监控统计
$ tsar  --traffic
Time           ---------------------traffic--------------------
Time            bytin  bytout   pktin  pktout  pkterr  pktdrp
18/05/16-09:20  42.00   33.00    0.00    0.00    0.00    0.00
18/05/16-09:25  12.00    2.00    0.00    0.00    0.00    0.00
$ tsar --tcp --udp -d 1
Time           -------------------------------tcp------------------------------ ---------------udp--------------
Time           active  pasive    iseg  outseg  EstRes  AtmpFa  CurrEs  retran     idgm    odgm  noport  idmerr
18/05/16-00:05   0.79    1.52    1.6K    2.1K    0.00    0.03    3.4K    0.02     0.00    2.00    0.00    0.00
18/05/16-00:10   0.73    1.40  884.25  921.56    0.00    0.03    3.4K    0.01     0.00    3.00    0.00    0.00
tsar检查告警信息
查看最后一次tsar的提醒信息,这里包括了系统的cpu,io的告警情况。
$ tsar --check --cpu --io
localhost.localdomain       tsar    cpu:user=25.0 cpu:sys=2.1 cpu:wait=0.1 cpu:hirq=0.0 cpu:sirq=0.2 cpu:util=27.4 io:sda:rrqms=0.0 io:sda:wrqms=4172.4 io:sda:rs=80.3 io:sda:ws=493.0 io:sda:rsecs=1664.0 io:sda:wsecs=18661.7 io:sda:rqsize=35.5 io:sda:qusize=4.0 io:sda:await=7.7 io:sda:svctm=0.3 io:sda:util=18.5
tsar历史数据回溯
通过参数-d 2可以查出两天前到现在的数据,-i 1表示以每次1分钟作为采集显示。
$ tsar -d 2 -i 1
Time           ---cpu-- ---mem-- ---tcp-- -----traffic---- --sda---  ---load-
Time             util     util   retran    bytin  bytout     util     load1
15/05/16-00:02 ------    71.40     0.03   754.2K  421.4K    14.38     1.59
15/05/16-00:03  34.55    71.41     0.01   773.7K  400.9K    13.39     1.42
tsar查看指定日期的数据
$ tsar  --load  -d 20160518 #指定日期,格式YYYYMMDD
Time           -------------------load-----------------
Time            load1   load5  load15    runq    plit
18/05/16-09:20   0.00    0.00    0.00    0.00  147.00
18/05/16-09:25   0.00    0.00    0.00    0.00  147.00
tsar查看所有字段
$ tsar --mem -D
Time           -----------------------mem----------------------
Time             free    used    buff    cach   total    util
18/05/16-09:20 1333063680.00  480555008.00  38567936.00  100483072.00  1952669696.00   24.61
18/05/16-09:25 1333542912.00  479940608.00  38682624.00  100503552.00  1952669696.00   24.58
查看fstab指定挂在的系统目录的使用情况 ,-I指定查看某个目录
$ tsar --partition -I /
Time           ---------------------------/----------------------------
Time            bfree   bused   btotl    util   ifree   itotl   iutil
18/05/16-09:20  27.5G   19.1G   49.1G   42.00    2.7M    3.1M   14.71
18/05/16-09:25  27.5G   19.1G   49.1G   42.00    2.7M    3.1M   14.71
Tsar监控应用
Tsar默认支持的模块,如下
$ ls /usr/local/tsar/modules
mod_apache.so  mod_haproxy.so  mod_load.so  mod_mem.so   mod_nginx.so      mod_pcsw.so    mod_pernic.so  mod_squid.so  mod_tcp.so   mod_traffic.so
mod_cpu.so     mod_io.so       mod_lvs.so   mod_ncpu.so  mod_partition.so  mod_percpu.so  mod_proc.so    mod_swap.so   mod_tcpx.so  mod_udp.so
默认安装完后,只启用了系统相关的模块。如要监控应用就需手动启用相应模块,以Nginx为例
$ vim /etc/tsar/tsar.conf
mod_nginx on
验证Nginx模块是否启用
$ tsar -L|grep nginx
    nginx
配置Nginx
该配置主要是为nginx开启status统计页面,给tsar提供http数据。Tsar统计的原理是通过获取status页面的输出结果,并对输出内容进行统计和计算得出的结果。而且其获取状态页的url默认是http://127.0.0.1/nginx_status ,所以在nginx上你必须有如下的配置
location /nginx_status {
          stub_status on;
          access_log   off;
          allow 127.0.0.1;
          deny all;
        }
注:以上的url并非不能更改,可以修改环境变量实现。其自带的几个环境变量如下。
export NGX_TSAR_HOST=192.168.0.1
export NGX_TSAR_PORT=8080
export NGX_TSAR_SERVER_NAME=status.taobao.com
export NGX_TSAR_URI=/nginx_status
监控Nginx状态
$ tsar --nginx -l -i 2
Time              ----------------------------------------------nginx---------------------------------------------
Time              accept  handle    reqs  active    read   write    wait     qps      rt  sslqps  spdyps  sslhst
18/05/16-13:11:30   1.00    1.00    1.00    1.00    0.00    1.00    0.00    0.20    0.00    0.00    0.00    0.00
18/05/16-13:11:35   1.00    1.00    1.00    1.00    0.00    1.00    0