先在终端执行命令
vue create relationgraph
创建一个vue2的项目

然后在编辑器中打开新创建的项目
在终端中执行命令
npm install relation-graph --save
引入依赖
这样 我们relation-graph就进来了
然后 我们在需要使用的组件中编写代码如下
<template>
  <div>
    <div style="width: calc(100% - 10px);height:100vh;">
      <SeeksRelationGraph ref="seeksRelationGraph" :options="graphOptions" />
    </div>
  </div>
</template>

<script>
import SeeksRelationGraph from 'relation-graph';
export default {


  name: 'SeeksRelationGraphDemo',
  components: {

       SeeksRelationGraph },
  data() {


    return {


      graphOptions: {


        // debug: true,
        // 禁用拖拽
        disableDragNode: true,
        // backgrounImage: 'http://ai-mark.cn/images/ai-mark-desc.png',
        backgrounImageNoRepeat: true,
        layouts: [
          {


            label: '多源化',
            layoutName: 'tree',
            layoutClassName: 'seeks-layout-center',
            defaultJunctionPoint: 'border',
            defaultNodeShape: 0,
            defaultLineShape: 1,
            from: 'left',
            // 通过这4个属性来调整 tree-层级距离&节点距离
            min_per_width: '200',
            max_per_width: '500',
            // min_per_height: '40',
            // max_per_height: '60',
            // 如果此选项有值,则优先级高于上面那4个选项
            levelDistance: '',
          },
        ],
        // 箭头样式
        defaultLineMarker: {


          markerWidth: '0',
          markerHeight: '0',
          refX: '0',
          refY: '0',
        },
        defaultExpandHolderPosition: 'right',
        defaultNodeShape: 1,
        defaultNodeWidth: '100', // 节点宽度
        defaultLineShape: 4, //线条样式
        defaultJunctionPoint: 'lr',
        defaultNodeBorderWidth: 0,
        defaultLineColor: 'rgba(0, 186, 189, 1)',
        defaultNodeColor: 'rgba(0, 206, 209, 1)',
      }
    };
  },
  mounted() {


    this.setGraphData();
  },
  methods: {


    setGraphData() {


      var __graph_json_data = {


        rootId: 'N1',
        nodes: [
          {

       id: 'N1', text: '测试方案', color: '#2E4E8F' },
          {

       id: 'N15', text: '高级规划', color: '#4ea2f0' },
          {


            id: 'N16',
            color: '#4ea2f0',
            html: `<div class="A">
                    <div class="A-1">高级测试管理方案</div>
                    <div class="A-2">映射工具</div>
                  </div>`,
          },
          {


            id: 'N17',
            text: '微化文案管理',
            color: '#4ea2f0',
          },
          {

       id: 'N18', text: '初级测试文案', color: '#4ea2f0' }
        ],
        links: [
          {

       from: 'N1', to: 'N15' },
          {

       from: 'N15', to: 'N16' },
          {

       from: 'N15', to: 'N17' },
          {

       from: 'N15', to: 'N18' },
          {

       from: 'N15', to: 'N19' },
        ],
      };
      this.$refs.seeksRelationGraph.setJsonData(
        __graph_json_data,
        (seeksRGGraph) => {


          console.log(seeksRGGraph);
        }
      );
    },
  },
};
</script>

<style>
</style>
这里 首先 大家要缕清关系 我们每个节点都带有id 例如N1 N15
然后 我们设置根节点的id是N1
links梳理了元素之前的关系
N15 插入在N1 下 剩下的 N16 N17 N18 N19则插入在N15下
然后 我们可以通过
{ id: ‘唯一标识’, text: ‘内容文本’, color: ‘颜色代码’ }
也可以通过
{ id: ‘唯一标识’, html: ‘页面结构字符串’, color: ‘颜色代码’ }
来完成
最后 我们运行出来的效果是这样的
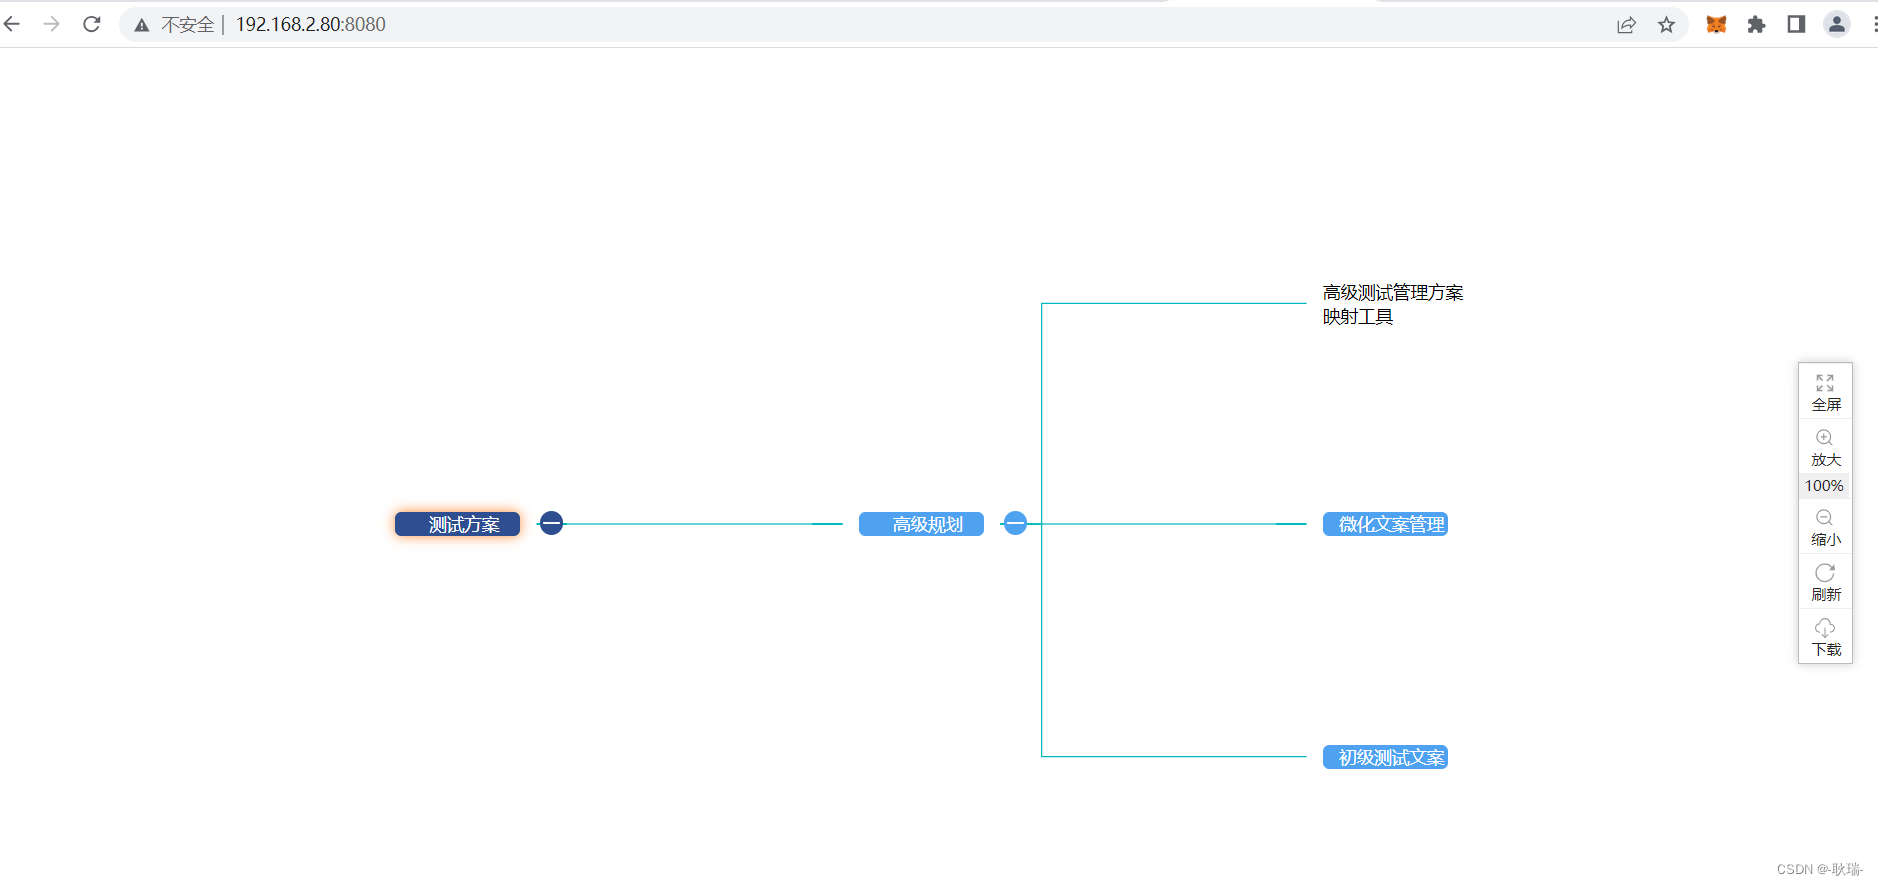
右边的操作了也都是可以用的 我们可以进行放大 缩小 甚至下载到本地
