感谢阅读
- 非原创声明,根据微软课程学习理解而已
- Get started with Microsoft 365
-
- Work Smarter with Microsoft Word
- 与 Microsoft Word 更加智能地工作
- Microsoft 365 Subscriptions
- Microsoft 365 订阅
- 个人补充
- Exercise: Finding Help and changing account settings
- 练习:查找帮助并更改账户设置
- Introduction to Word
- Word简介
- Introduction to Excel
- Excel简介
- Introduction to PowerPoint
- PPT介绍
- Introduction to Outlook
- Outlook介绍
- Exercise: Organizing files in OneDrive
- 练习:在OneDrive中组织文件
- Word
-
- Exercise: Identifying the elements of the Word interface
- Exercise: 识别Word界面的元素
- Exercise: Finding and replacing text
- 练习:查找和替换文本
- 个人补充
- Exercise: Applying character formatting
- 练习:应用字符格式化
- Exercise: Displaying text as list items
- 练习:将文本显示为列表项
- Font group commands keyboard shortcuts
- 字体组命令的键盘快捷键
- Exercise: Controlling paragraph layout
- 练习:控制段落布局
- Exercise: Applying borders and shading
- 练习:应用边框和底纹
- Exercise: Inserting a table
- 练习:插入表格
- Exercise: Sorting table data
- 练习:表格数据排序
- Exercise: Adding images to a document
- 练习:向文档添加图像
- Exercise: Adjusting image appearance
- 练习:调整图片外观
- Exercise: Creating text boxes
- 练习:创建文本框
- Exercise: Applying a page border and color
- 练习:应用页面边框和颜色
- Exercise: Inserting footnotes and endnotes
- 练习:插入脚注和尾注
- EXCEL
-
- Working with data
- 数据工作
- Formatting text
- 格式化文本
- Exercise: Formatting cells
- 练习:格式化单元格
- Exercise: Searching for and replacing data
- 练习:搜索和替换数据
- Refining the page layout and applying print options
- 完善页面布局并应用打印选项
- Exercise: Using formulas and functions
- 练习:使用公式和函数
- Exercise: Sort and filter data
- 练习:排序和筛选数据
- Exercise: Analyzing data using text functions
- 练习:使用文本函数分析数据
- Exercise: Analyzing data using logical functions
- 练习:使用逻辑函数分析数据
- Exercise: Creating and modifying a table
- 练习:创建和修改表格
- Exercise: Creating charts
- 练习:生成图表
- Exercise: Modifying and formatting charts
- 练习:修改和格式化图表
- Exercise: Apply conditional formatting
- 练习:应用条件格式化
- Exercise: Using data sources
- 练习使用数据源
- PPT
-
- Exercise: Building a presentation
- 练习:构建演示文稿
- Exercise: Laying out a presentation
- 练习:演示文稿的布局
- Exercise: Creating SmartArt
- 练习:创建智能图形
- Exercise: Grouping objects
- 练习:对象分组
- Exercise: Arranging objects
- 练习:排列对象
- Exercise: Animating objects
- 练习:为对象添加动画效果
- Exercise: Inserting a table from Microsoft Excel
- 练习:从Microsoft Excel插入表格
- Exercise: Adding hyperlinks and action buttons
- 练习:添加超链接和操作按钮
非原创声明,根据微软课程学习理解而已
本课程为翻译+难点举例,并不是完全原创,大家想看原文请进入微软认证官网点击报名后支付大约99D即可学习以及考试认证。
点我去官网
资源采用了coursera的
个人补充是对前一个知识点的个人理解
Get started with Microsoft 365
Work Smarter with Microsoft Word
Welcome to work smarter with Microsoft Word. In this course, you’ll discover the basics of Microsoft Word alongside the other apps and services available with the Microsoft 365 Cloud-based productivity tool. This course will help you to get started with basic Microsoft Word tasks and by the end of the course, you’ll be familiar with how to complete a range of complex tasks using the application. In Module 1 you’ll get started with Microsoft 365 by learning how to navigate your account, explore the basics of the most used Office 365 applications and access Microsoft 365 services. In Module 2 you’ll begin using the Microsoft Word application. As part of this module, you’ll navigate a document, use Word’s editing tools and proof a document using proofing tools. In Module 3, you’ll move on to more complex Word tasks like formatting for text and paragraphs, adding and editing tables and cells and you’ll also learn how to manage lists. Module 4 focuses on working with graphics in Microsoft Word as well as adding graphics and using images in a document, you’ll also learn how to create and format text boxes and pull quotes, use shapes in a document and enhance your documents using WordArt and complex illustrations. Module 5 looks at finalizing documents in Microsoft Word. This includes a review of accessibility features, how to set save options, controlling text flow, adding captions and references, adding hyperlinks footnotes and endnotes and slightly more complex tasks such as adding citations, a bibliography and a table of contents. In Module 6, you’ll discover how to collaborate on documents with other team members. You’ll look at how to share a document, work with comments and track changes and perform a document review. Finally in Module 7 you’ll have the opportunity to complete an optional honors assignment for special recognition. Throughout this course you’ll learn the skills and techniques required to produce high-quality professional documents. This assignment provides you with a practical opportunity to apply those skills. You don’t have to complete this assignment to obtain the course certificate, however, if you complete this and all other honors assignments, then your course certificate will include a special honors recognition. Best of luck on your journey through Microsoft Word.
与 Microsoft Word 更加智能地工作
欢迎使用 Microsoft Word 进行智能办公。在这门课程中,您将探索 Microsoft 365 云端生产力工具中的 Microsoft Word 基础知识,以及其他应用程序和服务。本课程将帮助您入门基本的 Microsoft Word 任务,并在课程结束时熟悉如何使用该应用程序完成一系列复杂的任务。在第1模块中,您将通过学习如何导航您的帐户、探索最常用的 Office 365 应用程序的基础知识以及访问 Microsoft 365 服务来开始使用 Microsoft 365。在第2模块中,您将开始使用 Microsoft Word 应用程序。作为该模块的一部分,您将学习如何导航文档、使用 Word 的编辑工具并使用校对工具校对文档。在第3模块中,您将继续进行更复杂的 Word 任务,如文本和段落格式化、添加和编辑表格和单元格,以及学习如何管理列表。第4模块着重介绍如何在 Microsoft Word 中处理图形,包括添加图形和在文档中使用图片,您还将学习如何创建和格式化文本框和引用文本,使用形状和复杂插图来增强文档。第5模块介绍如何在 Microsoft Word 中完成文档的最终定稿。包括无障碍功能的回顾、设置保存选项、控制文本流动、添加标题和引用、添加超链接、脚注和尾注,以及稍微复杂一些的任务,如添加引文、参考文献和目录。在第6模块中,您将了解如何与其他团队成员一起协作编辑文档。您将学习如何共享文档、处理评论和修订记录,并进行文档审查。最后,在第7模块中,您将有机会完成一个可选的荣誉作业,以获得特别认可。在整个课程中,您将学习到制作高质量专业文档所需的技能和技术。完成这个作业不是获得课程证书的必要条件,但如果您完成了这个作业和所有其他荣誉作业,您的课程证书将包括特别的荣誉认可。祝您在 Microsoft Word 的学习之旅中好运。
Microsoft 365 Subscriptions
As you probably already know, Microsoft 365 is a subscription based service. But there are a lot of different subscription types available. Which one you select will depend entirely upon the needs of your business. WestCal’s are eager to make use of Microsoft apps like Word, Excel and PowerPoint. So they’ve signed up for a Microsoft 365. Business basic plan with accounts for each employee. Thomas has been given his account details. He now needs to log into his new 365-account and explore the available apps. Microsoft 365 has become increasingly popular amongst organizations, both large and small. It offers a variety of different plans to best suit organizations of any size. For example, Microsoft 365 family and Microsoft 365 personal plans are best for general consumers while Microsoft 365 apps for business. Microsoft 365, business basic and Microsoft 365 business standards are aimed at small to medium sized businesses. Larger organizations can choose Microsoft 365 apps for enterprise and Office 365 E1 E3 and E5. Keep in mind that Microsoft 365 features are constantly evolving. While the features you’ll see in this course are correct. At the time of filming, they may have been updated or changed since. So what’s included in a Microsoft 365 subscription. As you’ve seen, Microsoft 365 availability depends entirely on your organization subscription. However, all Microsoft 365 business basic and Office 365 E1 subscriptions do include the essential office apps covered earlier cloud based services, management tools and other features. Assuming your organization is using the Microsoft 365 Business Standard plan, you will also have access to always up to date desktop versions of these essential office applications. Most plans also include applications for host email, web conferencing, instant messaging and one Terabyte of one drive cloud storage, along with lots more features. Now that you’re familiar with the basics of Microsoft 365, you might be asking yourself what’s required to use its services. You’ll be happy to hear that although Microsoft 365 is based in the cloud, there are only a few requirements for enjoying its full benefits. These requirements include a device running Windows 8 or Windows 10 operating systems. Internet access to install or activate Microsoft 365 and manage it. Finally and perhaps most importantly, a compatible browser is also needed. Recent or current versions of Microsoft Edge, Firefox, Safari or Google Chrome are all compatible with Microsoft 365.
Microsoft 365 订阅
正如您可能已经了解到的,Microsoft 365是一种订阅制的服务,但有许多不同的订阅类型可供选择,您的选择将完全取决于您企业的需求。WestCal公司希望使用Microsoft的应用程序,如Word、Excel和PowerPoint,因此他们注册了一个带有每个员工帐户的Microsoft 365商业基本计划。Thomas已经收到了他的帐户详细信息,现在他需要登录他的新365帐户并探索可用的应用程序。
Microsoft 365在各种组织中越来越受欢迎,无论是大型还是小型。它提供了多种不同的计划,以最好地适应各种规模的组织。例如,Microsoft 365家庭版和Microsoft 365个人版适用于一般消费者,而Microsoft 365企业版、Microsoft 365商业基本版和Microsoft 365商业标准版则针对中小型企业。较大的组织可以选择Microsoft 365企业版和Office 365 E1、E3和E5版本。需要注意的是,Microsoft 365的功能不断演变。虽然在本课程中展示的功能是正确的,但在拍摄时可能已经更新或更改。那么在Microsoft 365订阅中包括了什么呢?
正如您所看到的,Microsoft 365的可用性完全取决于您的组织的订阅。然而,所有的Microsoft 365商业基本版和Office 365 E1订阅都包括了之前介绍的基本办公应用程序、基于云的服务、管理工具和其他功能。假设您的组织正在使用Microsoft 365商业标准版计划,您还将能够访问始终保持更新的桌面版办公应用程序。大多数计划还包括用于托管电子邮件、网络会议、即时通讯以及1 TB的OneDrive云存储空间等应用程序,以及许多其他功能。
现在您已经熟悉了Microsoft 365的基础知识,您可能会问自己使用其服务需要什么要求。您会很高兴听到,尽管Microsoft 365是基于云的,但享受其全部好处只需要很少的要求。这些要求包括运行Windows 8或Windows 10操作系统的设备,互联网访问以安装或激活Microsoft 365并进行管理,最后但也许最重要的是,还需要兼容的浏览器。近期或当前版本的Microsoft Edge、Firefox、Safari或Google Chrome都与Microsoft 365兼容
个人补充
Microsoft 365 订阅计划通常包括不同层次的功能和服务,适用于个人用户、家庭用户和企业用户等不同的需求。例如:
Microsoft 365 家庭版:适用于家庭使用,最多可供 6 个用户使用。包括 Office 应用程序的桌面版本、OneDrive 云存储、Microsoft Teams 和 Skype 高级功能等。
Microsoft 365 个人版:适用于单一用户,包括 Office 应用程序的桌面版本、OneDrive 云存储以及额外的优惠。
Microsoft 365 企业应用版:适用于中小型企业,包括 Office 应用程序的 Web 和移动版本、企业级电子邮件和日历功能、OneDrive 云存储以及 Microsoft Teams 团队协作工具。
Microsoft 365 企业基础版:适用于中小型企业,包括 Office 应用程序的 Web 和移动版本、企业级电子邮件和日历功能,以及 OneDrive 云存储,但不包括 Office 应用程序的桌面版本。
Microsoft 365 企业标准版:包括 Microsoft 365 企业基础版的所有功能,同时还提供每个用户最多 5 台 PC/Mac 的 Office 应用程序的桌面版本,以及访问 SharePoint 和 Teams 进行团队协作的额外功能。
Microsoft 365 企业级应用版:适用于较大组织,包括 Office 应用程序的 Web、移动和桌面版本,以及高级安全和合规功能,还包括带有 Exchange Online 的企业级电子邮件和日历功能,以及 OneDrive 云存储。
Office 365 E1、E3 和 E5:这些是面向企业的高级订阅计划,提供不同层次的功能和能力,包括 Office 应用程序的桌面版本、高级安全和合规功能,以及额外的服务,如高级分析、高级威胁保护等。
Exercise: Finding Help and changing account settings
Note: You can pass this course and all graded assessments without access to the downloadable version of Microsoft 365.
How to complete this exercise
To complete the exercises in this course, you will need access to Microsoft Word.
Note: Keep in mind that if you are using free Office for the web or another version of the Microsoft Word application some features covered in this exercise may not be available.
Free Office for the web
If you do not have access to Microsoft Word, you can use free Office for the web. This version of Office allows you to view and edit files in apps like Word, Excel, and PowerPoint. This free service is available to anyone with a Microsoft account.
Access Microsoft Account
Log in to your Microsoft account. Type the email, phone number, or Skype sign-in that you use for other services (Outlook, Office, etc.), then select Next. If you don’t have a Microsoft account, you can select No account? Create one! If you are using a business account, please get the necessary authorization before trying to change your password.
Let’s get started!
Now that you are comfortable logging into your account and completing basic navigation tasks, you would like to customize some account settings.
-
To begin, turn on and log into your computer. Open your most frequently used browser and open the https://login.microsoftonline.com web page:
-
On the landing page for your account, open the Settings task pane by clicking the Settings icon that appears in the top right-hand corner of the toolbar at the top of the current page:
Settings icon in the browser window
- With the Settings task pane now displayed, click the Change your password link:
Change your password link in the settings window
- A new tab will open in your browser. Sign into your account again if asked to do so. Type your existing password into the Old password text box. Type a new password for your account into the Create new password and Confirm new password text boxes. Click the submit button:
Change password window, new password created with submit button
- You will now be returned to the landing page for your account:
Initials from the user profile on the top right of the window
- Click the Help icon on the toolbar:
Question icon on the window
- Type “Change time zone” into the search field, then click the Search icon:
Search tab containing the text “change time zone” with search button
- Scroll down and select the Change your display language and time zone in Microsoft 365 for Business link:
The results from the search regarding change time zone
- Scan through the instructions to change language and time zone. Once finished, click X to close the Help pane:
Close button on the top right of the help window
- Sign out of your Microsoft 365 account and close your browser to complete this exercise.
练习:查找帮助并更改账户设置
注意:您可以在没有下载版本的Microsoft 365的情况下通过此课程和所有评估考试。
如何完成此练习
要完成此课程中的练习,您需要访问Microsoft Word。
注意:请记住,如果您使用的是免费的Office在线版本或其他版本的Microsoft Word应用程序,可能无法使用本练习中涉及的某些功能。
免费的Office在线版本
如果您无法访问Microsoft Word,您可以使用免费的Office在线版本。这个版本的Office允许您在Word、Excel和PowerPoint等应用程序中查看和编辑文件。这个免费服务对任何拥有Microsoft账户的人都是可用的。
访问Microsoft账户
登录您的Microsoft账户。在登录页面上输入您用于其他服务(Outlook、Office等)的电子邮件、电话号码或Skype登录名,然后选择下一步。如果您没有Microsoft账户,可以选择没有账户?创建一个!如果您正在使用企业账户,请在尝试更改密码之前获取必要的授权。
让我们开始吧!
现在您已经熟悉如何登录您的账户并完成基本的导航任务,您想要自定义一些账户设置。
首先,打开并登录您的计算机。在您最常使用的浏览器中打开https://login.microsoftonline.com网页:
在您的账户登录页面上,通过点击工具栏顶部右侧的设置图标,打开设置任务窗格:
现在显示了设置任务窗格后,点击“更改密码”链接:
新的标签页会在浏览器中打开。如果被要求重新登录账户,请重新登录。在“旧密码”文本框中输入您的现有密码。在“创建新密码”和“确认新密码”文本框中输入一个新密码。点击提交按钮:
现在您将返回到您的账户登录页面:
点击工具栏上的帮助图标:
在搜索框中输入“更改时区”,然后点击搜索图标:
滚动到页面底部,选择“在Microsoft 365 for Business中更改您的显示语言和时区”链接:
阅读更改语言和时区的说明。完成后,点击X关闭帮助窗格:
登出您的Microsoft 365账户并关闭浏览器,完成此练习。
Introduction to Word
One of the key features of Microsoft 365 is the inclusion of Office apps. In this lesson you’ll explore the interfaces and discover the basic features of the apps that come with a Microsoft 365 Business Standard subscription. The apps you’ll look at include Word, Excel, PowerPoint, and Outlook. As well as these standard apps, you’ll also have the option to explore the following: Access, Publisher, and OneNote. Keep in mind that most of these applications are available in both online and offline versions. There are often significant differences between these versions such as reduced features, but don’t worry you’ll find out about these differences in more detail over the course of this lesson. Grace is an employee with WestCal in their fulfillment center. However, she would like to transition to the editorial side of the business. To achieve this goal, she’s begun a publishing course at the local university. As part of this course, she needs to develop a familiarity with basic Microsoft Office 365 applications. One of the key applications that Grace needs to develop her skill set with is Microsoft Word. You’re probably already familiar with Microsoft Word on a basic level, but here’s a quick recap of some key facts to make sure you’re up to speed. Microsoft Word is Microsoft’s powerful word processing program, and is used to create professional documents. You can also add tables, images, and much more. Word’s interface is intuitive and easy to use. It’s also customizable so you can make sure that the tools you need are easily accessible. Microsoft Word is offered as both online and desktop versions. Although the online version has limited features, it provides most of the frequently used tools needed to compose a simple document. Let’s explore the different parts of the Microsoft Word interface. The first part of Word that we’ll explore is the title bar, this is where the name of the current file is displayed along with other information, like if it’s been saved. You can select the file name to change it. Next is the ribbon interface, this displays top commands organized into groups. You can use these top commands to create and edit different elements of your documents, like tables or paragraphs. The working area is the main portion of the Word document, this is where you can view, create, and edit content. Finally, there’s the status bar. This bar is used to display information about the documents such as the page number, the word count, and other information like the default language. You’ve explored the Microsoft Word interface and key features, you’re now ready to open the app and start exploring it for yourself.
Word简介
Microsoft 365的关键特点之一是包含了Office应用程序。在本课程中,您将探索这些应用程序的界面,并了解随附于Microsoft 365 Business Standard订阅的应用程序的基本功能。您将查看的应用程序包括Word、Excel、PowerPoint和Outlook。除了这些标准应用程序外,您还可以选择探索以下应用程序:Access、Publisher和OneNote。请注意,这些应用程序大多数都有在线和离线版本。这些版本之间通常存在显著差异,如功能减少,但不要担心,您将在本课程的过程中详细了解这些差异。Grace是WestCal公司履行中心的一名员工。然而,她希望转向业务的编辑部门。为了实现这个目标,她在当地大学开始了一门出版课程。作为这门课程的一部分,她需要熟悉基本的Microsoft Office 365应用程序。Grace需要熟练掌握的关键应用程序之一是Microsoft Word。您可能已经对Microsoft Word有基本的了解,但以下是一些关键事实的快速回顾,以确保您了解最新情况。Microsoft Word是微软强大的文字处理程序,用于创建专业文档。您还可以添加表格、图片等等。Word的界面直观易用,而且可定制,以便您可以确保需要的工具易于访问。Microsoft Word提供在线和桌面版本。虽然在线版本功能有限,但提供了撰写简单文档所需的大多数常用工具。让我们探索一下Microsoft Word界面的不同部分。我们将首先探讨的是标题栏,其中显示了当前文件的名称以及其他信息,例如是否已保存。您可以选择文件名进行更改。接下来是功能区界面,它显示了按组组织的顶部命令。您可以使用这些顶部命令创建和编辑文档的不同元素,如表格或段落。工作区是Word文档的主要部分,您可以在这里查看、创建和编辑内容。最后,还有状态栏。此栏用于显示有关文档的信息,如页码、字数以及默认语言等。您已经探索了Microsoft Word的界面和关键功能,现在可以打开应用程序并开始自己探索了。
Introduction to Excel
Excel is a key application in the Microsoft 365 Office Suite. I’m sure you’ve heard of Excel, but are you familiar with what it’s used for? Microsoft Excel is Microsoft’s spreadsheet program for managing numerical data, like financial information. You can also use it to add charts, shapes, and much more. Microsoft Excel has both online and desktop versions. If you need only simple formulas, the online version will satisfy your requirements. Otherwise, you can choose to work on the desktop app. Grace is learning how to use Excel as WestCal need her to assist them with tracking finances and other data. As part of retraining, Grace will need to become familiar with Excel’s interface and tools. Excel is one of the more complex interfaces within the Microsoft Office Suite, but don’t worry, here’s an overview of Excel’s interface. In Excel, the name of the currently open file is displayed in the title bar. There’s also a ribbon interface which displays tab commands organized into groups. You can use these commands to create and edit content in the document like the Page Layout, Formulas and Data. Next is the formula bar in which you can enter data into a cell. Below this, is the work area. This displays the data in your current file that you’re working on. Finally, there’s the status bar. This bar displays running calculations and other information about the workbook. That’s your overview of Excel’s main features and interface. You’re now ready to begin exploring Excel and it’s numerical management features
Excel简介
Excel 是 Microsoft 365 Office 套件中的一个关键应用程序。我相信您已经听说过 Excel,但您是否熟悉它的用途呢?Microsoft Excel 是 Microsoft 的电子表格程序,用于管理数值数据,例如财务信息。您还可以使用它添加图表、形状等其他内容。Microsoft Excel 有在线和桌面版本。如果您只需要简单的公式,在线版本就可以满足您的需求。否则,您可以选择使用桌面应用程序。Grace 正在学习如何使用 Excel,因为 WestCal 需要她协助他们进行财务和其他数据的跟踪。作为重新培训的一部分,Grace 需要熟悉 Excel 的界面和工具。Excel 是 Microsoft Office Suite 中较为复杂的界面之一,但不用担心,这里有一个 Excel 界面的概述。在 Excel 中,当前打开文件的名称显示在标题栏中。接下来是功能区界面,它显示以标签组织的命令。您可以使用这些命令在文档中创建和编辑内容,例如页面布局、公式和数据。下面是公式栏,您可以在其中输入数据到单元格中。在此下面是工作区,它显示您当前正在处理的文件中的数据。最后是状态栏,它显示正在运行的计算和有关工作簿的其他信息。这是 Excel 的主要特点和界面的概述。现在您已经准备好开始探索 Excel 和其数值管理功能了。
Introduction to PowerPoint
Microsoft PowerPoint is one of the most used apps in the Microsoft 365 Office Suite. Like with many of the other apps available in the Microsoft 365 Office Suite, you’ve probably used PowerPoint before. Take a moment to re-familiarize yourself with the basics. Microsoft PowerPoint is Microsoft’s presentation software program which is used to create professional presentations. You can create anything from a basic slideshow to a self-running narrated presentation using pictures, embedded videos, and sound. Like other apps, PowerPoint is available both online and offline, but with more functionality on desktop. Here’s a look at how PowerPoint is used over at WestCal. Grace is working on improving her PowerPoint skills. WestCal often uses PowerPoint to produce presentations for clients and their own internal departments. Grace would like to be able to create these presentations when she moves to the editorial department. To become more proficient with PowerPoint, Grace will need to familiarize herself with the program’s interface. Take a closer look at the program and find out what elements users like Grace need to know about. The first part of the PowerPoint interface is the title bar. This is where the name of the current file is displayed along with other information on the file. For example, you can see here that it’s been saved. You can click the filename to change it. Then there’s the ribbon interface. This displays top commands organized into groups like Insert, Slide Show, and View. Next, we have the slides pane. Each slide in the presentation is displayed in this pane as a thumbnail, to view a slide, to select it from the pane. Like other applications, there’s also a working area. This is where you can view and edit content from the currently selected side. Finally, there’s the status bar. This bar is used to display information about the presentation like the slide number and default language. You’ve now started your journey to creating professional and exciting PowerPoint presentations having learned to navigate the apps interface and locate its main features
PPT介绍
Microsoft PowerPoint 是 Microsoft 365 Office 套件中使用最广泛的应用程序之一。就像其他 Microsoft 365 Office 套件中的应用程序一样,您可能以前已经使用过 PowerPoint。现在让我们再次熟悉一下基础知识。Microsoft PowerPoint 是 Microsoft 的演示文稿软件,用于创建专业的演示文稿。您可以创建从基本的幻灯片演示到包含图片、嵌入视频和声音的自运行讲述性演示文稿。和其他应用程序一样,PowerPoint 有在线和离线两种版本,但桌面版功能更为强大。现在让我们来看看在 WestCal 公司如何使用 PowerPoint。Grace 正在提高她的 PowerPoint 技能。WestCal 经常使用 PowerPoint 为客户和内部部门制作演示文稿。当她转到编辑部门时,Grace 希望能够创建这些演示文稿。为了更熟练地使用 PowerPoint,Grace 需要熟悉该程序的界面。让我们更详细地了解一下这个程序,并找出像 Grace 这样的用户需要了解的元素。PowerPoint 界面的第一部分是标题栏。这是当前文件的名称以及文件的其他信息的显示位置。例如,您可以在这里看到文件已保存。您可以点击文件名来更改它。接下来是功能区界面。这显示了以组织方式排列的顶部命令,例如插入、幻灯片放映和查看。然后是幻灯片窗格。每个演示文稿中的幻灯片都以缩略图的形式显示在这个窗格中,您可以从窗格中选择幻灯片来查看。和其他应用程序一样,还有一个工作区,这是您可以在当前选定的幻灯片中查看和编辑内容的地方。最后是状态栏,用于显示关于演示文稿的信息,例如幻灯片编号和默认语言。现在您已经开始了创建专业和引人入胜的 PowerPoint 演示文稿的旅程,已经学会了如何导航应用程序界面并找到其主要特点。
Introduction to Outlook
Microsoft Outlook is a cornerstone application for many businesses. Like with other Office applications, you’ve most likely used it before at some stage. Here’s a quick recap on the basics. Microsoft Outlook is a powerful and easy to use information management application. You can manage your email, calendar, contacts, tasks, and much more all from one central location. You can also connect and communicate more easily with your teammates. Like other apps, Outlook can also be accessed online or offline, but it’s best to use the desktop app if you need more functionality and customizability. Over at WestCal, Grace is hoping to gain more advanced skills with Outlook. She’s already familiar with the app but only the basic features. She wants to develop more advanced skills so that she can take on more of a managerial role in which she organizes and runs meetings with clients using the app. Before she can begin to boost her skills, Grace first needs to show that she’s familiar with Outlook’s interface. She needs to know what the main features are and where to find them. Explore the interface and find out what features Grace should be familiar with. The first part of Outlook we’ll focus on is the navigation commands. These are a series of commands that you can select to access different parts of Outlook such as the app launcher, the search box, links to view notifications, change settings, get help, and the my account task pane, then there’s the editing pane. You can use the editing pane to delete, move, and archive emails alongside other actions. Outlook also contains folders. You can use the folder section to organize and access emails. Next to the folders is the navigation pane. These are shortcut icons that you can use to switch between features like mail, calendar, people, and to do, or task workspaces. Finally, there’s the item list and reading pane. The item pane shows a list of items in the folder that you’ve currently selected like your inbox. When an item is selected, it appears in the reading pane where you can view its contents. That covers our overview of outlooks interface and features. Just like Grace, you’ve now also taken the first step to communicating and collaborating effortlessly with your colleagues.
Outlook介绍
Microsoft Outlook是许多企业的重要应用程序。和其他Office应用程序一样,您很可能在某个阶段使用过它。这是对基础知识的简要回顾。Microsoft Outlook是一款功能强大且易于使用的信息管理应用程序。您可以从一个中心位置管理电子邮件、日历、联系人、任务等等。您还可以更轻松地与团队成员连接和沟通。像其他应用程序一样,Outlook可以在线或离线访问,但如果您需要更多的功能和可定制性,最好使用桌面应用程序。在WestCal,Grace希望通过Outlook获得更高级的技能。她已经熟悉这个应用程序,但只是基本功能。她想要发展更高级的技能,以便能够在管理角色中组织和运行与客户的会议。在她开始提升技能之前,Grace首先需要展示她熟悉Outlook的界面。她需要知道主要的功能在哪里以及如何找到它们。探索界面,找出Grace应该熟悉的功能。我们将首先关注Outlook的导航命令。这些是一系列命令,您可以选择访问Outlook的不同部分,如应用程序启动器、搜索框、查看通知的链接、更改设置、获取帮助和我的帐户任务窗格,然后是编辑窗格。您可以使用编辑窗格删除、移动和归档电子邮件以及其他操作。Outlook还包含文件夹。您可以使用文件夹部分来组织和访问电子邮件。文件夹旁边是导航窗格。这些是快捷图标,您可以用它们在邮件、日历、联系人、待办事项或任务工作区之间切换。最后,有项目列表和阅读窗格。项目窗格显示了您当前选择的文件夹中的项目列表,例如您的收件箱。当选择一个项目时,它将显示在阅读窗格中,您可以在其中查看其内容。这就是我们对Outlook界面和功能的概述。就像Grace一样,您现在已经迈出了与同事轻松沟通和协作的第一步。
Exercise: Organizing files in OneDrive
Note: You can pass this course and all graded assessments without access to the downloadable version of Word.
How to complete this exercise
To complete this exercise, you will need access to Microsoft Word.
Note: Keep in mind that if you are using free Office for the web or another version of the Microsoft Word application some features covered in this exercise may not be available.
Free Office for the web
If you do not have access to Microsoft Word, you can use Free Office for the web. This version of Office allows you to view and edit files in apps like Word, Excel, and PowerPoint. This free service is available to anyone with a Microsoft account.
Access Microsoft Account
Log in to your Microsoft account. Type the email, phone number, or Skype sign-in that you use for other services (Outlook, Office, etc.), then select Next. If you don’t have a Microsoft account, you can select No account? Create one!
Let’s get started!
In this exercise, you will upload a file to your OneDrive account, create a folder, and move the file into that folder.
- To begin, turn on and log into your computer. Open your most frequently used browser and open the https://login.microsoftonline.com web page:
Microsoft sign in window with next button
- Click the OneDrive tile on your landing page:
Microsoft 365 landing page with the OneDrive icon highlighted.Microsoft 365 landing page with the OneDrive icon highlighted.
- The OneDrive for Business page will open in a new tab and show your account’s contents:
OneDrive for Business page open, showing the account’s contents
- Let’s upload a new file to your OneDrive account. Click Upload → Files:
OneDrive window open, Upload option selected and Files chosen
- The Open dialog box will appear. Navigate to your Exercise Files, locate any of the exercise files, and select it. Click Open.
Note: In this example we have selected the file Activity 3-1. You can select any file in your OneDrive.
Open dialog box appears, congaing the Exercise Files, Activity 3-1 file selected, Open button clicked
- Back in OneDrive, you will see the new file listed here:
OneDrive dialog window open, containing the new file
- Now, click New → Folder:
OneDrive dialog window open, New option selected and Folder option clicked
- Type, “Exercise Files” for the new name and click Create:
Create a Folder dialog box open, Typed in the field “exercise Files”, Create button clicked
- Drag and drop the file into the new folder.
Note: In this example we have selected the file Activity 3-1. You can select any file in your OneDrive.
OneDrive dialog box open, Activity 3-1 selected from the files, dragged and dropped the file into the new folder
- This exercise is now complete.
练习:在OneDrive中组织文件
注意事项:您可以在没有可下载的Word版本的情况下完成这门课程和所有评估。
如何完成这个练习
要完成这个练习,您需要访问Microsoft Word。
注意:请注意,如果您使用的是免费的Office在线版或其他版本的Microsoft Word应用程序,本练习中涵盖的某些功能可能无法使用。
免费的Office在线版
如果您没有访问Microsoft Word的权限,您可以使用免费的Office在线版。这个版本的Office允许您在类似Word、Excel和PowerPoint的应用程序中查看和编辑文件。这个免费服务对任何具有Microsoft帐户的人都可用。
访问Microsoft帐户
登录您的Microsoft帐户。输入您用于其他服务(Outlook、Office等)的电子邮件、电话号码或Skype登录,然后选择下一步。如果您没有Microsoft帐户,您可以选择“没有帐户?创建一个!”
让我们开始吧!
在这个练习中,您将把一个文件上传到您的OneDrive账户,创建一个文件夹,并将文件移动到该文件夹中。
首先,打开并登录您的计算机。打开您最常使用的浏览器,然后打开https://login.microsoftonline.com网页:
Microsoft登录窗口,显示下一步按钮
在您的登录页面上点击OneDrive磁贴:
Microsoft 365登录页面,OneDrive图标已突出显示
OneDrive for Business页面将在一个新的选项卡中打开,并显示您账户的内容:
OneDrive for Business页面已打开,显示账户的内容
让我们将一个新文件上传到您的OneDrive账户。点击上传 → 文件:
OneDrive窗口已打开,选择上传选项,并选择文件选项
将会出现打开对话框。导航到您的Exercise Files文件夹,找到任何一个练习文件,并选择它。点击打开。
注意:在这个例子中,我们选择了文件Activity 3-1。您可以选择您OneDrive中的任何文件。
打开对话框出现,包含Exercise Files文件夹,Activity 3-1文件已选择,点击打开按钮
回到OneDrive,您会看到新文件已列在这里:
OneDrive对话框窗口已打开,包含新文件
现在,点击新建 → 文件夹:
OneDrive对话框窗口已打开,选择新建选项,并点击文件夹选项
输入“Exercise Files”作为新名称,然后点击创建:
创建文件夹对话框已打开,输入“Exercise Files”到字段中,点击创建按钮
将文件拖放到新文件夹中。
注意:在这个例子中,我们选择了文件 “Activity 3-1”。您可以选择您在 OneDrive 中的任何文件。
OneDrive 对话框打开,从文件中选择了 “Activity 3-1”,将文件拖放到新文件夹中。
现在,这个练习已经完成。
Word
Exercise: Identifying the elements of the Word interface
Note: You can pass this course and all graded assessments without access to the downloadable version of Word.
How to complete this exercise
To complete this exercise, you will need access to Microsoft Word.
Note: Keep in mind that if you are using free Office for the web or another version of the Microsoft Word application some features covered in this exercise may not be available.
Free Office for the web
If you do not have access to Microsoft Word, you can use Free Office for the web. This version of Office allows you to view and edit files in apps like Word, Excel, and PowerPoint. This free service is available to anyone with a Microsoft account.
Access Microsoft Account
Log in to your Microsoft account. Type the email, phone number, or Skype sign-in that you use for other services (Outlook, Office, etc.), then select Next. If you don’t have a Microsoft account, you can select No account? Create one!
Let’s get started!
In this exercise, you will open Microsoft Word 365 and examine some of its commands.
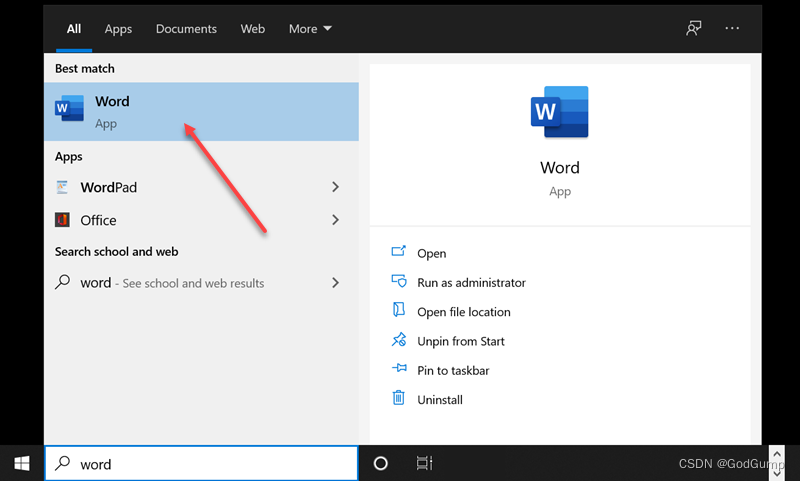
- Type “Word” into the search box on the Windows 10 taskbar:
Search box, with field to type the word for search
(If you are using Windows 8, start typing at the Start screen to search.)
- Click the entry for Word 365 to start the program:
Search bar typed Word, Word application appeared in the best match section
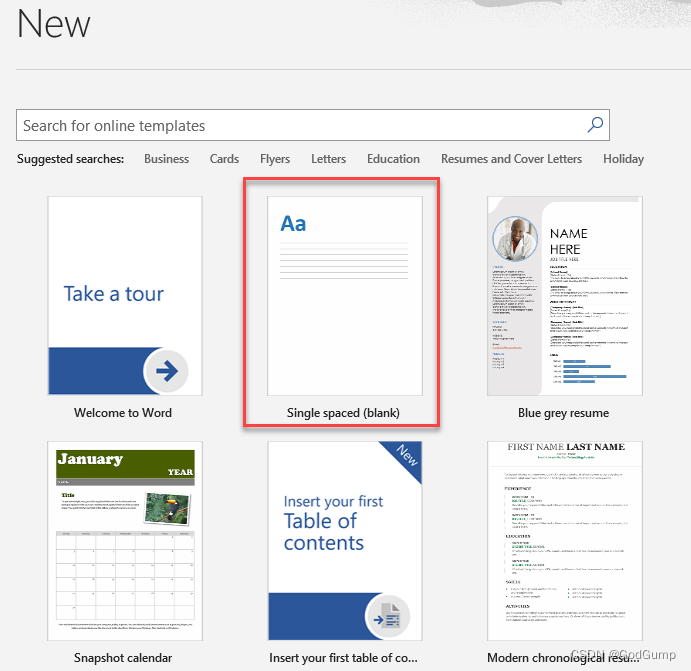
- Microsoft Word will start and prompt you to create a document using the Start screen. Click the thumbnail labelled “Single-spaced (blank):”
Microsoft Word window prompted with options of the documents that can be create, “Single-Spaced (blank)” option selected
(If you do not see this thumbnail, choose any other document with [blank] in brackets.)
-
Click “Create” in the resulting dialog box:
-
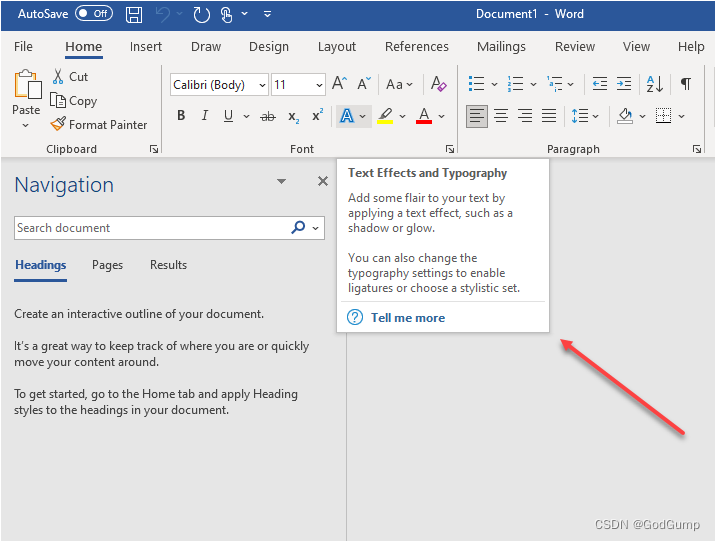
Microsoft Word will now create the document. Take a moment to hover your mouse over some commands on the Home tab. You may see a small box appear and describe the command – this is called a ScreenTip:
Microsoft create a new document, Home tab open, small box appear on the top of the commands
- In the document, type your name:
Microsoft Word document opened with the name John Smith typed
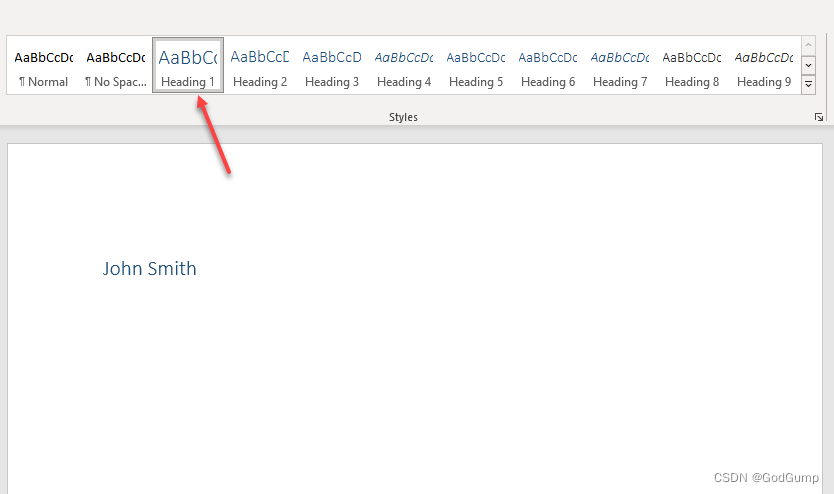
- Click the Heading 1 style on the Home tab to apply that style:
The Word document open, Hedng 1 option selected, the style panel opened, with the options of the styles for the document
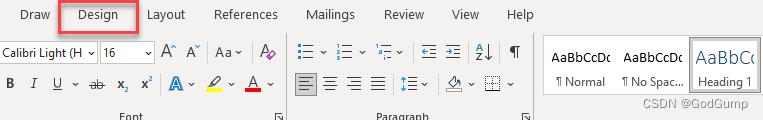
- Click the Design tab:
Word document tab open, Design option was selected
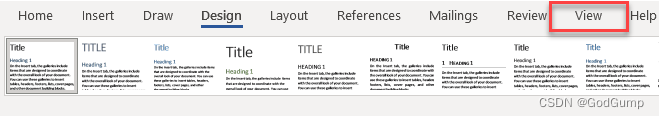
- Click any Quick Style Set to change the look of your document:
Design tab open with Document Formatting options
- Click the View tab:
The Word tab open, View tab selected
- Click each of the views in the Views group, starting with Read Mode and ending with Draft. (Print Layout should already be applied.) How does each option change your document?
Microsoft View tab open with the options of views on the left side, start with Read Mode and end with Draft
Return to Print Layout when you are finished.
- Click the X in the top right-hand corner of the program window to close Microsoft Word 365:
Word tab open with the close icon option on the top left
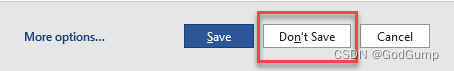
- When you are prompted to save your document, click “Don’t Save” to complete the exercise:
Save window open with Don’t save option selected
Exercise: 识别Word界面的元素
注意:您可以在没有下载版本的Word的情况下完成这门课程和所有的评估。
完成这个练习需要访问Microsoft Word。
注意:请记住,如果您使用的是免费的Office在线版本或其他版本的Microsoft Word应用程序,一些在这个练习中涵盖的功能可能不可用。
免费的Office在线版本
如果您没有访问Microsoft Word的权限,您可以使用免费的Office在线版本。这个版本的Office允许您在Word、Excel和PowerPoint等应用程序中查看和编辑文件。这个免费的服务对任何拥有Microsoft账户的人都是可用的。
访问Microsoft账户
登录您的Microsoft账户。输入您用于其他服务(Outlook、Office等)的电子邮件、电话号码或Skype登录名,然后选择“下一步”。如果您没有Microsoft账户,您可以选择“没有账户?创建一个!”
让我们开始!
在这个练习中,您将打开Microsoft Word 365并查看其一些命令。
在Windows 10任务栏的搜索框中键入“Word”:
搜索框,带有输入搜索词的字段
(如果您使用的是Windows 8,在开始屏幕上开始输入以进行搜索。)

点击Word 365的条目以启动程序:
搜索栏输入Word,Word应用程序出现在最佳匹配部分
Microsoft Word将启动并提示您使用启动屏幕创建文档。点击标有“单倍行距(空白)”的缩略图。
Microsoft Word窗口提示选择可以创建的文档选项,选择了“单倍行距(空白)”
(如果您没有看到这个缩略图,选择带有[空白]的任何其他文档。)
在弹出的对话框中点击“创建”:
Microsoft Word现在将创建文档。花一些时间将鼠标悬停在主页选项卡上的一些命令上。您可能会看到一个小框弹出并描述命令 - 这被称为屏幕提示:
Microsoft创建了一个新文档,主页选项卡打开,命令上方出现了一个小框
在文档中输入您的名字:
Microsoft Word文档打开,输入了名字John Smith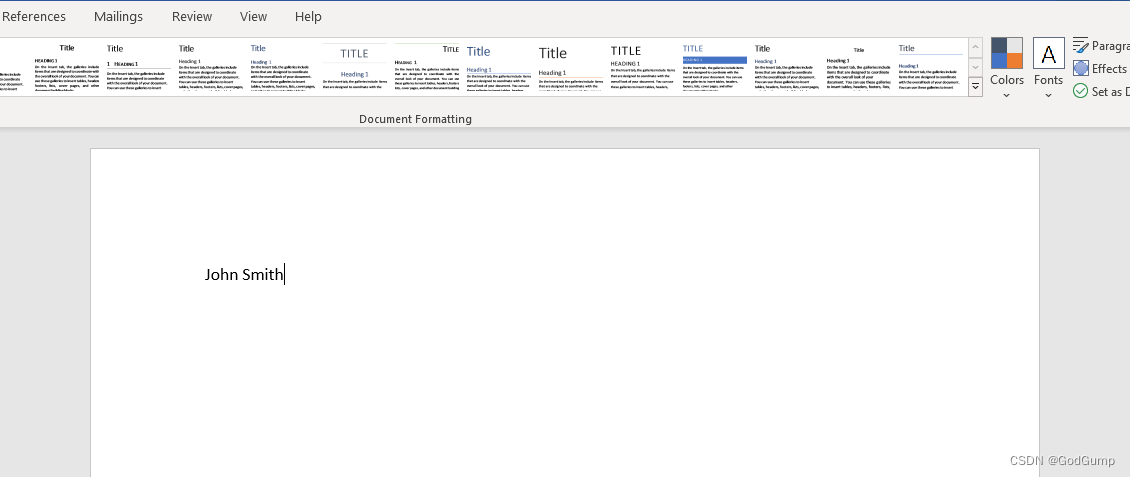
在主页选项卡上点击“标题 1”样式以应用该样式:
Word文档打开,标题 1选项被选中,样式面板打开,显示了文档的样式选项
点击“设计”选项卡:
Word文档选项卡打开,选择了“设计”选项
点击任何快速样式集,以改变您文档的外观:
“设计”选项卡打开,显示文档格式设置选项。

点击“查看”选项卡:
Word 选项卡打开,选择了“查看”选项卡。
点击“查看”选项卡中的每个视图,从“阅读模式”开始,一直到“草稿”为止。(打印布局应该已经应用了。)每个选项如何改变您的文档?
Microsoft Word 的“查看”选项卡打开,左侧显示不同的视图选项,从“阅读模式”开始,到“草稿”结束。
完成后返回打印布局视图。
点击程序窗口右上角的 X 按钮,关闭 Microsoft Word 365:
Word 选项卡打开,顶部左侧有关闭图标选项。
当提示保存文档时,点击“不保存”以完成练习:
Exercise: Finding and replacing text
Note: You can pass this course and all graded assessments without access to the downloadable version of Word.
How to complete this exercise
To complete this exercise, you will need access to Microsoft Word.
Note: Keep in mind that if you are using free Office for the web or another version of the Microsoft Word application some features covered in this exercise may not be available.
Free Office for the web
If you do not have access to Microsoft Word, you can use Free Office for the web. This version of Office allows you to view and edit files in apps like Word, Excel, and PowerPoint. This free service is available to anyone with a Microsoft account.
Access Microsoft Account
Log in to your Microsoft account. Type the email, phone number, or Skype sign-in that you use for other services (Outlook, Office, etc.), then select Next. If you don’t have a Microsoft account, you can select No account? Create one!
Let’s get started!
In this activity, you will use the Navigation Pane and the Find and Replace dialog box.
- Click on the link below to open the Microsoft Word exercise document you can use to complete this exercise.
Exercise: Finding and replacing text
- Click View → Navigation Pane:
Word document opened, View tab chosen
(If this command is already checked, skip to the next step.)
- Ensure the first tab (Headings) is selected. Review the list of headings in the document:
Word document with view options opened, Headings option selected
- Click the Pages tab for a different view of the document:
Word document, view tab open with navigation window at the left, with pages option selected
- Review the Navigation Pane:
Navigation widow opened with the 3 pages appearing the second page was selected
- Now, we want to update the document to reflect our country (rather than the Canadian program this RFP was based on). Click Home → Replace to begin:
Word document with Home tab selected and replace option clicked
-
The Find and Replace dialog box will open to the Replace tab. Enter “Canadian” in the “Find what” field:
-
Enter “citizen” in the “Replace with” field:
Find and Replace window opened with “Replace with” field typed Citizen
- Click “Find Next:”
Find an Replace widow with “Find Next” clicked
- Review the context of this replacement. Since it makes sense, click “Replace:”
Find and Replace window opened with replace option chosen
- Complete the next two replacements. When you reach the final sentence on Page 1, delete the text instead of replacing it:
(You can do this with the Find and Replace dialog box open.)
- Repeat the deletion for the next two instances:
Find and Replace window opened with the “Target Canadian Communities” paragraph selected
- We can now replace the instances in the rest of the document. Click “Replace All:”
Find and Replace window opened with “Replace All” option selected
- You should be notified that one final replacement has been made. Click “OK” to close this dialog box:
Replacement notification appearing with “ok” option selected
- Then, close the Find and Replace dialog box:
Find and Replace window opened with the close option selected
16. Save your document as Activity 2-3 Complete. Close Microsoft Word 365 to complete this exercise.
- Now, you can check out an example of a completed document in the link below:
Completed Exercise Finding and replacing text
练习:查找和替换文本
注意:您可以在没有下载版本的Word的情况下通过本课程和所有评分评估。
如何完成这个练习
要完成这个练习,您需要访问Microsoft Word。
注意:请记住,如果您使用的是免费的Office在线版或其他版本的Microsoft Word应用程序,本练习涵盖的一些功能可能无法使用。
免费的Office在线版
如果您没有访问Microsoft Word的权限,您可以使用免费的Office在线版。这个版本的Office允许您在Word、Excel和PowerPoint等应用程序中查看和编辑文件。这个免费服务对任何拥有Microsoft账户的人都是可用的。
访问Microsoft账户
登录您的Microsoft账户。输入您用于其他服务(Outlook、Office等)的电子邮件、电话号码或Skype登录,然后选择下一步。如果您没有Microsoft账户,可以选择没有账户?创建一个!
让我们开始吧!
在这个活动中,您将使用导航窗格和查找和替换对话框。
点击下面的链接打开Microsoft Word练习文档,您可以使用这个文档来完成练习。
练习:查找和替换文本
跳转
点击查看→导航窗格:
打开的Word文档,选择的是查看选项卡
(如果这个命令已经被选中,跳到下一步。)
确保选择了第一个选项卡(标题),审查文档中的标题列表:
打开的Word文档,查看选项卡已经选择了标题选项
点击页面选项卡,查看文档的不同视图:
打开的Word文档,查看选项卡已打开,左侧有导航窗口,选择了页面选项
查看导航窗格:
打开的导航窗格,显示了3页,第二页被选择
现在,我们想更新文档以反映我们的国家(而不是加拿大的项目,这个RFP是基于的)。点击首页→替换开始:
打开的Word文档,选择了首页选项卡,点击了替换选项
查找和替换对话框将打开到替换选项卡。在“查找内容”字段中输入“加拿大”:
在“替换为”字段中输入“公民”:
打开的查找和替换窗口,输入了替换为的内容“公民”
点击“查找下一个”:
查找和替换窗口,点击了“查找下一个”
查看此替换的上下文是否有意义,如果有意义,请点击“替换:”
打开了“查找和替换”窗口,选择了“替换”选项。
完成接下来的两个替换。当您到达第一页的最后一句时,删除文本而不是替换它:
(您可以在打开“查找和替换”对话框时执行此操作。)
对于下面的两个实例,请重复删除操作:
打开“查找和替换”窗口,选择“目标加拿大社区”段落。
现在,我们可以替换文档中的所有实例。点击“全部替换:”
打开了“查找和替换”窗口,选择了“全部替换”选项。
您应该会收到一个最终替换的通知。点击“确定”以关闭此对话框:
出现替换通知,选择“确定”选项。
然后,关闭“查找和替换”对话框:
打开“查找和替换”窗口,选择关闭选项。
将文档保存为“活动2-3完成”。关闭Microsoft Word 365以完成此练习。
现在,您可以在下面的链接中查看一个完成的文档示例:
完成的“查找和替换文本”练习文档
个人补充
其实ctrl+f和ctrl+r即可完成,不用那么麻烦,考试也没那么多时间去操作
Exercise: Applying character formatting
Note: You can pass this course and all graded assessments without access to the downloadable version of Word.
How to complete this exercise
To complete this exercise, you will need access to Microsoft Word.
Note: Keep in mind that if you are using free Office for the web or another version of the Microsoft Word application some features covered in this exercise may not be available.
Free Office for the web
If you do not have access to Microsoft Word, you can use Free Office for the web. This version of Office allows you to view and edit files in apps like Word, Excel, and PowerPoint. This free service is available to anyone with a Microsoft account.
Access Microsoft Account
Log in to your Microsoft account. Type the email, phone number, or Skype sign-in that you use for other services (Outlook, Office, etc.), then select Next. If you don’t have a Microsoft account, you can select No account? Create one!
Let’s get started!
In this exercise, you will start formatting a sample document.
- Click on the link below to open the Microsoft Word exercise document you can use to complete this exercise.
Exercise: Applying Character Formatting
- First, let’s set up the formatting for the document titles. Select the text “The Call” on the first page:
The word document opened with the text, second title from the text selected
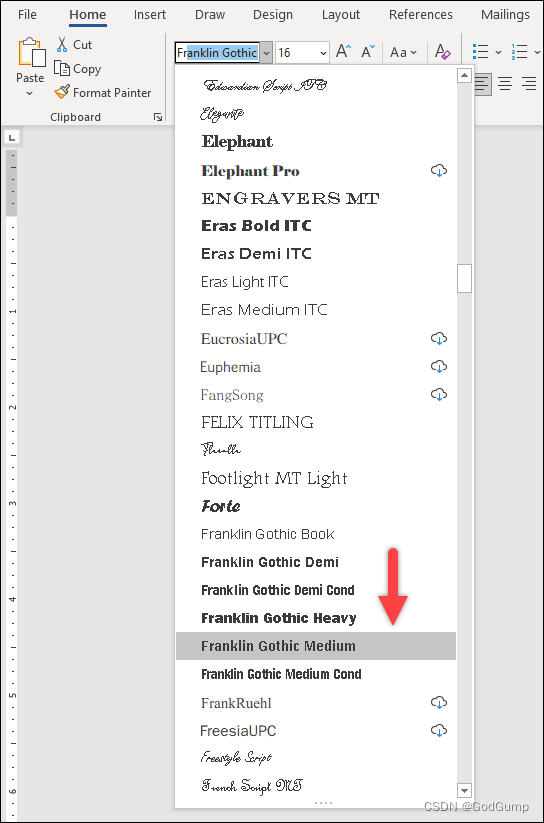
- Click the Font menu on the Home tab. Scroll down in the list and click “Franklin Gothic Medium:”
Font menu tab opened, “Franklin Gothic Medium” chosen
- Press Ctrl + Shift + > twice to increase the font size:
Text with the title “The Call” selected
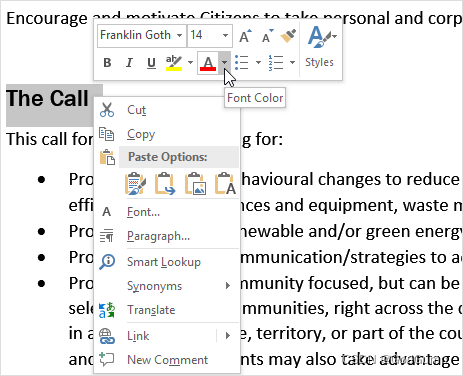
- With the text still selected, right-click it and click the Font Color drop-down arrow on the mini toolbar:
Font tab opened with the Font colour selected
- Click “Dark Blue:”
The font colour window opened, with the colours options, Dark Blue chosen
-
With your new title still selected, click Home → Format Painter:
-
Select the text “What groups are eligible?”
Word document opened with the title “What groups are eligible?” selected
(You may need to scroll down in the document to see this text.)
- Both titles will now have the same formatting:
The Word document opened with the title “What groups are eligible?” applied the change
10. Save your document as Activity 3-1 Complete and close Microsoft Word 365.
- Now, you can check out an example of a completed document in the link below:
练习:应用字符格式化
注:您可以在没有下载版本的Word的情况下通过这门课程和所有评分评估。
如何完成这个练习
要完成这个练习,您需要访问Microsoft Word。
注意:请注意,如果您使用的是免费的Office for the web或其他版本的Microsoft Word应用程序,本练习中涵盖的一些功能可能无法使用。
免费的Office for the web
如果您无法访问Microsoft Word,您可以使用免费的Office for the web。这个版本的Office允许您在Word、Excel和PowerPoint等应用程序中查看和编辑文件。这项免费服务对任何拥有Microsoft账户的人都是可用的。
访问Microsoft账户
登录您的Microsoft账户。输入您在其他服务(Outlook、Office等)中使用的电子邮件、电话号码或Skype登录名,然后选择下一步。如果您没有Microsoft账户,可以选择没有账户?创建一个!
让我们开始吧!
在这个练习中,您将开始对一个样本文档进行格式化。
点击下面的链接打开Microsoft Word练习文档,您可以使用它来完成这个练习。
Exercise: Applying Character Formatting
首先,让我们设置文档标题的格式。在第一页选择文本“The Call”:
打开的Word文档,选择了文本中的第二个标题

在主页选项卡中点击字体菜单。在列表中向下滚动,点击“Franklin Gothic Medium:”
字体菜单选项卡打开,选择了“Franklin Gothic Medium”
按下Ctrl + Shift + >两次,增大字体大小:
选中了标题为“The Call”的文本

仍然选中文本,右键点击它,点击小工具栏上的字体颜色下拉箭头:
字体选项卡打开,选择了字体颜色
点击“深蓝色”:
字体颜色窗口打开,选择了“深蓝色”

在新的标题上仍然选中,点击主页→格式刷:
选中文本“哪些群体有资格?”
打开的Word文档中,选中了标题为“What groups are eligible?”的文本
(您可能需要在文档中向下滚动以查看此文本。)
现在,两个标题都将具有相同的格式:
Word文档中的标题“What groups are eligible?”应用了更改
10. 将文档保存为“Activity 3-1 Complete”,然后关闭Microsoft Word 365。
Exercise: Displaying text as list items
Note: You can pass this course and all graded assessments without access to the downloadable version of Word.
How to complete this exercise
To complete this exercise, you will need access to Microsoft Word.
Note: Keep in mind that if you are using free Office for the web or another version of the Microsoft Word application some features covered in this exercise may not be available.
Free Office for the web
If you do not have access to Microsoft Word, you can use Free Office for the web. This version of Office allows you to view and edit files in apps like Word, Excel, and PowerPoint. This free service is available to anyone with a Microsoft account.
Access Microsoft Account
Log in to your Microsoft account. Type the email, phone number, or Skype sign-in that you use for other services (Outlook, Office, etc.), then select Next. If you don’t have a Microsoft account, you can select No account? Create one!
Let’s get started!
In this exercise, you will add lists to your sample document.
- Click on the link below to open the Microsoft Word exercise document you can use to complete this exercise.
Exercise: Displaying text as list items
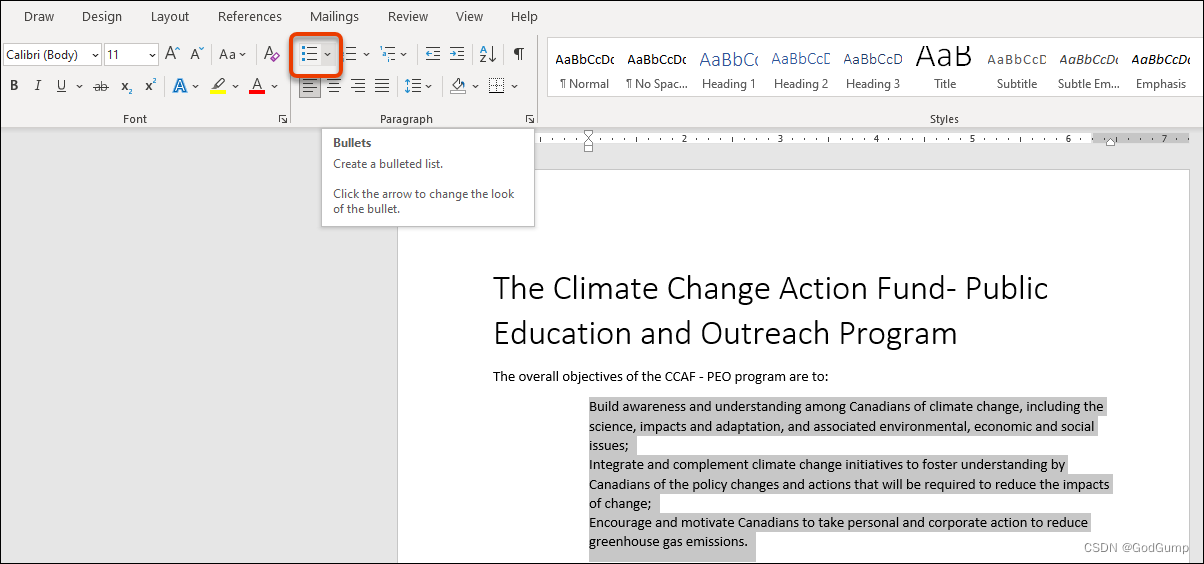
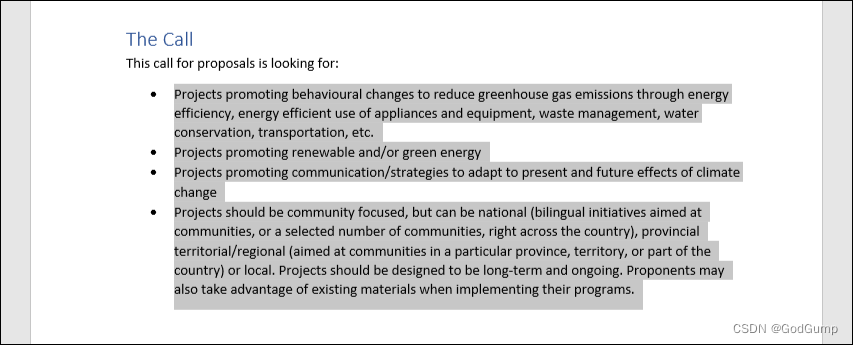
- First, let’s apply some bullets. Select the three indented lines of text at the top of the document. Click the Bullets drop-down command on the Home tab:
Home tab open with the bullets drop-down option clicked
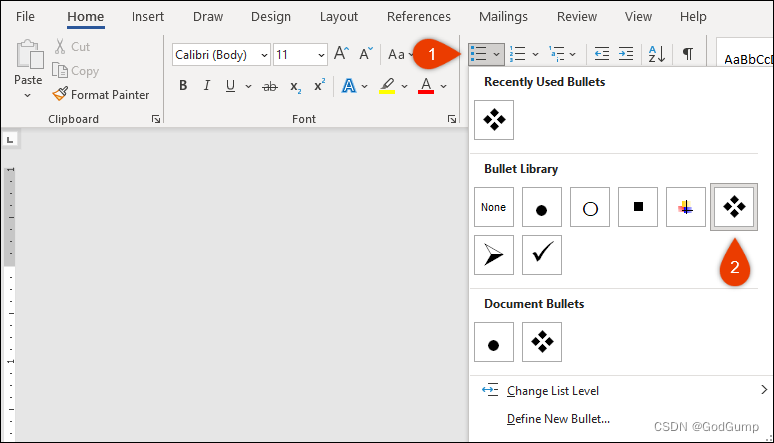
- Click any bullet you like to apply it:
Home tab opened with the bullets option window, a option of the bullets was chosen
- The bullets will be applied. Review the changes:
The Word document open with the text and the bullet points changes applied
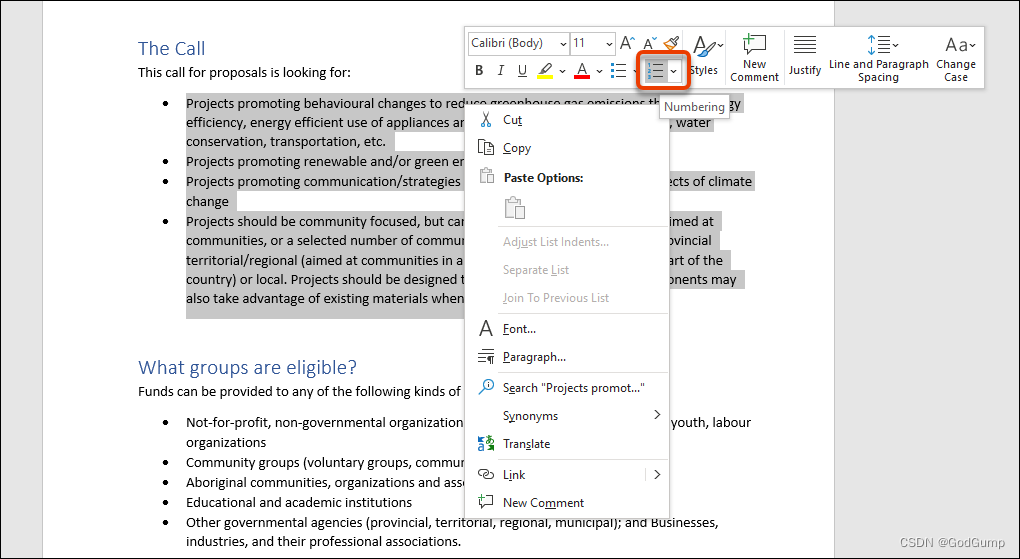
- Select the bullets in the next part of the document:
Word document opened the text with the bullets selected
- Right-click the selection. Click the Numbering command on the mini toolbar:
The word document with the bullets text selected the mini toolbar appearing with the numbering option chosen
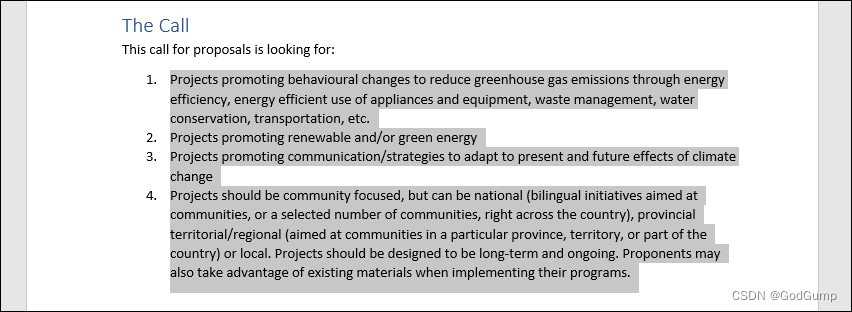
- Review the changes:
The Word document opened with the changes applied in the text
8. Save your document as Activity 3-3 Complete. Close Microsoft Word 365.
练习:将文本显示为列表项
注意:您可以在没有下载版的Word的情况下通过本课程和所有评估考试。
如何完成这个练习
要完成这个练习,您需要访问Microsoft Word。
注意:请记住,如果您使用的是免费的Office在线版或其他版本的Microsoft Word应用程序,本练习中涉及的某些功能可能不可用。
免费的Office在线版
如果您没有访问Microsoft Word的权限,您可以使用免费的Office在线版。这个版本的Office允许您在Word、Excel和PowerPoint等应用程序中查看和编辑文件。这个免费的服务对任何拥有Microsoft账户的人都是可用的。
访问Microsoft账户
登录您的Microsoft账户。输入您用于其他服务(Outlook、Office等)的电子邮件、电话号码或Skype登录名,然后选择下一步。如果您没有Microsoft账户,您可以选择没有账户?创建一个!
让我们开始吧!
在这个练习中,您将向样本文档添加列表。
点击下面的链接,打开Microsoft Word练习文档,您可以使用它来完成这个练习。
练习:将文本显示为列表项
首先,让我们应用一些项目符号。选择文档顶部的三行缩进的文本。点击主页选项卡上的“项目符号”下拉命令:
打开的主页选项卡,点击了“项目符号”下拉选项
点击任何您喜欢的项目符号以应用它:
打开的主页选项卡上显示了“项目符号”选项窗口,选择了一个项目符号
项目符号将被应用。复审更改:
打开的Word文档中,文本和项目符号的更改已应用

选择文档中下一部分的项目符号:
打开的Word文档中,选中了下一部分的文本和项目符号
右键点击选中的文本。点击小工具栏上的“编号”命令:
打开的Word文档,选中的文本显示了小工具栏,选择了“编号”选项
复审更改:
打开的Word文档中,文本的编号更改已应用
将文档保存为“Activity 3-3 Complete”。关闭Microsoft Word 365。
Font group commands keyboard shortcuts

字体组命令的键盘快捷键
常用的
加粗:Ctrl + B
斜体:Ctrl + I
下划线:Ctrl + U
删除线:Ctrl + D
字体大小增加:Ctrl + ]
字体大小减小:Ctrl + [
字体颜色:Ctrl + Shift + C
字体背景色:Ctrl + Shift + B
字体大小增加一点:Ctrl + Shift + >
字体大小减小一点:Ctrl + Shift + <
Exercise: Controlling paragraph layout
Let’s get started!
In this exercise, you will modify the alignment, margins, and spacing in our sample document.
- Click on the link below to open the Microsoft Word exercise document you can use to complete this exercise.
Exercise: Controlling Paragraph Layout
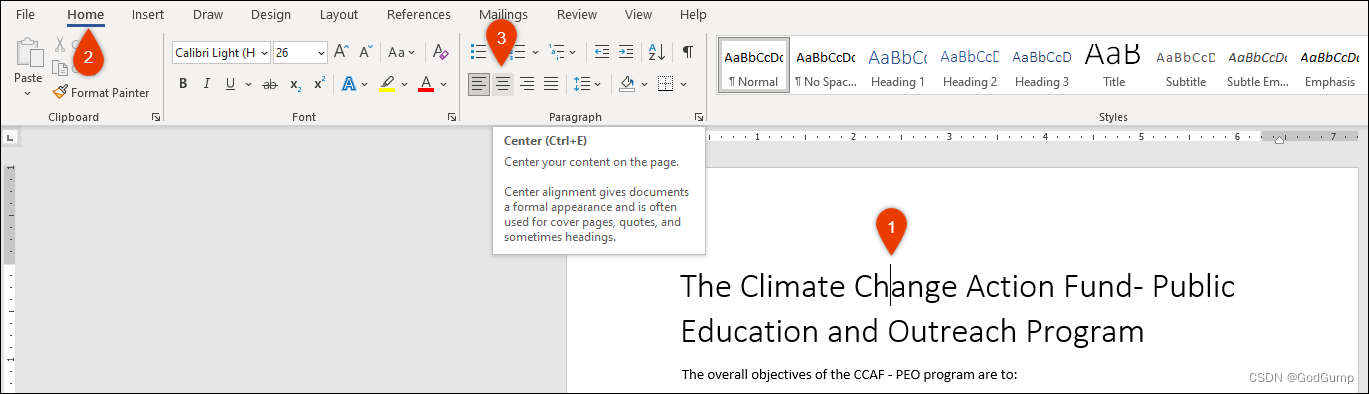
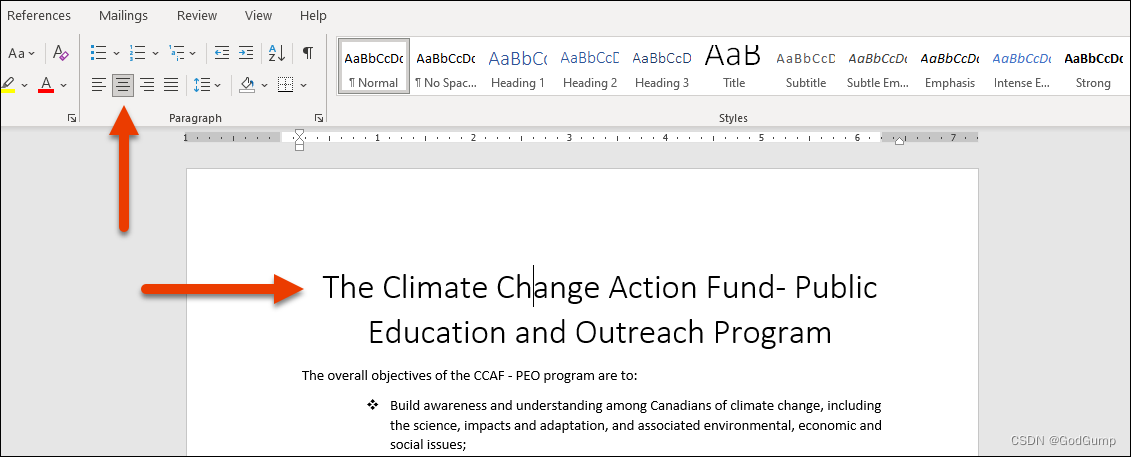
- First, let’s center the title. Make sure your cursor is in the first line of the document. Click Home → Center:
Word document opened with the cursor clicked in the text Home tab selected with the Center alignment icon was chosen
- The change will be applied. Notice that the Center alignment icon is now selected:
The Word document opened with the changes applied in the text, and the Center alignment icon is now selected
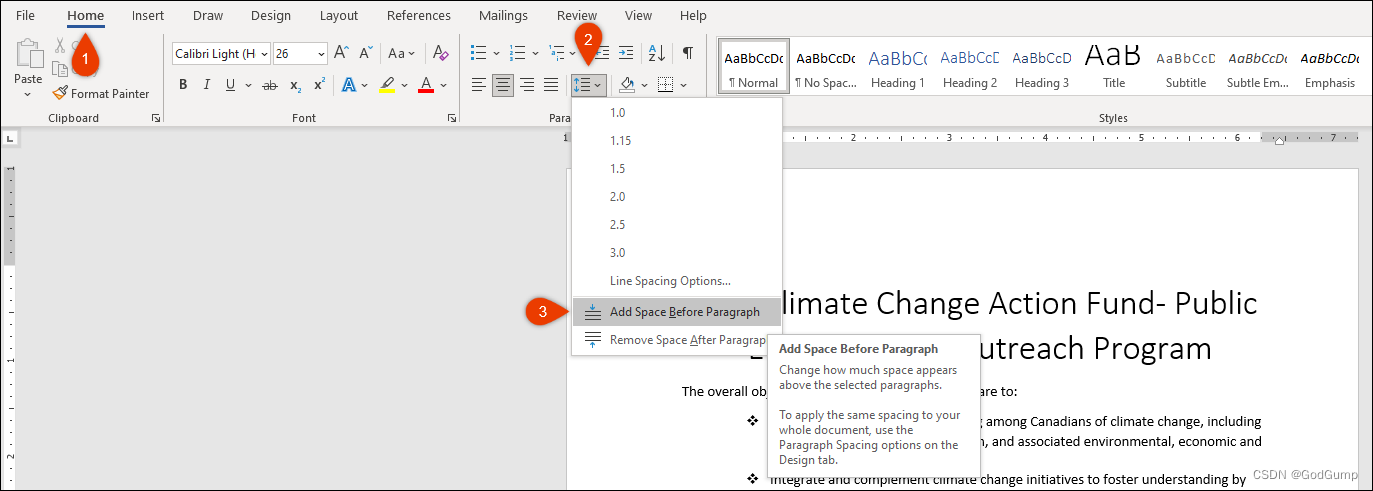
- Now, let’s add some space between the title and the document text. Ensure your cursor is still in the title. On the Home tab, click Line and Paragraph Spacing → Add Spacing After Paragraph:
Home tab opened with the cursor is in the title, Line and Paragraph Spacing clicked, Add Spacing After Paragraph was chosen
- Review the results:
The Word document opened with the cursor placed in the middle of the heading
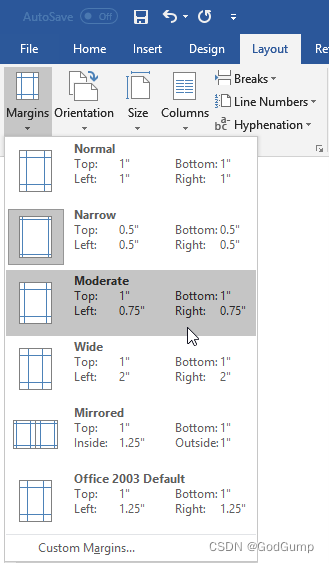
- Now, let’s improve the space around the document. Click Layout → Margins → Moderate:
Layout tab opened with the Margins selected and the Moderate option was chosen
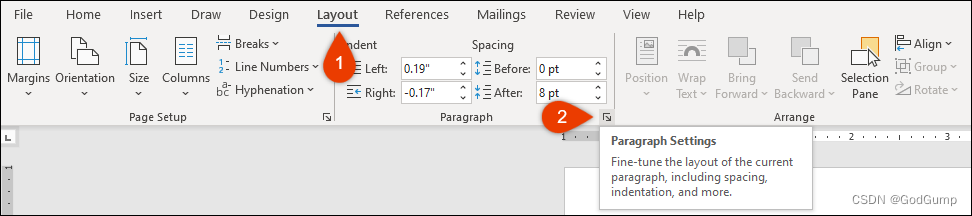
- Now, click the option button in the Paragraph group to open the Paragraph dialog box:
Layout tab opened with the Paragraph Settings option chosen
(You can perform this command from either the Home or Layout tab.)
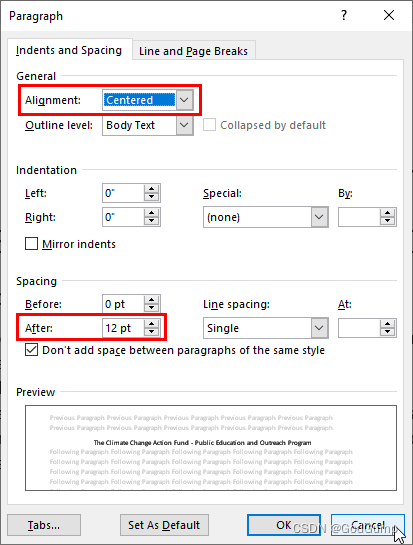
- Review the settings on the first tab. You should see some of the options that you have applied during this activity. Click “Cancel” when you are finished:
Paragraph window opened with the Alignment text option the cancel button was clicked
9. Save your document as Activity 3-4 Complete. Close Microsoft Word 365.
- Now, you can check out an example of a completed document in the link below:
Completed exercise: Controlling Paragraph Layout
练习:控制段落布局
让我们开始吧!
在这个练习中,您将修改示例文档中的对齐、边距和间距。
点击下面的链接打开可以用来完成这个练习的Microsoft Word文档。
练习:控制段落布局
首先,让我们将标题居中。确保光标在文档的第一行。点击"主页"→"居中":
在打开的Word文档中,光标点击在文本中,"主页"选项卡被选中,居中对齐图标被选择
更改将被应用。注意到"居中"对齐图标现在被选中:
在打开的Word文档中,更改已应用到文本,"居中"对齐图标被选中
现在,让我们在标题和文档正文之间添加一些间距。确保光标仍在标题中。在"主页"选项卡中,点击"行和段落间距"→"段落后添加间距":
在"主页"选项卡中,光标在标题中,点击"行和段落间距",选择"段落后添加间距"
查看结果:
在打开的Word文档中,光标位于标题的中间位置

现在,让我们改善文档周围的空间。点击"布局"→"边距"→"中等":
在"布局"选项卡中,"边距"被选中,选择"中等"选项
然后,点击段落组中的选项按钮,打开段落对话框:
在"布局"选项卡中,选择段落设置选项
(您可以从"主页"或"布局"选项卡执行此命令。)
查看第一个选项卡上的设置。您应该看到在这个活动中应用的一些选项。完成后点击"取消":
段落对话框打开,对齐文本选项,点击取消按钮
将您的文档保存为"Activity 3-4 Complete"。关闭Microsoft Word 365。
Exercise: Applying borders and shading
Let’s get started!
In this exercise, you will put the finishing touches on our sample document.
- Click on the link below to open the Microsoft Word exercise document you can use to complete this exercise.
Exercise: Managing formatting
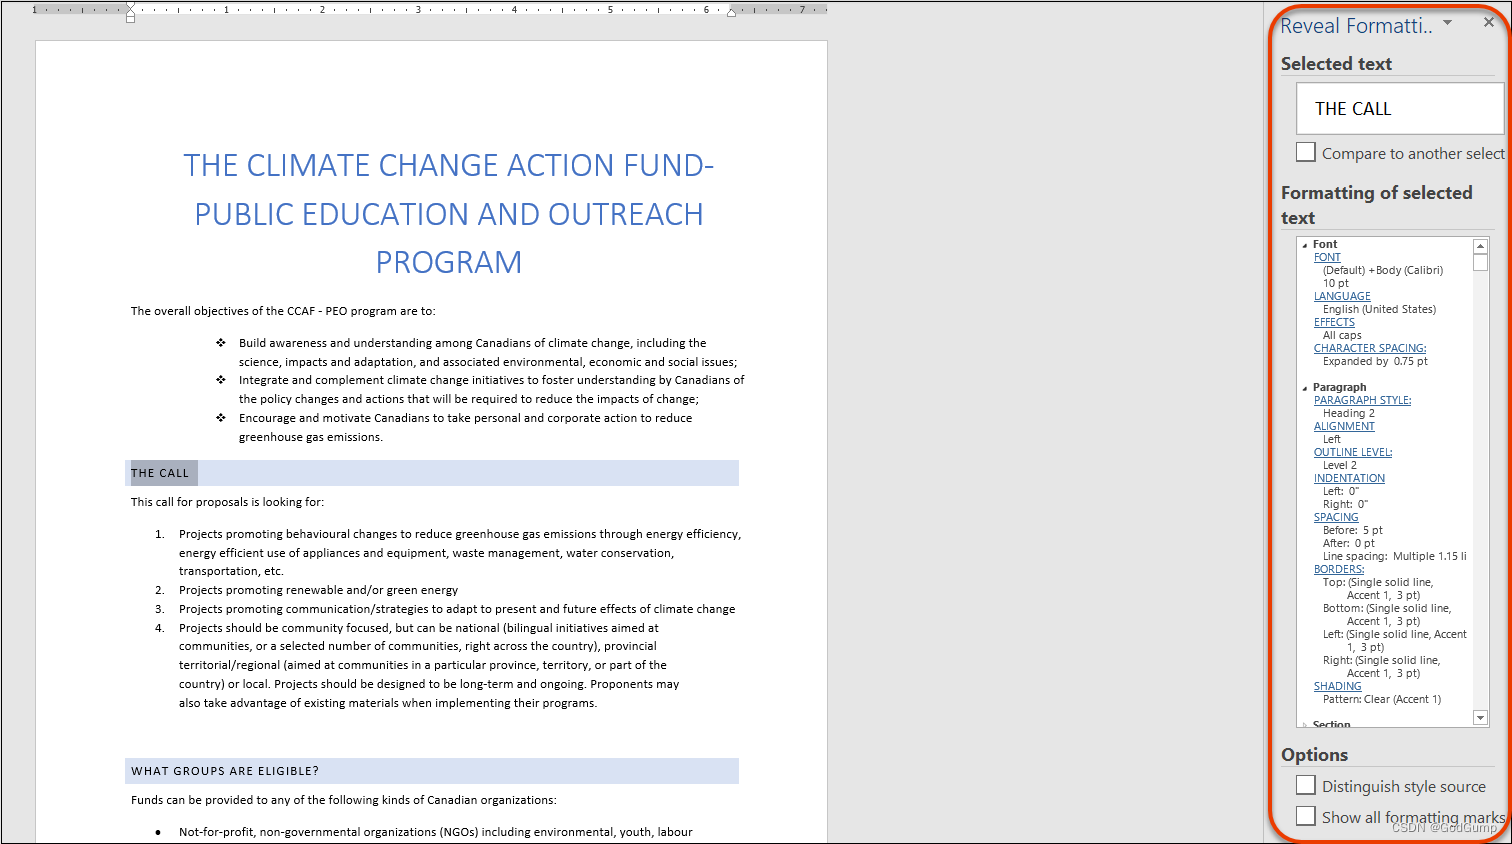
- Select “The Call” heading. Press Shift + F1 to open the Reveal Formatting task pane:
Reveal Formatting task pane opened, “The call” title was selected
(Feel free to resize the task pane if necessary.)
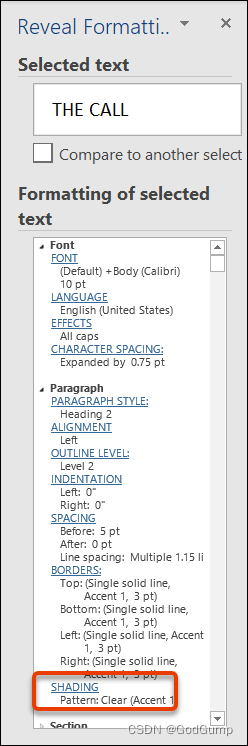
- Click the Shading link to open the appropriate dialog box:
Reveal Formatting dialog box opened, Shading link was clicked
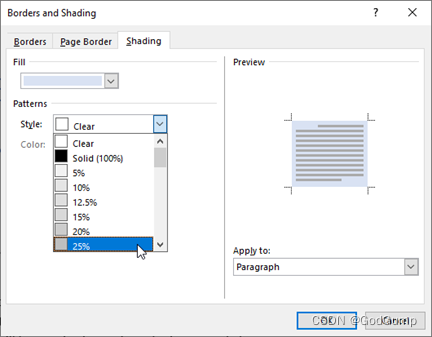
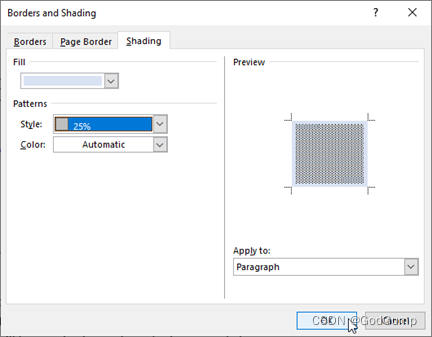
- The Borders and Shading dialog box will open. Click the Style menu and choose 25%:
Borders and Shading opened, Shading tab was clicked and Style 25% option was chosen
- Click “OK:”
Borders and Shading table opened with “OK” button clicked
- You will see the changes reflected in the Reveal Formatting task pane and the document:
Reveal Formatting pane opened, the changes was applied in the title
- You can now close the pane:
Reveal Formatting pane opened with the close icon in the top right
- Click anywhere in the document to de-select the text. Click Home → Replace:
Home table opened, Replace option was chosen
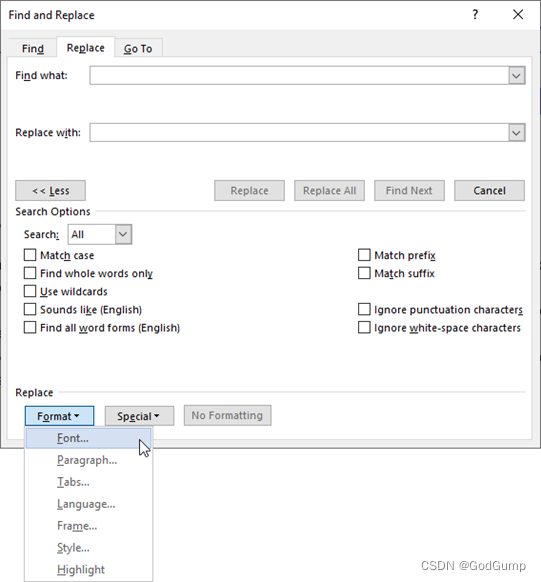
- In the Find and Replace dialog box, click the More button:
Find and Replace dialog box opened, More button was clicked
- Ensure that your cursor is in the “Find what” field. Click Format → Font:
Find and Replace dialog box opened, drop-down arrow in Format button was clicked, Font was chosen
- In the Font dialog box, choose +Body from the Font list and 10 from the Size list. Click “OK:”
The Find Font dialog box opened, +Body option was chosen with the Size 10
- Back in the Find and Replace dialog box, move your cursor to the “Replace with” field. (Also, notice that your font choices appear below the “Find what” field.) Click Format → Font:
Find and Replace dialog box opened, Format drop-down arrow option was clicked, Font was chosen
- In the Font dialog box, choose Calibri Light from the Font list and 12 from the Size list. Click “OK:”
The Replace Font window opened, the Font Calibri Light chosen with the Size 12
- Click “Replace All:”
Find and Replace window opened with the “Replace All” button selected
- Microsoft Word should inform you that it has made 16 replacements. Click “OK” in this dialog box:
Microsoft Word alert box opened, with the number of replacements made, with the “OK” button
- Close the Find and Replace dialog box:
Find and Replace dialog box opened with the curser placed in “Find what:” section
- Review the changes to the document:
The document opened with the changes was applied in the text
- Save your document as Activity 3-7 Complete. Close Microsoft Word 365.
练习:应用边框和底纹
让我们开始吧!
在这个练习中,您将完成我们的示例文档的最后一步。
点击下面的链接打开提供的 Microsoft Word 练习文档:
练习:管理格式
选择“The Call”标题。按下 Shift + F1 键以打开“揭示格式”任务窗格:
揭示格式任务窗格打开,"The Call"标题被选中
(如果需要,可以自由调整任务窗格的大小。)
点击“底纹”链接以打开相应的对话框:
揭示格式对话框打开,点击底纹链接
边框和底纹对话框将打开。点击样式菜单,并选择 25%:
边框和底纹对话框打开,点击底纹选项卡,并选择样式 25%
点击“确定”:
边框和底纹对话框打开,点击确定按钮
您会在“揭示格式”任务窗格和文档中看到变化:
揭示格式窗格打开,标题中的变化已应用

现在可以关闭窗格:
揭示格式窗格打开,右上角关闭图标
在文档中的任意位置点击以取消选中文本。点击“首页”→“替换”:
首页选项卡打开,选择替换选项
在“查找和替换”对话框中,点击“更多”按钮:
查找和替换对话框打开,点击更多按钮
确保光标位于“查找内容”字段中。点击“格式”→“字体”:
查找和替换对话框打开,点击格式按钮的下拉箭头,选择字体选项
在字体对话框中,从字体列表中选择“+Body”,从大小列表中选择“10”。点击“确定”:
查找字体对话框打开,选择了“+Body”字体,大小为10

回到“查找和替换”对话框,将光标移动到“替换为”字段。(同时注意到您的字体选择出现在“查找内容”字段下面。)点击“格式”→“字体”:
查找和替换对话框打开,点击格式按钮的下拉箭头,选择字体选项
在字体对话框中,从字体列表中选择“Calibri Light”,从大小列表中选择“12”。点击“确定”:
替换字体对话框打开,选择了“Calibri Light”字体,大小为12
点击“全部替换”:
查找和替换对话框打开,选择了“全部替换”按钮
Microsoft Word应该会通知您已经进行了16次替换。点击对话框中的“OK”按钮:
Microsoft Word弹出的警告框,显示替换次数,点击“OK”按钮
关闭“查找和替换”对话框:
“查找和替换”对话框打开,光标位于“查找内容”字段
检查文档的更改:
文档已经打开,文本中的更改已应用
将文档保存为“Activity 3-7 Complete”。关闭Microsoft Word 365。
Exercise: Inserting a table
- Click on the link below to open the Microsoft Word exercise document you can use to complete this exercise.
Exercise: Inserting a Table
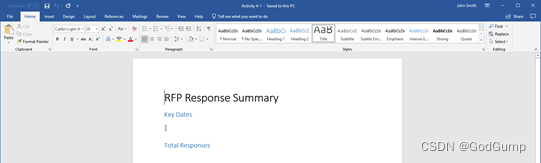
- First, let’s add a Quick Table to the document. Click to place your cursor below the “Key Dates” heading:
Word document opened with the cursor placed below the “Key Dates” subheading
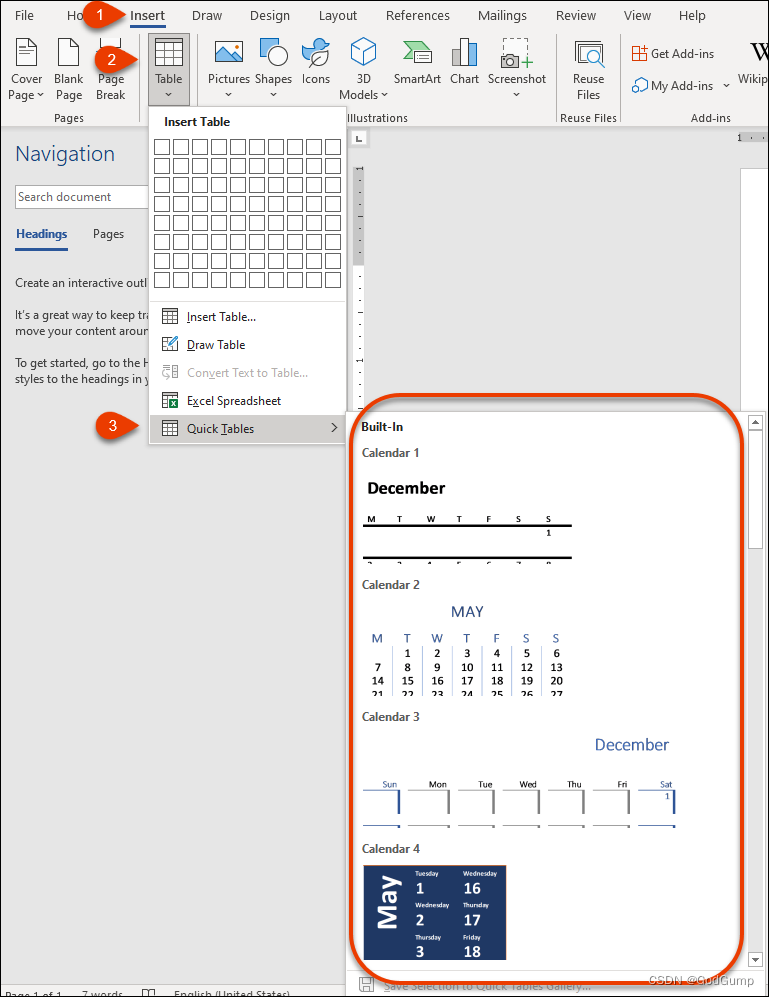
- Then, click Insert → Table:
Insert table opened, “Insert” option chosen
- From the menu, choose Quick Tables and then click any of the calendar options:
Table menu opened, with the style choices
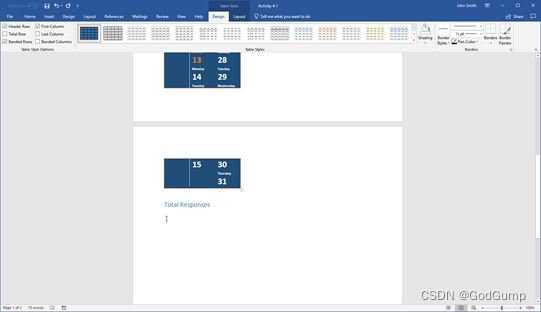
- The table will be inserted. Now, let’s add a table for the first heading. Scroll to the bottom of the document and click to place your cursor under “Total Responses:”
The Word document opened with the table inserted, cursor placed on under “Total Responses” on the bottom of the document
- Click Insert → Table. Drag your mouse over the grid to create a 2x5 table. Click to create it:
“Insert” option selected, Table opened with the grid containing the amount of row and columns options for create a table
- The table will be inserted:
Table inserted in the Word Document under heading
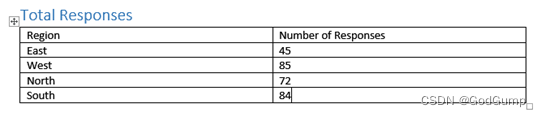
- Fill it out to match the example below by clicking and typing in each cell:
The table was filled with the information
9. Save your document as Activity 4-1 Complete. Close Microsoft Word 365.
练习:插入表格
点击下面的链接以打开Microsoft Word练习文档,您可以用它来完成这个练习。
点我下载
首先,在文档中的“关键日期”标题下方点击以放置光标:
在Word文档中打开,并在“关键日期”标题下方放置光标
然后,点击“插入”→“表格”:
点击“插入”选项卡,打开表格选项

从菜单中选择“快速表格”,然后点击任意日历选项:
打开表格菜单,显示样式选项
表格将被插入。现在,让我们在第一个标题下添加一个表格。滚动到文档底部,并点击以在“总回应数”下方放置光标:
在Word文档中插入了表格,光标放置在“总回应数”下方
点击“插入”→“表格”。拖动鼠标在网格上创建一个2x5的表格,并点击以创建:
选择“插入”选项卡,打开表格并选择行列数量以创建表格
表格将被插入:
表格被插入到标题下方的Word文档中
根据以下示例在每个单元格中点击并输入,填写表格:
表格被填写了信息
将您的文档保存为“Activity 4-1 Complete”。关闭Microsoft Word 365。
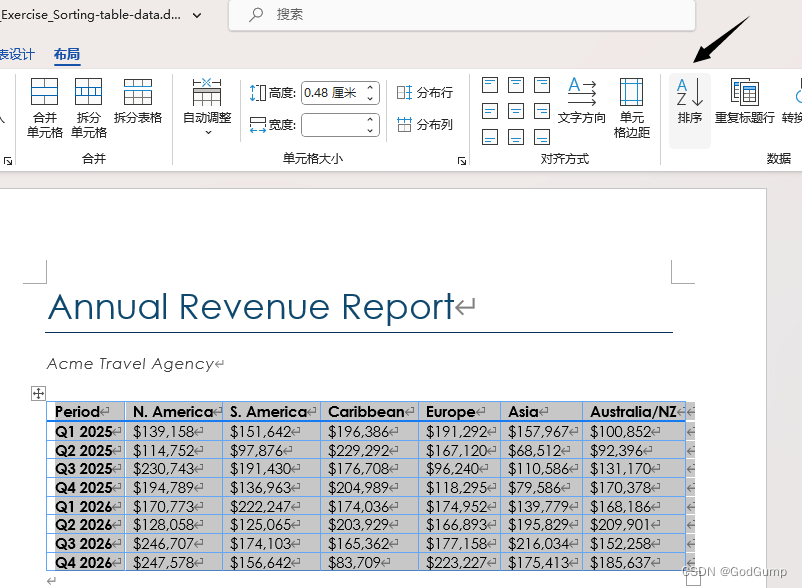
Exercise: Sorting table data
Let’s get started!
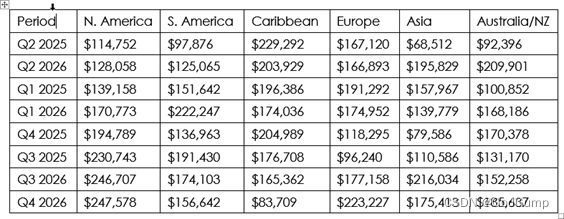
In this exercise, you will sort data in a revenue report.
- Click on the link below to open the Microsoft Word exercise document you can use to complete this exercise.
Exercise: Sorting table data
- Select the first column of the table:
The word document, with a table, the cursor is placed in the first column
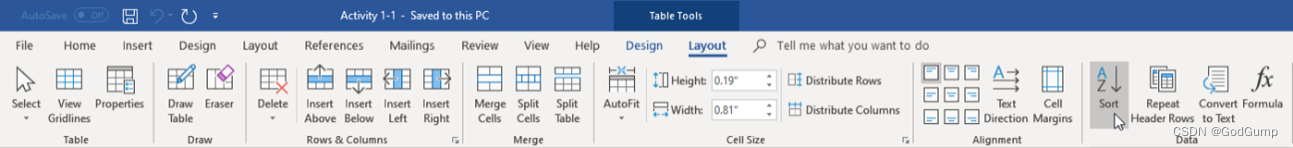
- Click Table Tools – Layout → Sort:
Table tools, Layout was clicked and the Sort option was chosen
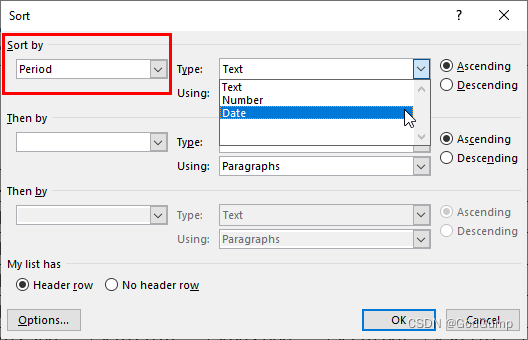
- Ensure that “Period” is displayed in the “Sort by” menu. Click the Type menu and choose “Date:”
Sort dialog table open, in the Sort by option, Period was selected. Type menu was clicked and “Date” option was chosen
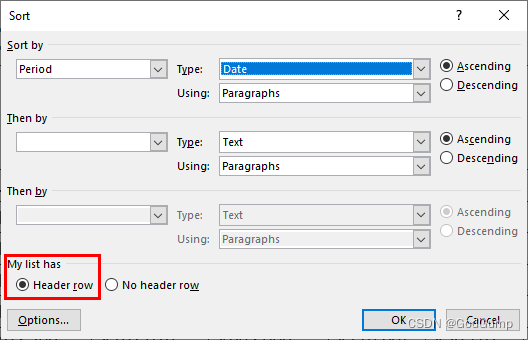
- Ensure that the “Header row” radio button is selected:
Sort dialog table open, Header row was selected
- Click “OK” to perform the sort:
Sort dialog table open, with “OK” button
- The data is now sorted in chronological order:
The table was selected with the data sorted chronologically
- Save your document as Activity 1-1 Complete. Close Microsoft Word 365 to complete this exercise.
练习:表格数据排序
让我们开始吧!
在这个练习中,你将对一份收入报表中的数据进行排序。
点击下面的链接打开Microsoft Word练习文档,你可以使用该文档完成这个练习。
练习:表格数据排序
选择表格的第一列:
在Word文档中,有一个表格,光标位于第一列
点击“表格工具”-“布局”-“排序”:
点击“表格工具”-“布局”,选择“排序”选项
但是我的oiifce2022是在这里
确保“期间”显示在“排序依据”菜单中。点击“类型”菜单,并选择“日期”:
排序对话框打开,选择“排序依据”为“期间”,点击“类型”菜单并选择“日期”选项
确保“标题行”单选按钮被选中:
排序对话框打开,选择了“标题行”
点击“确定”执行排序:
排序对话框打开,有“确定”按钮
数据现在按照时间顺序排序:
表格被选中,数据按照时间顺序排序
将文档保存为“Activity 1-1 Complete”。关闭Microsoft Word 365以完成这个练习。
Exercise: Adding images to a document
Let’s get started!
In this exercise, you will start building a portfolio for a design firm.
- Click on the link below to open the Microsoft Word exercise document you can use to complete this exercise.
Note: Click on the links below to open the set of files that you can use to complete this exercise.
Exercise: Adding images to a document
Exercise: Adding images to a document image
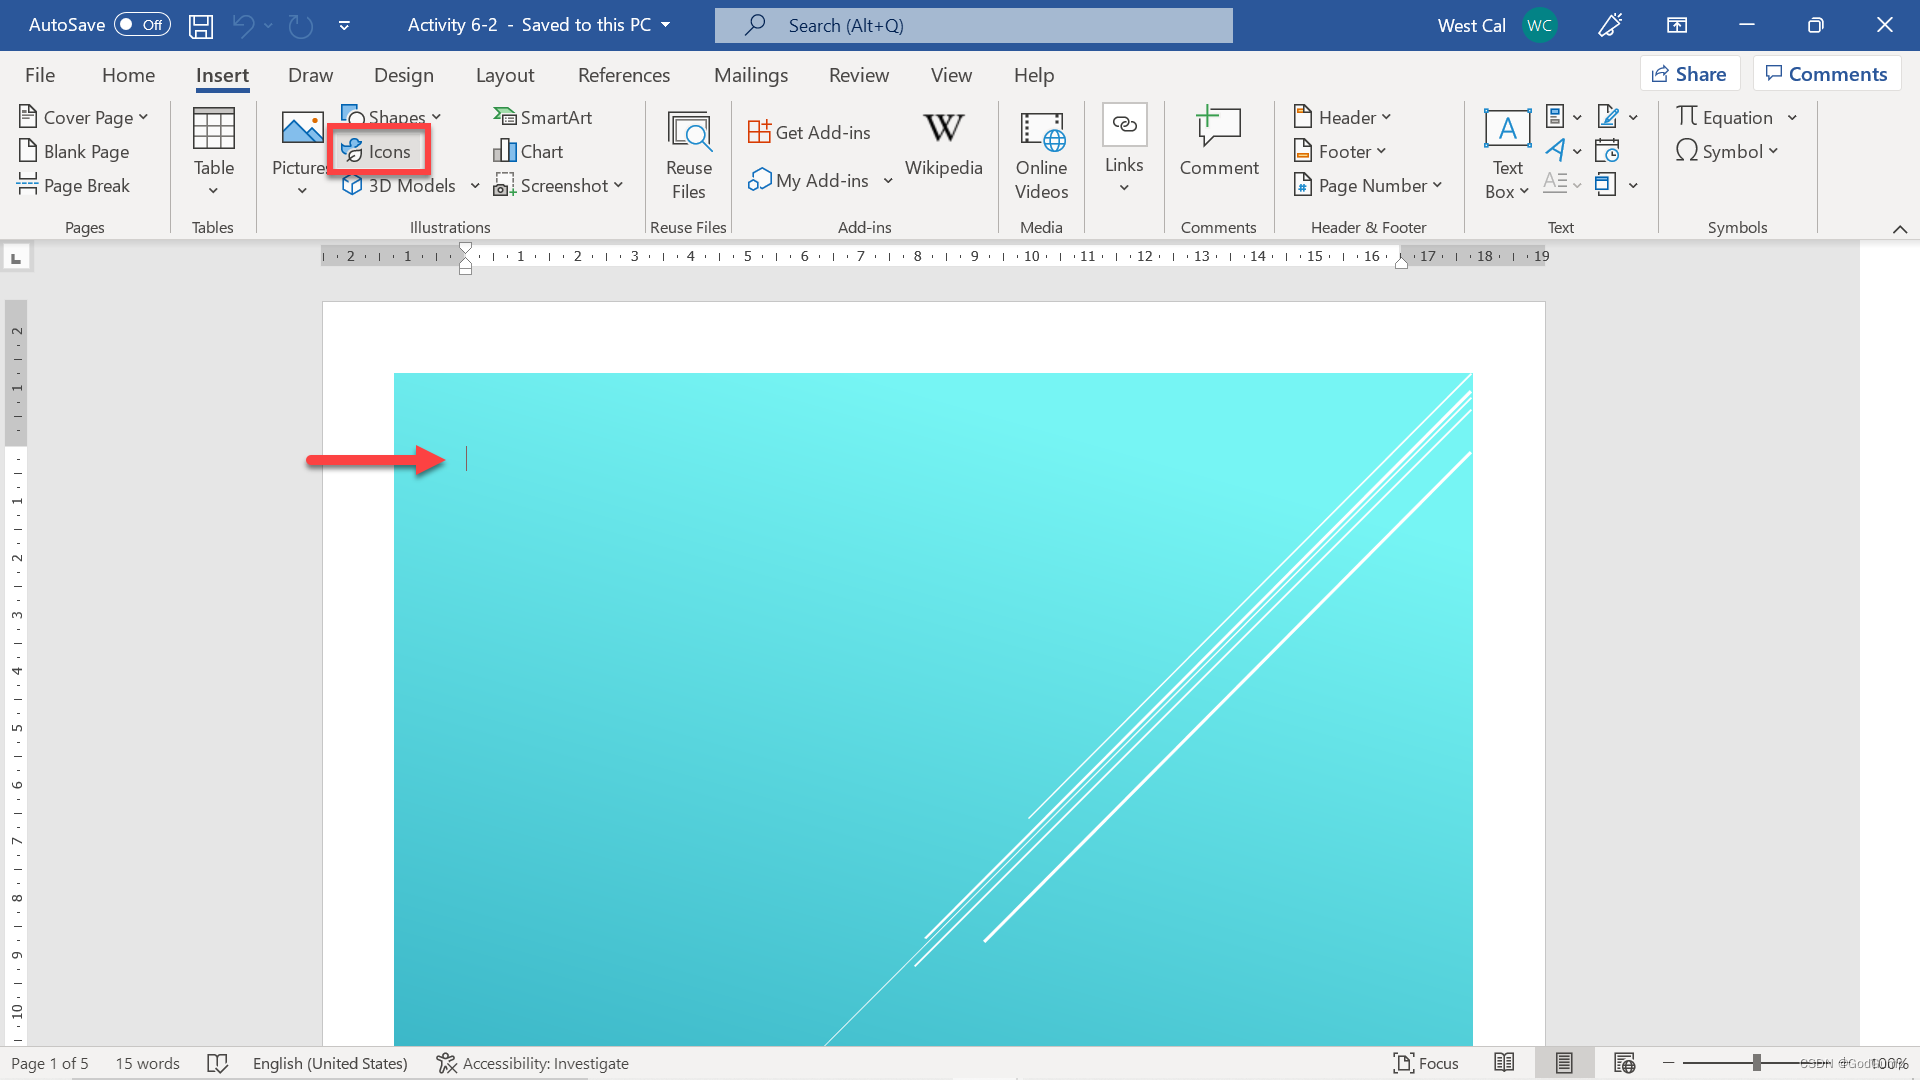
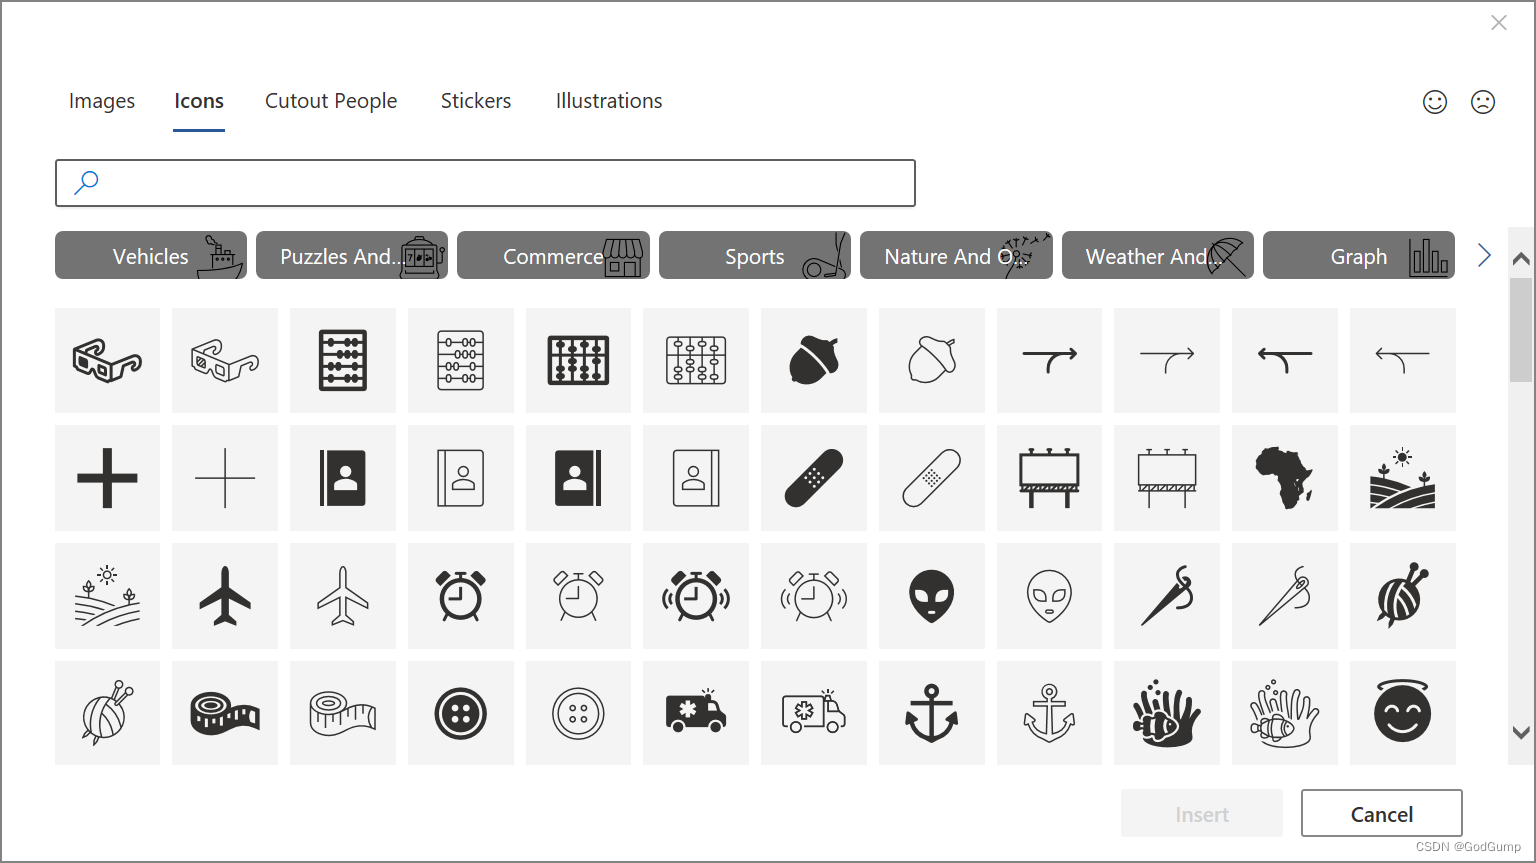
- First, let’s add an icon to the title page. Ensure your cursor is flashing at the top of the title page. Click Insert → Icons:
The cursor position in the document and the Icons button are highlighted.The cursor position in the document and the Icons button are highlighted.
- The Insert Icons dialog box will open.
The Icons dialog box.The Icons dialog box.
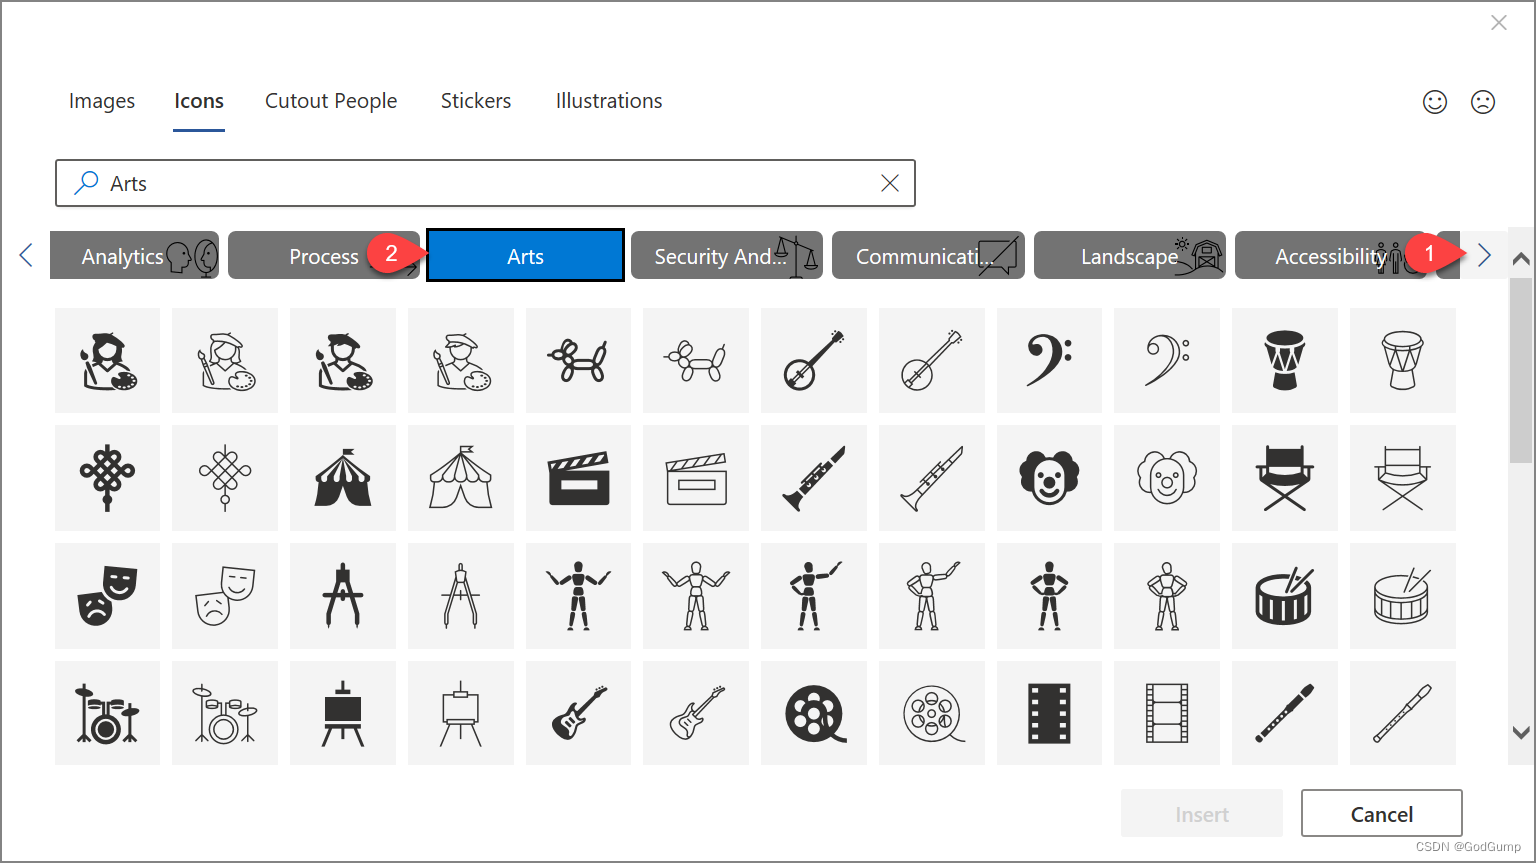
- Click the arrow on the right to locate and then select the Arts category.
Step 1 indicates the search right icon and step 2 indicates the Arts category.Step 1 indicates the search right icon and step 2 indicates the Arts category.
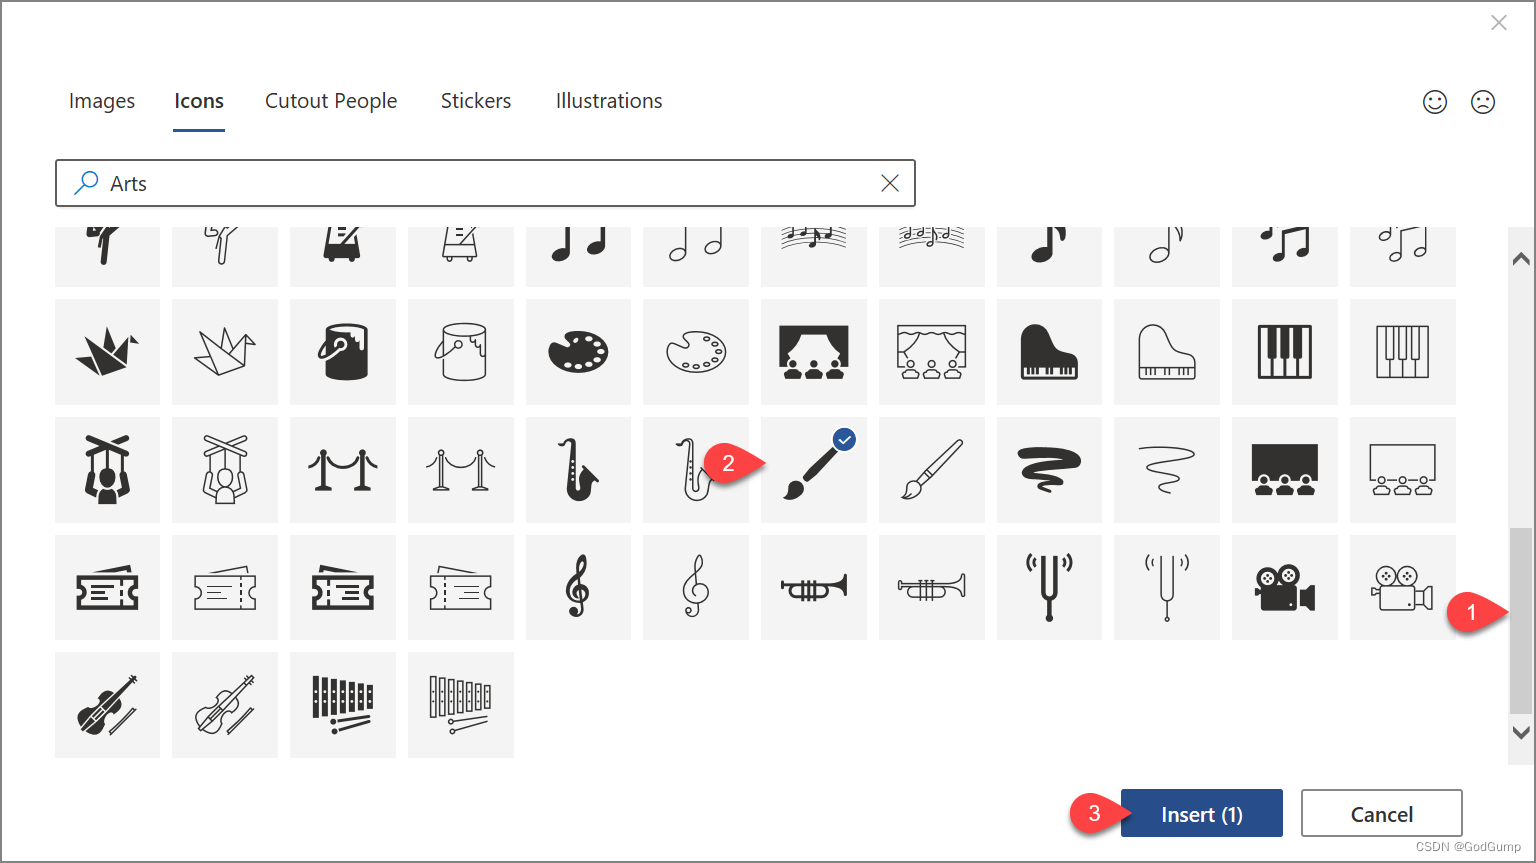
- Scroll down through the icons and click the paintbrush icon to select it. Then, click “Insert:”
Step 1 indicates the vertical scroll bar, step 2 indicates an icon in the menu, and step 3 indicates the Insert button.Step 1 indicates the vertical scroll bar, step 2 indicates an icon in the menu, and step 3 indicates the Insert button.
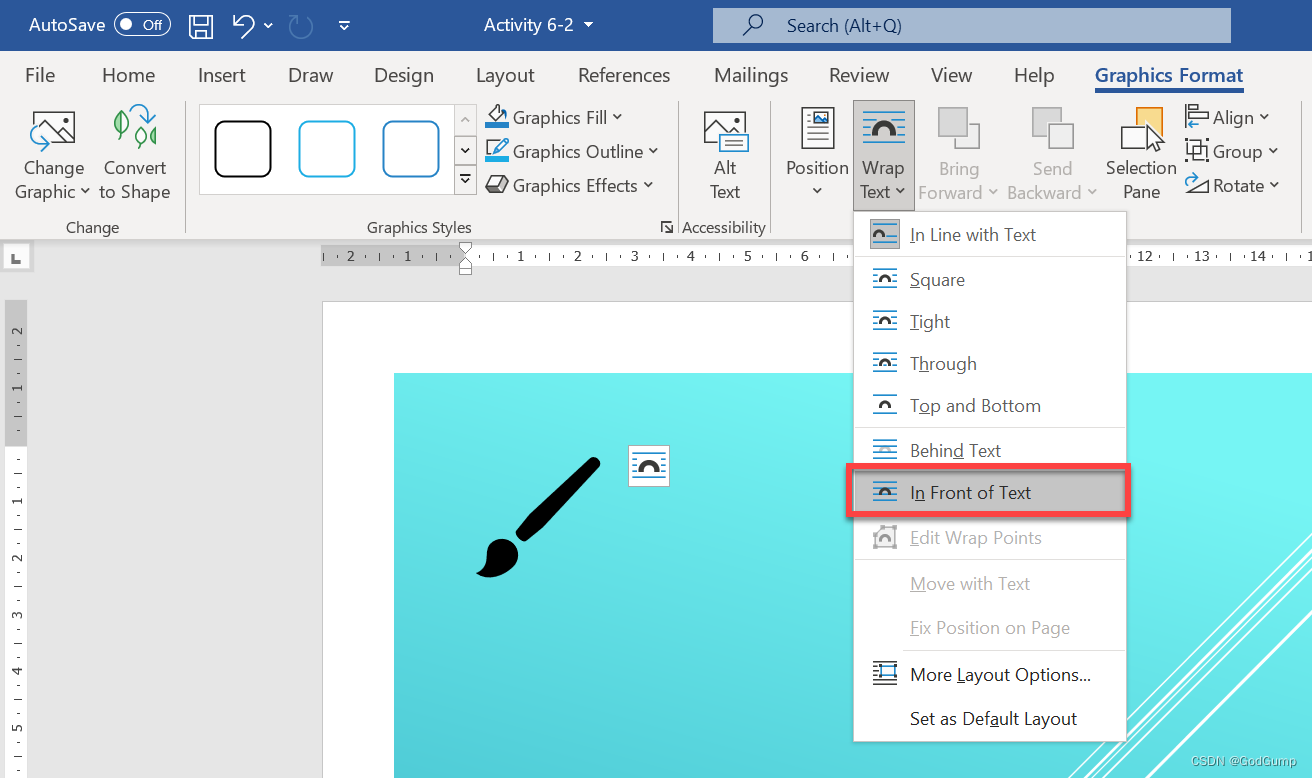
- The icon will be inserted and the Graphics Tools – Format tab will open. On this tab, click Wrap Text → In Front of Text:
The In Front of Text option is highlighted in the Wrap Text dropdown menu.The In Front of Text option is highlighted in the Wrap Text dropdown menu.
- Click and drag the icon over to the top right corner of the page:
The icon has been moved to the right side of the document.The icon has been moved to the right side of the document.
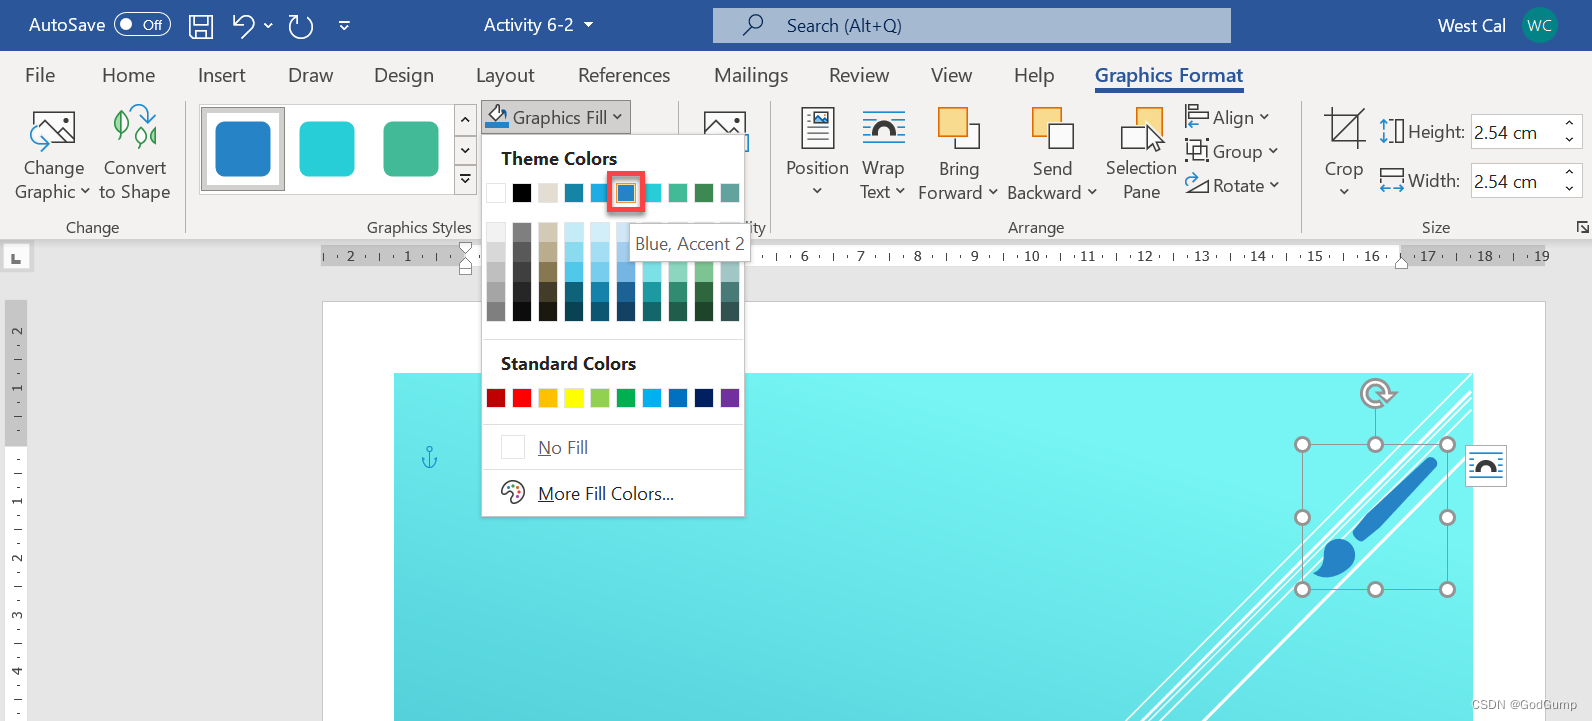
- Finally, let’s recolor it. Click Graphics Fill → Blue, Accent 2:
A color has been added to the icon from the Graphics Fill dropdown menu.A color has been added to the icon from the Graphics Fill dropdown menu.
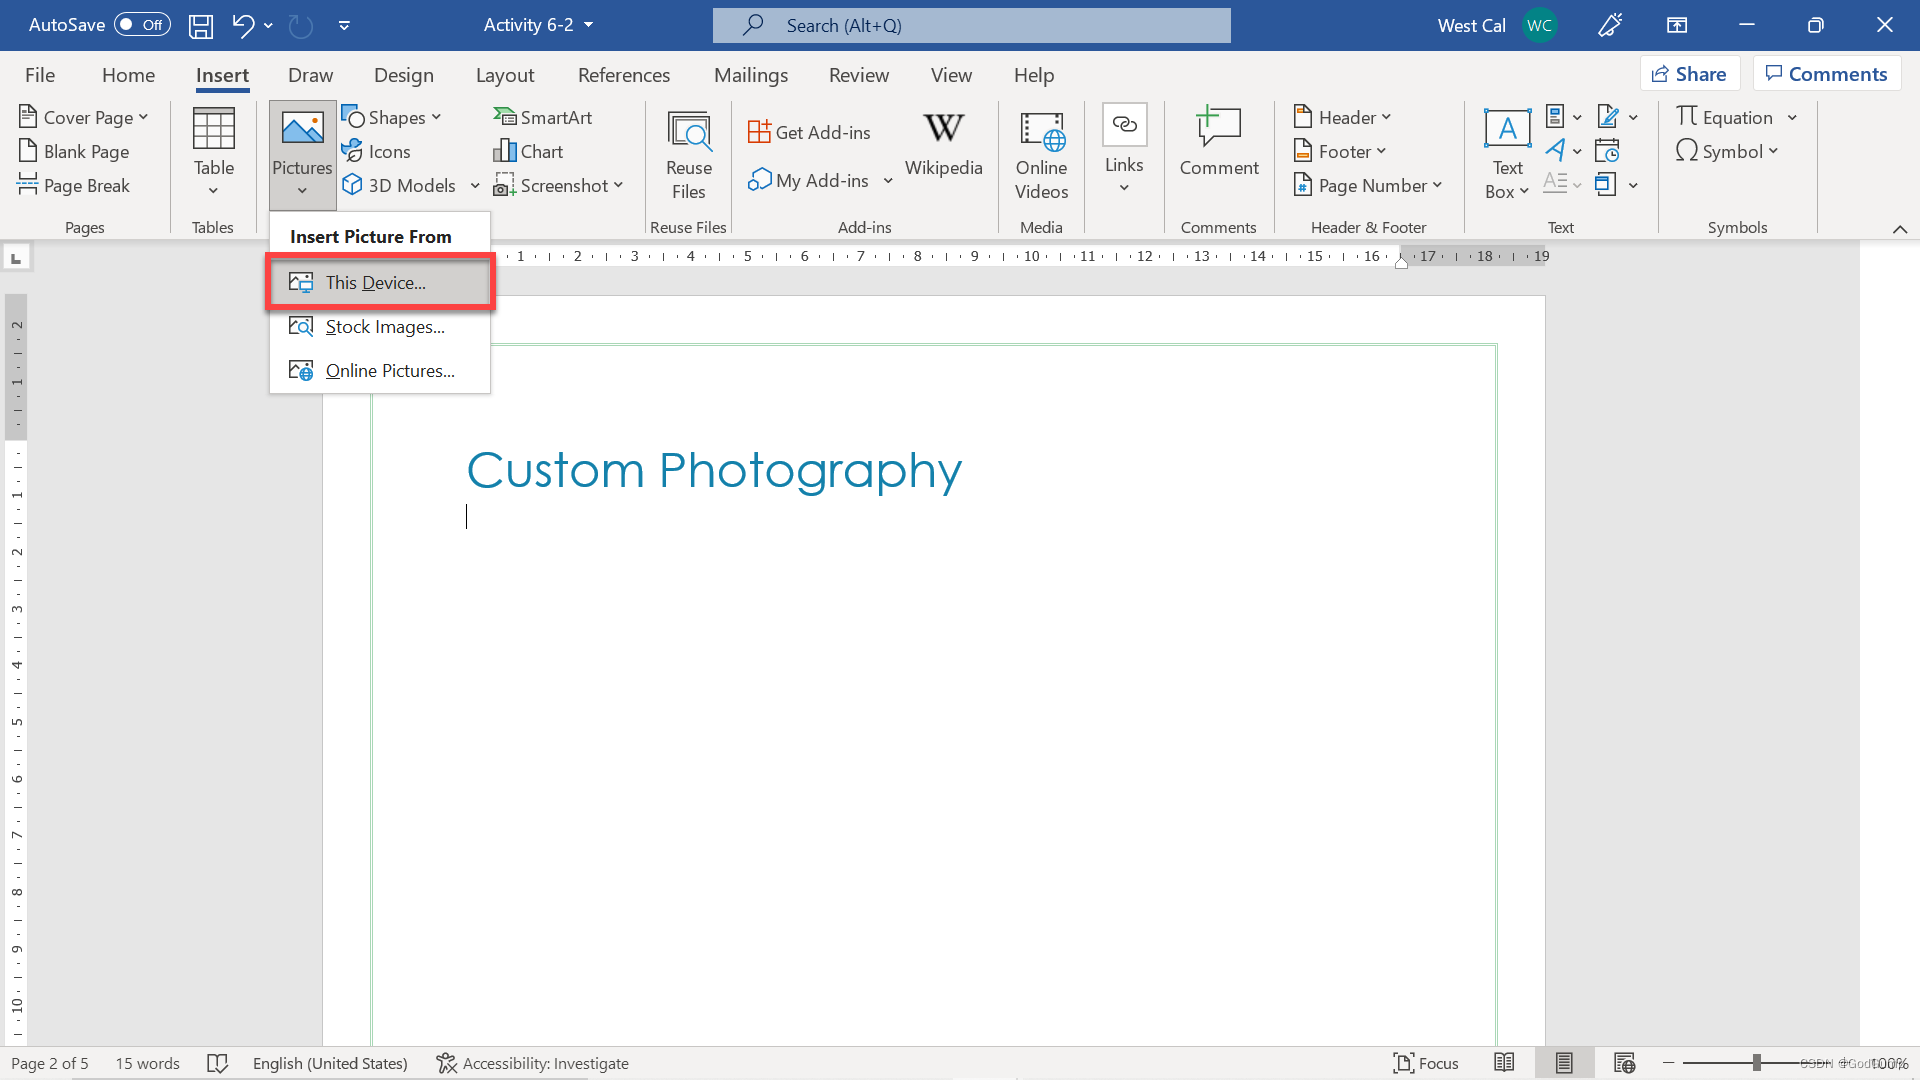
- Now, let’s add some graphic samples. Scroll to the next page and click to place your cursor on the line after the heading. Then, click Insert → Pictures → This Device:
This Device is highlighted in the Pictures dropdown menu.This Device is highlighted in the Pictures dropdown menu.
- Browse to the Lesson 6 folder of your Exercise Files. Select the Exercise: Adding images to a document image file and click “Insert:”
Browse from the Lesson 6 folder opened, Activity 6-2 image file selected and “Insert” was clicked
- The image will be inserted and the Picture Tools – Format tab will be displayed:
A picture has been added to the document.A picture has been added to the document.
- Now, let’s add a screenshot. Scroll to the last page of the document and click to place your cursor after the heading:
The last page from the word document the cursor was placed after the heading
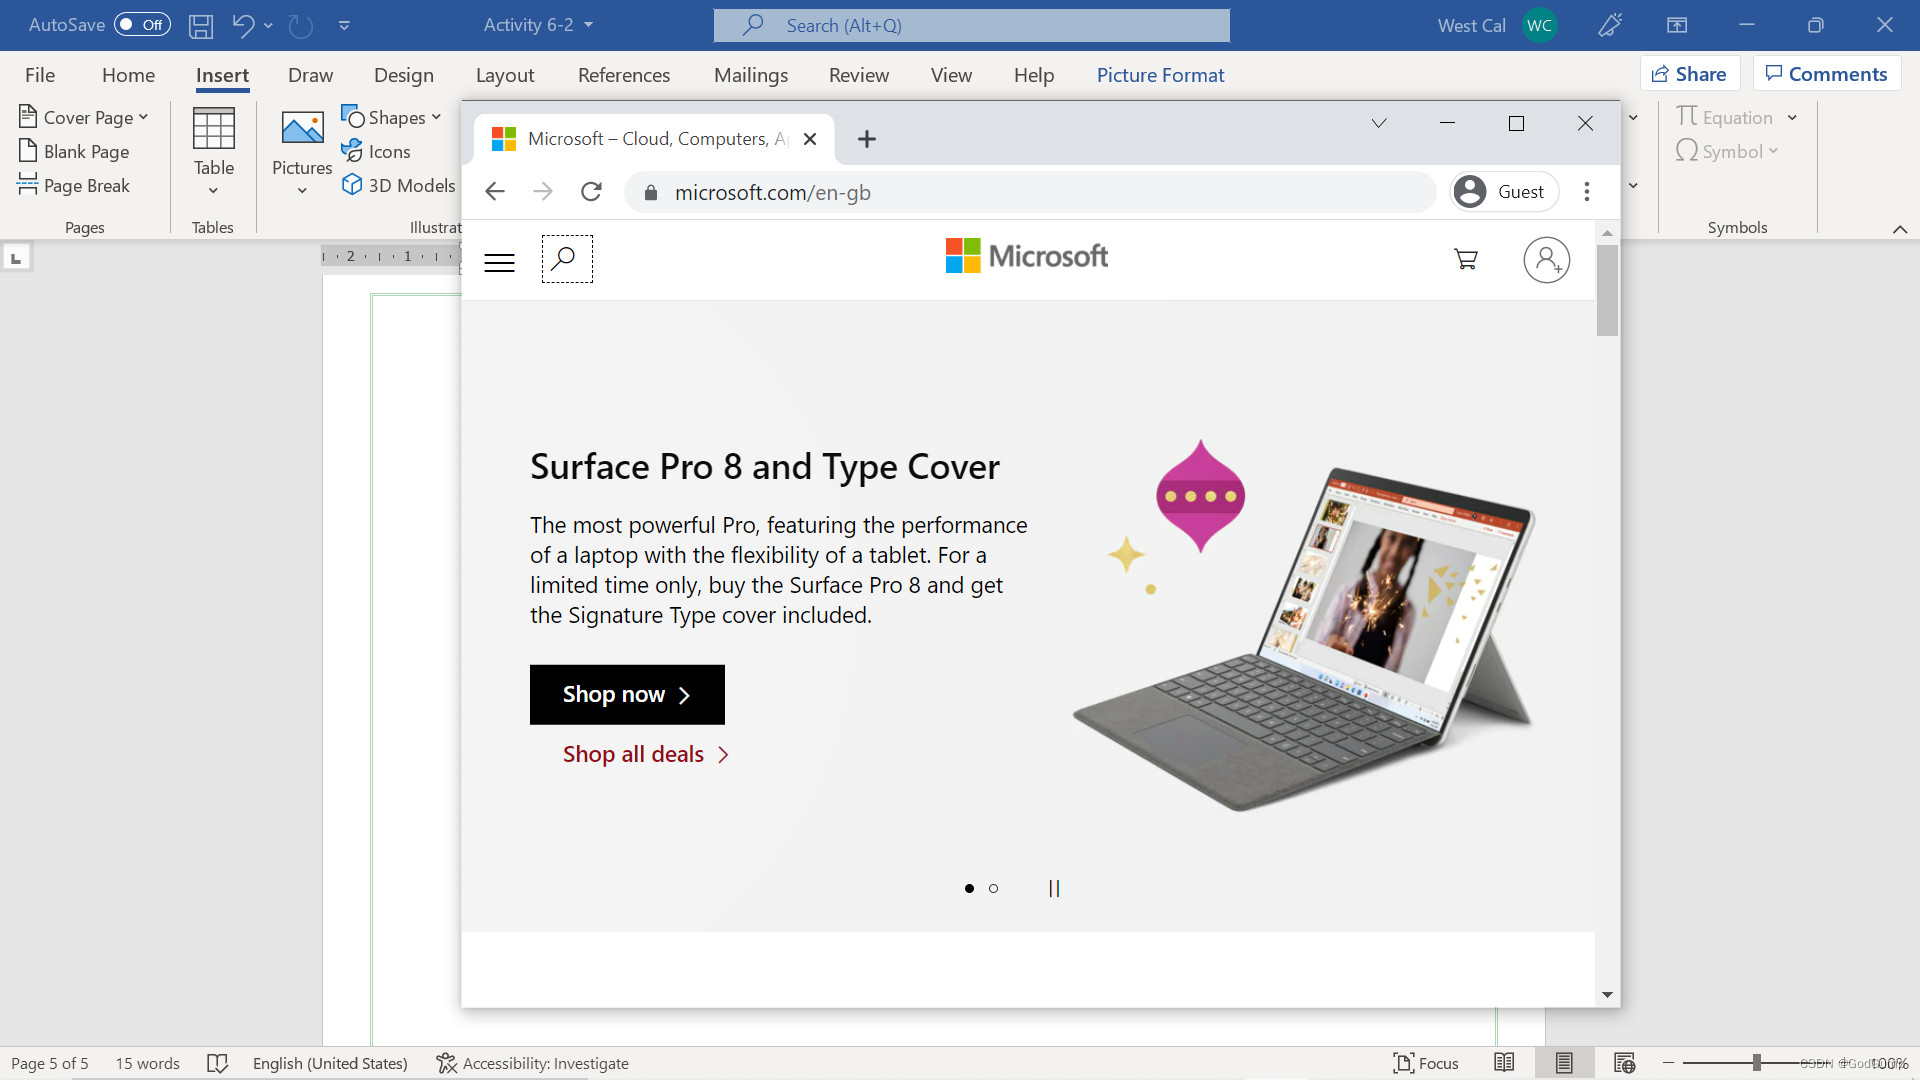
- Open your internet browser and navigate to www.microsoft.com:
The Microsoft webpage is open in a browser window.The Microsoft webpage is open in a browser window.
- Switch back to Microsoft Word. Click Insert → Screenshot and click the Internet Explorer image:
The Available window is highlighted in the Insert Screenshot dropdown menu.The Available window is highlighted in the Insert Screenshot dropdown menu.
- The image will be inserted:
A screenshot of the Microsoft webpage has been added to the document.A screenshot of the Microsoft webpage has been added to the document.
- Save your document as Activity 6-2 Complete and close Microsoft Word 365.
练习:向文档添加图像
让我们开始吧!
在这个练习中,您将开始为一个设计公司建立一个作品集。
点击下面的链接打开 Microsoft Word 练习文档,您可以使用它来完成这个练习。
注意:点击下面的链接打开一组文件,您可以使用这些文件来完成这个练习。
首先,在标题页上添加一个图标。确保您的光标在标题页的顶部闪烁。点击插入 → 图标:
文档中的光标位置和图标按钮被突出显示。文档中的光标位置和图标按钮被突出显示。
插入图标对话框会打开。
图标对话框。图标对话框。
点击右侧的箭头,找到并选择艺术类别。
步骤1指示搜索右侧的图标,步骤2指示艺术类别。步骤1指示搜索右侧的图标,步骤2指示艺术类别。
向下滚动查看图标,点击油漆刷图标以选择它。然后,点击“插入”:
步骤1指示垂直滚动条,步骤2指示菜单中的图标,步骤3指示插入按钮。步骤1指示垂直滚动条,步骤2指示菜单中的图标,步骤3指示插入按钮。
图标将被插入,图形工具 - 格式选项卡将打开。在此选项卡上,点击环绕文本 → 文本前:
“文本前”选项在环绕文本下拉菜单中被突出显示。“文本前”选项在环绕文本下拉菜单中被突出显示。
点击并拖动图标到页面的右上角:
图标已被移动到文档的右侧。图标已被移动到文档的右侧。

最后,让我们对其重新上色。点击图形填充 → 蓝色,强调 2:
从图形填充下拉菜单中为图标添加了颜色。从图形填充下拉菜单中为图标添加了颜色。
现在,让我们添加一些图形示例。滚动到文档的下一页,并点击以将光标放在标题后的一行上。然后,点击插入 → 图片 → 此设备:
此设备在图片下拉菜单中被突出显示。此设备在图片下拉菜单中被突出显示。
浏览到你的练习文件中的第六课文件夹。选择"Exercise: Adding images to a document image"文件,然后点击"插入"。
从第六课文件夹中选择了"Exercise: Adding images to a document image"文件,并点击了"插入"。
图片将被插入,"图片工具-格式"选项卡将显示。
一张图片已经被添加到文档中。一张图片已经被添加到文档中。
现在,让我们添加一个屏幕截图。滚动到文档的最后一页,并点击标题后面放置光标。
光标被放置在文档的最后一页标题后面。
打开你的互联网浏览器,导航到www.microsoft.com。
Microsoft网页在浏览器窗口中打开。
切换回Microsoft Word。点击"插入" → “屏幕截图”,然后点击Internet Explorer图像。
“插入屏幕截图"下拉菜单中突出显示了"可用窗口”。

图像将被插入:
Microsoft网页的屏幕截图已被添加到文档中。

将文档保存为"Activity 6-2 Complete",然后关闭Microsoft Word 365。
Exercise: Adjusting image appearance
Let’s get started!
In this exercise, you will try some different image manipulation techniques on your portfolio.
- Click on the link below to open the Microsoft Word exercise document you can use to complete this exercise.
Exercise: Adjusting image appearance
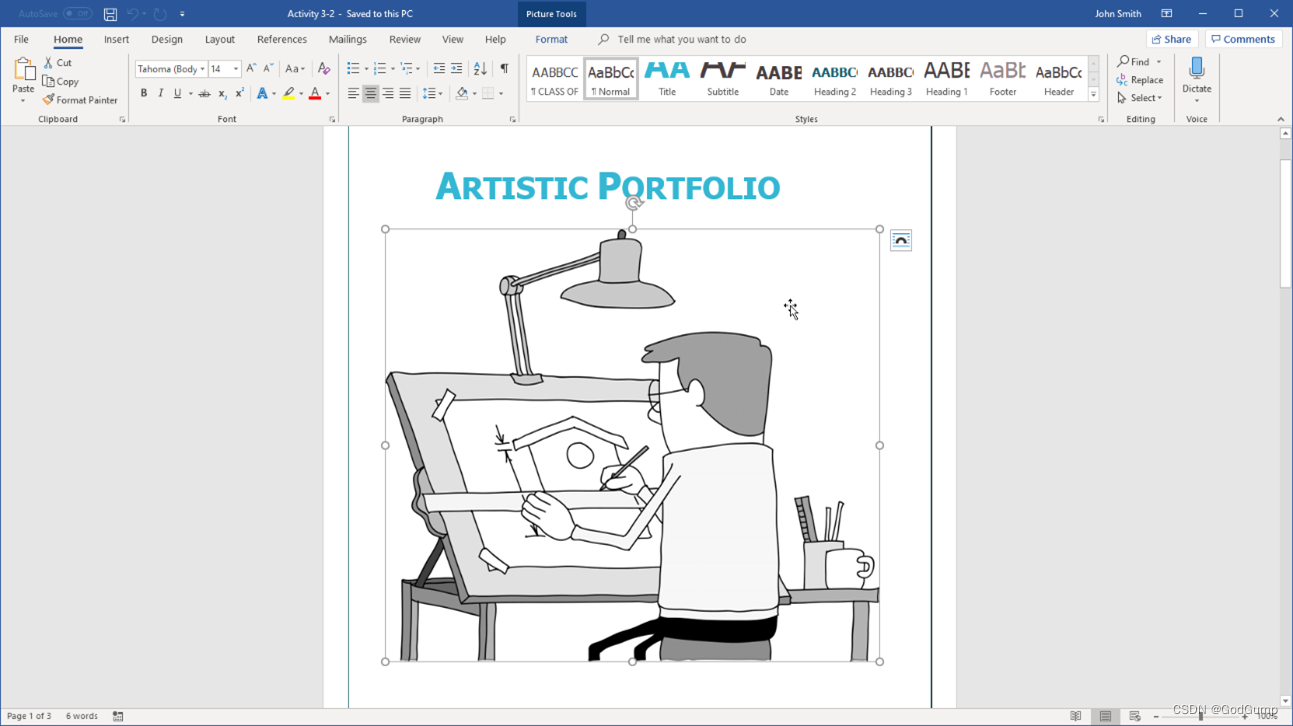
- Click the image on the first page of the document to select it:
The Word document open with image selected
(Adjust your zoom level if necessary.)
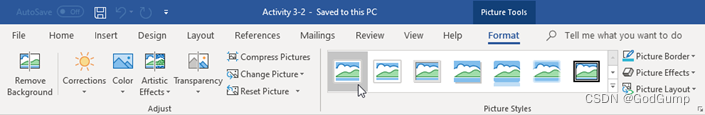
- Click the Picture Tools – Format tab. Choose any style you like from the Picture Styles gallery by clicking its thumbnail:
Pictures tools selected, format table was clicked, picture styles options opened, first style was chosen
- Scroll to the second page of the document. Click the second logo:
The second page of the Word document was open, second logo was clicked
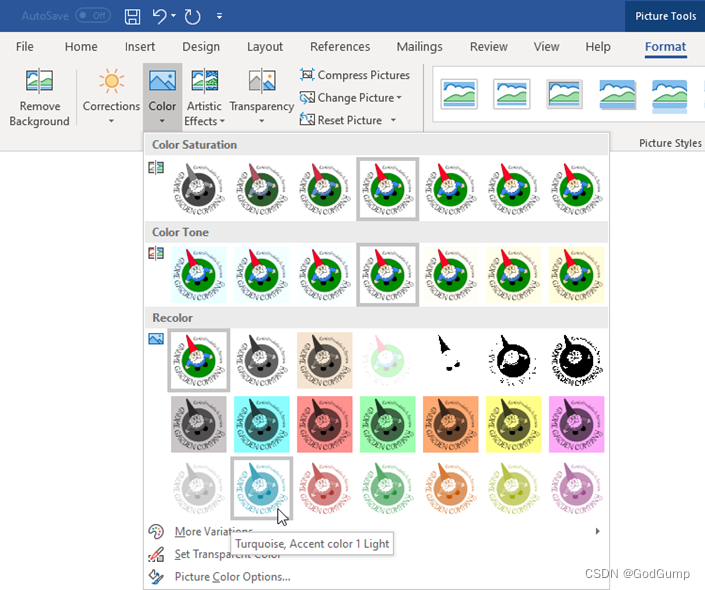
- Let’s change the color of this logo so it matches the document. Click Picture Tools – Format → Color → Turquoise, Accent color 1 Light:
Picture tools was clicked, Format, Color, Turquoise was selected, Accent color 1 light was chosen
- Now, hold the Ctrl key and click all three logos to select them:
The Word document open with all three logos selected
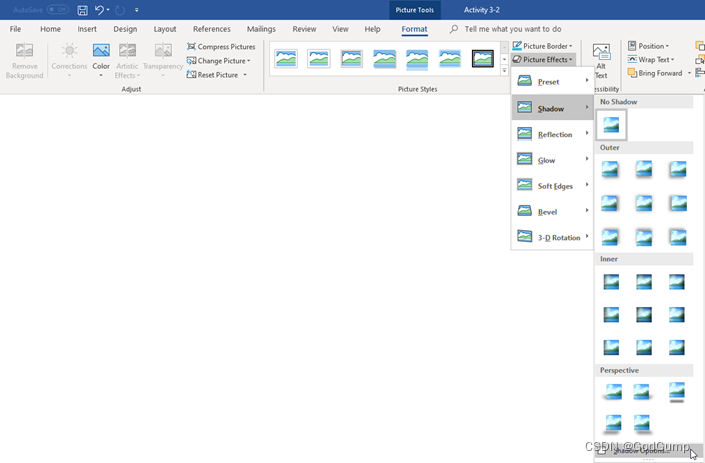
- Click Picture Tools – Format → Picture Effects → Shadow → Shadow Options:
Picture Tools selected, Format, Picture Effects and Shadow was selected, a pane of the Shadow option was opened
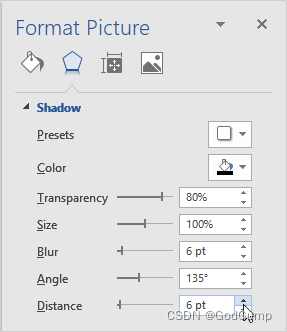
- The Format Picture task pane will open to the Effects category, with the Shadow category expanded. Click the Presets button and choose “Perspective Lower Left:”
A format Picture task pane was opened from the Effects category, “Perspective Lower Left” option was chosen
- Increase the Distance to 6 pt:
Format Picture pane open, the Distance field typed 6 pt
- Review the changes to the logos:
The Word document open, the changes was applied in the three logos
- Close the Format Picture task pane:
Format Picture window open with the close option on the top right side
- Save your document as Activity 3-2 Complete and close Microsoft Word 365.
练习:调整图片外观
让我们开始!
在这个练习中,您将在您的作品集中尝试一些不同的图片处理技巧。
点击下面的链接,打开Microsoft Word练习文档,您可以使用它来完成这个练习。
练习:调整图片外观
点击文档第一页上的图片,以选中它:
Microsoft Word文档打开,图片被选中
(如果需要的话,调整缩放级别。)
点击图片工具-格式选项卡。从图片样式库中选择任何您喜欢的样式,通过点击其缩略图:
选择了图片工具,点击了格式选项卡,打开了图片样式选项,选择了第一个样式。
滚动到文档的第二页。点击第二个徽标:
Microsoft Word文档的第二页被打开,点击了第二个徽标。

让我们将这个徽标的颜色更改为与文档匹配。点击图片工具-格式→颜色→青绿色,强调色 1 浅色:
点击了图片工具,格式,颜色,选择了青绿色,强调色 1 浅色。
现在,按住Ctrl键,点击所有三个徽标以选中它们:
Microsoft Word文档中所有三个徽标都被选中。

点击图片工具-格式→图片效果→阴影→阴影选项:
选择了图片工具,格式,图片效果和阴影,打开了阴影选项的面板。
格式图片任务窗格将打开到效果类别,其中阴影类别展开。点击预设按钮,选择“透视左下:”
从效果类别打开了格式图片任务窗格,选择了“透视左下”选项。

将距离增加到6磅:
格式图片窗格打开,距离字段输入6磅。
检查徽标的更改:
Microsoft Word文档打开,三个徽标的更改已应用。

关闭格式图片任务窗格:
格式图片窗口打开,右上角有关闭选项。
将您的文档保存为“Activity 3-2 Complete”,然后关闭Microsoft Word 365。
Exercise: Creating text boxes
Let’s get started!
In this exercise, you will add two text boxes to an annual report.
- Click on the link below to open the Microsoft Word exercise document you can use to complete this exercise.
Exercise: Creating text boxes
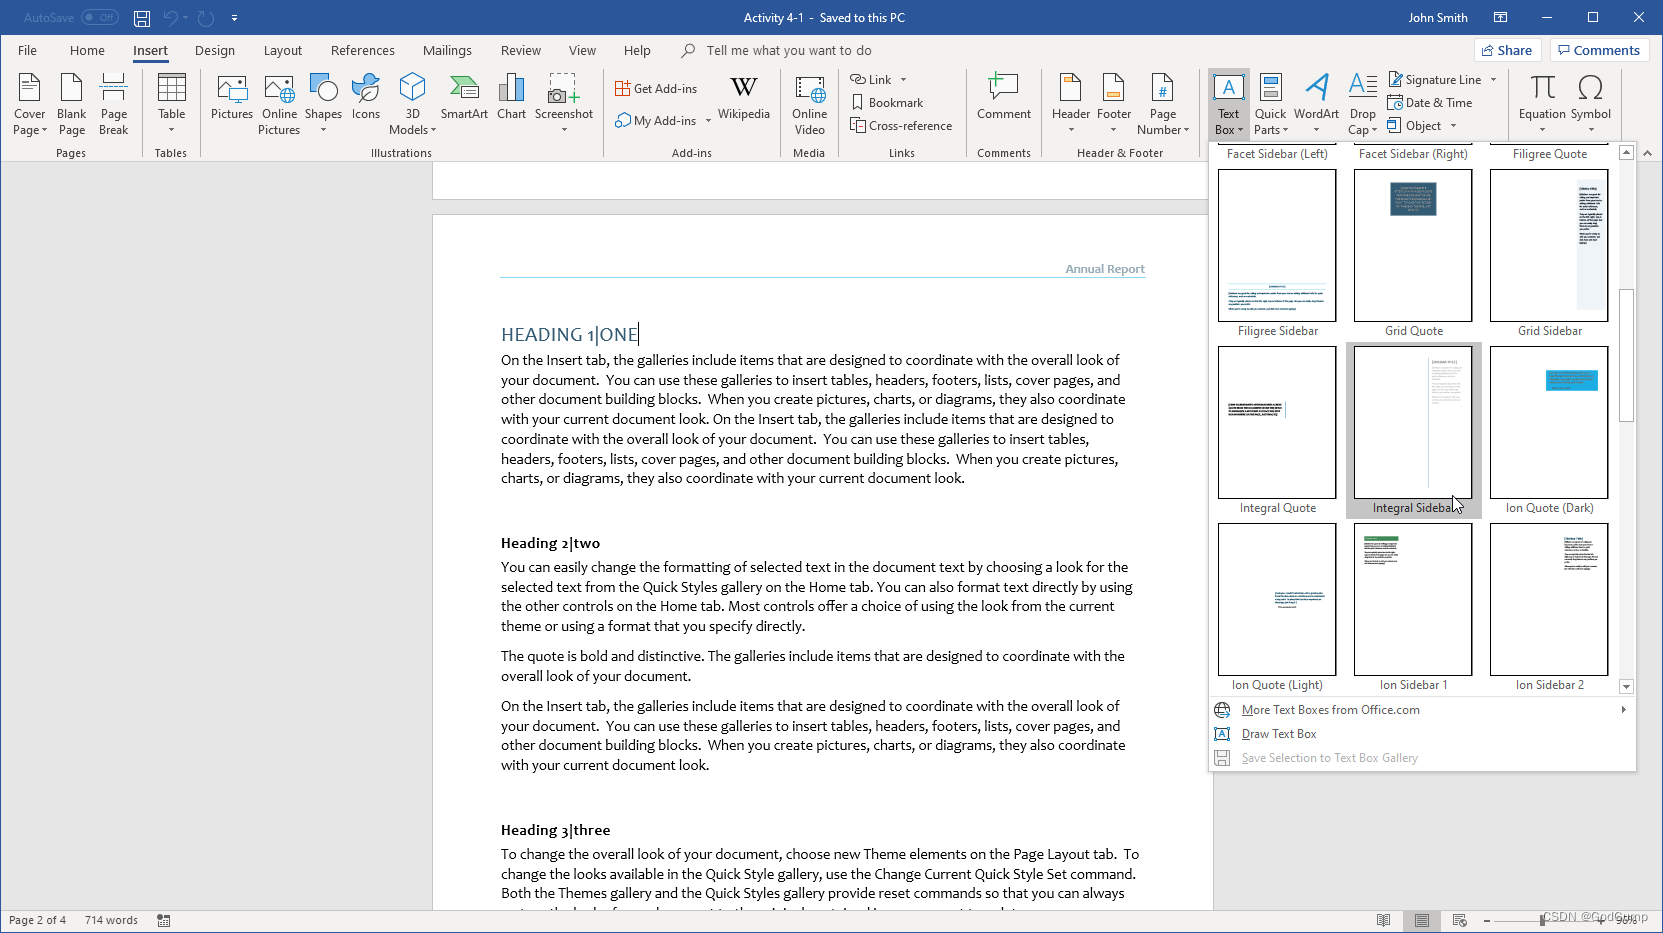
- Scroll to the second page of the document. Click to place your cursor anywhere in that page. Then, click Insert → Text Box → Integral Sidebar:
Word document open, Insert option, Text Box and Integral Sidebar were clicked
(The current theme is Integral, so this will help us keep our design consistent.)
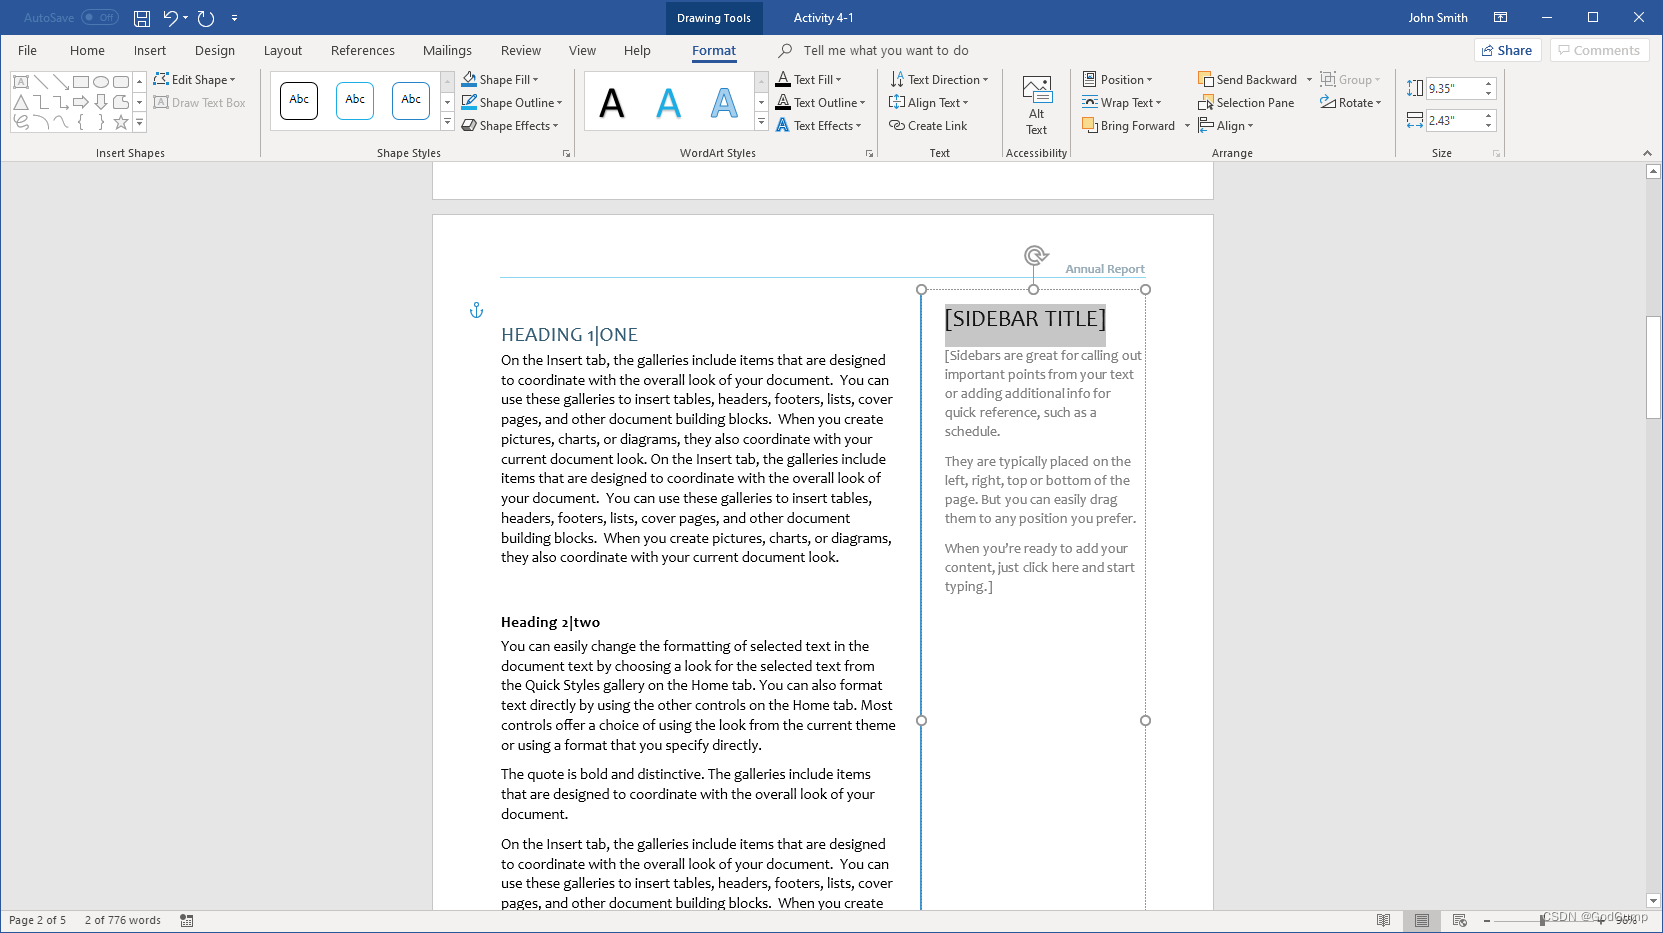
- The sidebar will be added and the Drawing Tools – Format tab will open:
Word document open, the Side Bar opened
- Let’s leave the placeholder text in the sidebar for now, and add a second text box. Scroll to the fourth page and click below the text to place your cursor there:
Word document open, cursor placed at the end or the text
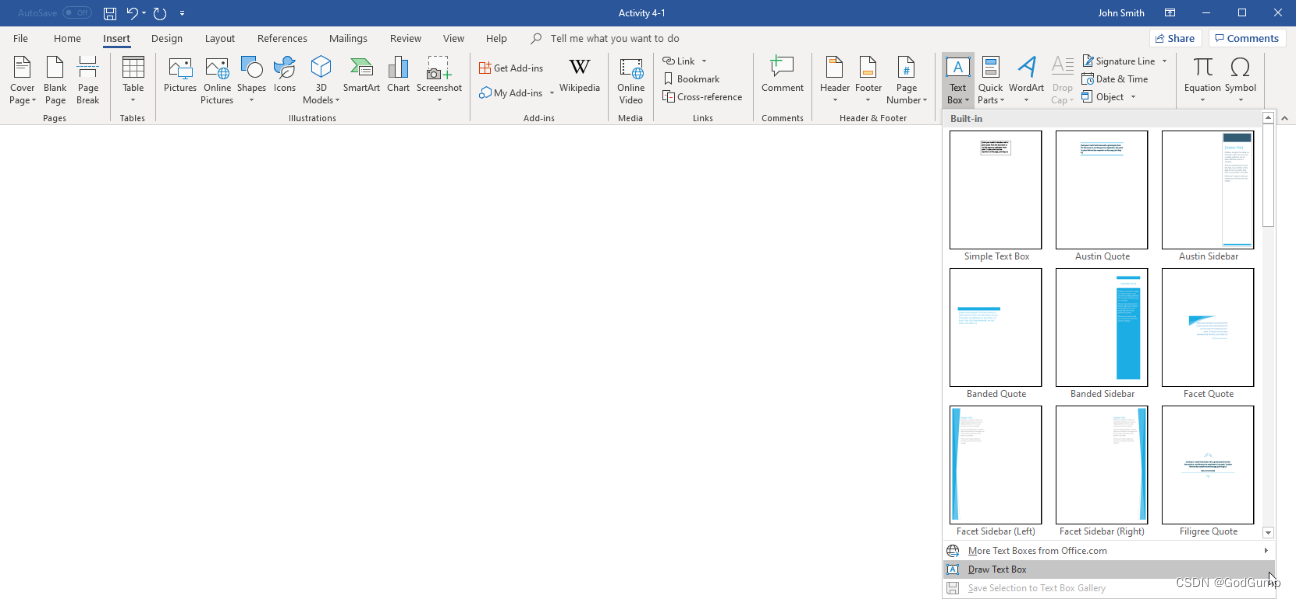
- Click Insert → Text Box → Draw Text Box:
Insert table was selected, Text box was clicked and Draw Text Box was chosen.
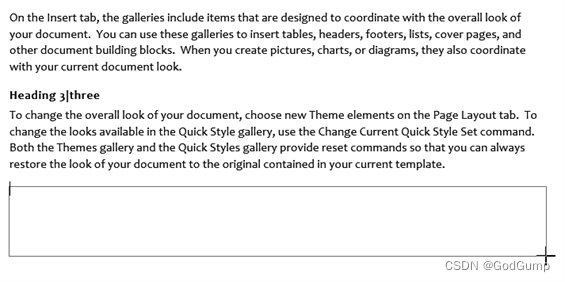
- Click and drag to draw a text box the width of the text, approximately the height shown below:
Word document open with a text box was inserted under the text for “Heading 3”
- Click inside the text box and type the information shown below:
Word document open with the text information added inside the box
(If necessary, use the round handles on the text box to resize it.)
- Select the first line in the text box. Click the Drawing Tools – Format tab and apply any WordArt style you like to it:
Word document open, Drawing Tools was selected, Format tab was clicked and WordArt style was chosen
9. For now, save your document as Activity 4-1 Complete and close Microsoft Word 365.
练习:创建文本框
让我们开始吧!
在这个练习中,您将在一份年度报告中添加两个文本框。
点击下面的链接打开Microsoft Word练习文档,您可以用它来完成这个练习。
创建文本框的练习文档
滚动到文档的第二页。在该页的任意位置点击鼠标左键,然后点击插入选项卡,再点击“文本框”按钮下的“Integral Sidebar”选项:
在Microsoft Word中插入Integral Sidebar文本框
(当前主题是Integral,这样可以保持设计的一致性。)
侧边栏将被添加,并且“绘图工具 - 格式”选项卡将会打开:
在Microsoft Word中打开侧边栏文本框
现在先保留侧边栏中的占位文本,然后我们再添加一个第二个文本框。滚动到文档的第四页,在文本下面点击鼠标左键以放置光标:
在Microsoft Word中放置光标在文本下方

点击插入选项卡,再点击“文本框”按钮下的“绘制文本框”选项:
在Microsoft Word中绘制文本框
点击并拖动鼠标以绘制一个文本框,使其宽度与文本一致,高度大约如下所示:
在Microsoft Word中绘制文本框

点击文本框内部并输入下面所示的信息:
在Microsoft Word中输入文本框中的信息
(如有必要,可以使用文本框周围的圆形手柄调整其大小。)

选择文本框中的第一行文本。点击“绘图工具 - 格式”选项卡,并应用您喜欢的任何WordArt样式:
在Microsoft Word中应用WordArt样式
现在,将文档另存为“Activity 4-1 Complete”,然后关闭Microsoft Word 365。
Exercise: Applying a page border and color
Let’s get started!
In this exercise, you will add page formatting to a document.
- Click on the link below to open the Microsoft Word exercise document you can use to complete this exercise.
Exercise: Applying a page border and color
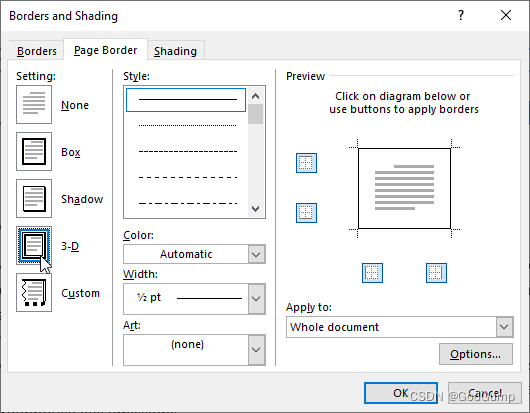
- First, let’s add a border to the title page. Ensure that your cursor is on that page and then click Design → Page Borders:
Design tab with Page Borders option selected
- Choose a 3-D border style:
Borders and Shading dialog box open with 3-D border style chosen
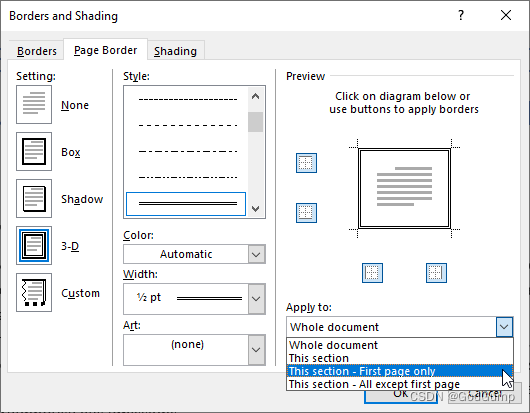
- Scroll down in the Style list and choose a double solid line:
Borders and Shading dialog box open, double solid line chosen from the Style section
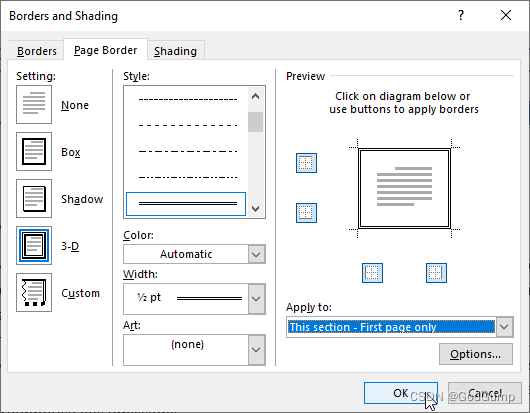
- The Color and Width settings look great, so we will leave those settings at their default options. Click the “Apply to” drop-down menu and choose “This section – first page only:”
Borders and Shading dialog box open, “This section - First page only” selected from Apply to section
- Click “OK” to create your border:
Borders and Shading dialog box open, with “OK” button clicked
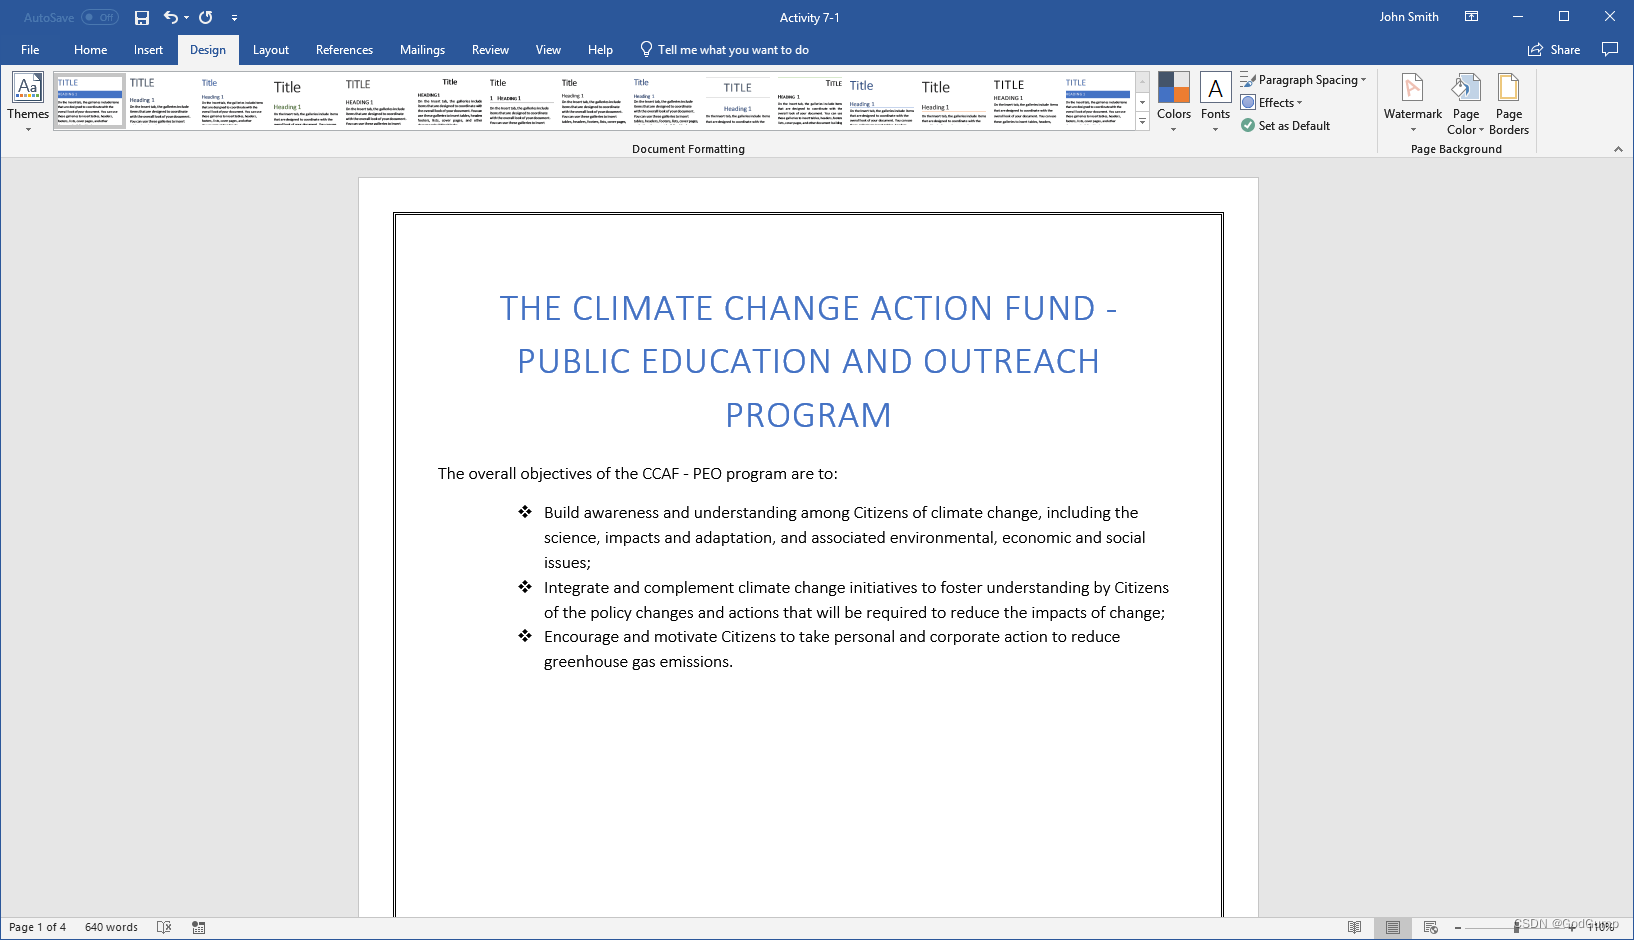
- The border will now be applied to the first page of the document:
Design tab with Title option selected
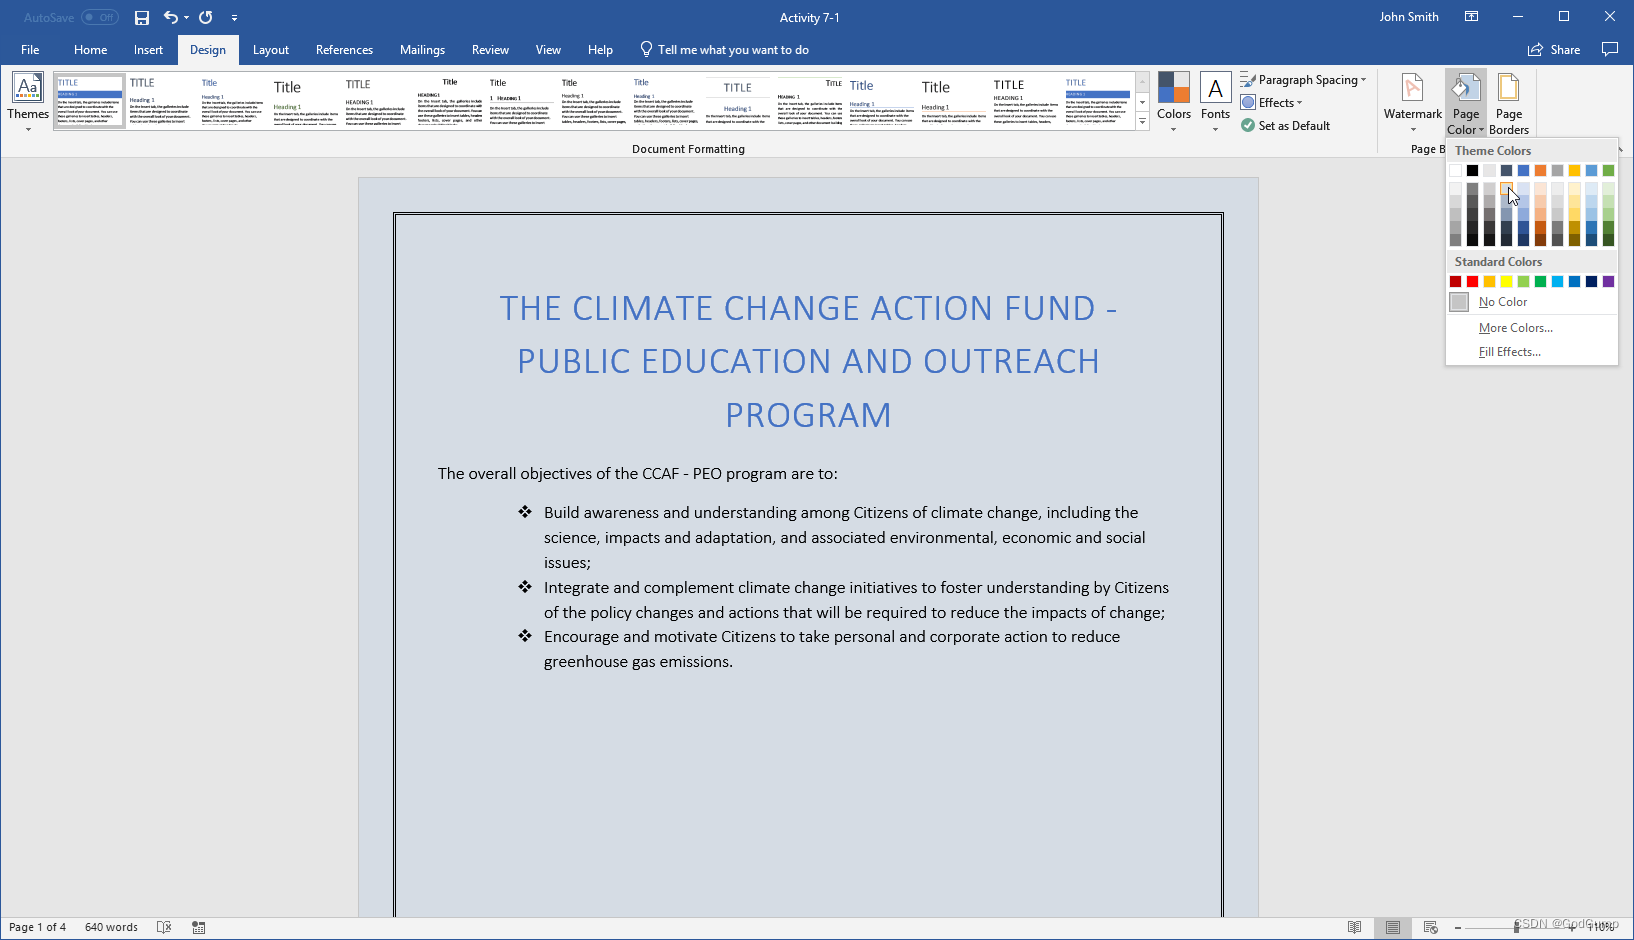
- Now let’s change the page color. Click Design → Page Color → Blue-Gray, Text 2, Lighter 80%:
Design tab with page color option selected
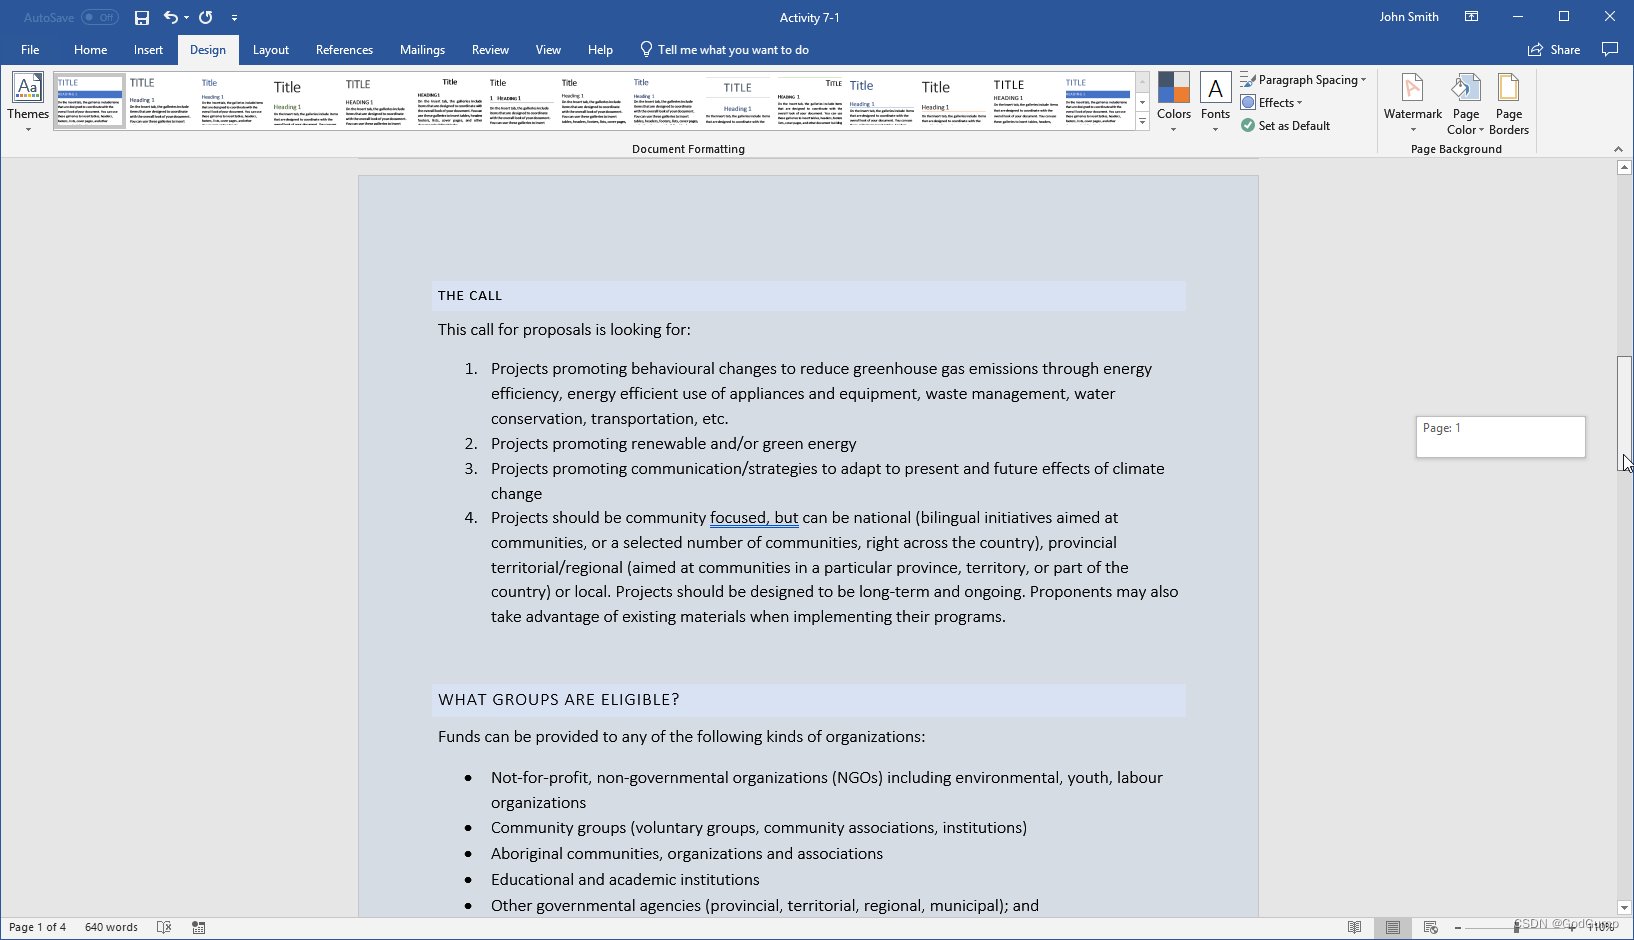
- Scroll through the document to view the effects of this formatting change:
The Word document open, with the changes applied to the text
- Save your document as Activity 7-1 Complete and close Microsoft Word 365.
练习:应用页面边框和颜色
让我们开始吧!
在这个练习中,您将为文档添加页面格式。
点击下面的链接打开Microsoft Word练习文档,您可以用它来完成这个练习。
练习:应用页面边框和颜色
首先,让我们给标题页添加一个边框。确保您的光标在该页面上,然后点击"设计"选项卡,再点击"页面边框":
打开的"设计"选项卡,"页面边框"选项已选择

选择一个3D边框样式:
打开的"边框和底纹"对话框,选择了一个3D边框样式
在样式列表中向下滚动,选择一个双实线样式:
打开的"边框和底纹"对话框,从样式区域选择了双实线样式

颜色和宽度设置看起来很好,所以我们将保留这些设置的默认选项。点击"应用于"下拉菜单,选择"This section – first page only":
打开的"边框和底纹"对话框,从"应用于"区域选择了"This section - First page only"
点击"确定"以创建您的边框:
打开的"边框和底纹"对话框,点击了"确定"按钮
边框现在将应用到文档的第一页:
打开的"设计"选项卡,选择了标题选项
现在让我们更改页面颜色。点击"设计"选项卡,再点击"页面颜色",选择"蓝灰,文本2,更浅 80%":
打开的"设计"选项卡,选择了页面颜色选项
滚动文档查看这个格式更改的效果:
打开的Word文档,应用了文本变化
将您的文档保存为"Activity 7-1 Complete"并关闭Microsoft Word 365。
Exercise: Inserting footnotes and endnotes
Let’s get started!
In this exercise, you will view, add, and modify footnotes. Note that when we refer to a page number, we are referring to the physical location of the page, not the formatted number that appears on the page.
- Click on the link below to open the Microsoft Word exercise document you can use to complete this exercise.
Exercise: Inserting Footnotes and Endnotes
- Go to the third page of the document. Notice that there is a number by the Solar System heading:
Heading “Solar System” with Foot Note symbol inserted
- Move your mouse over this number to see the note attached to it:
The Word document open, cursor is placed on the top of a number, a note appears attached
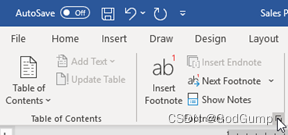
- Now let us add a few sources to the document. Go to page seven of the document. Click to place your cursor at the end of the first paragraph on this page. Click References → Insert Footnote:
References tab open with option “Insert Footnote” selected
- The number will be added and you will be taken to the footnote section. Type “Definition from Oxford Dictionary, 2020” without the quotation marks:
Word document with Footnote highlighted
Notice how this endnote is numbered “2” since it is the second one in the document.
- Let us modify the format of the footnotes in this document. Click the Footnotes and Endnotes option button in the Footnotes group of the References tab:
Cursor is placed at Footnotes and Endnotes option in the button at the footnotes tab
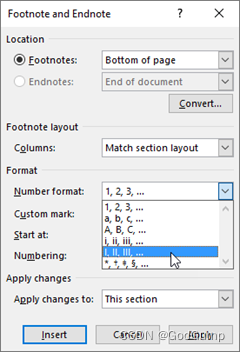
- The Footnote and Endnote dialog box will open. Click the “Number format” menu and choose uppercase Roman numerals:
Footnote and Endnote dialog box open, “Number format” menu chosen, Roman numerals chosen
- Click the “Apply changes to” menu and click “Whole document:”
Footnote and Endnote dialog window open, “Whole document” option selected in “Apply changes to” field
- Click Apply:
Footnote and Endnote dialog window open, Apply button clicked
- The Footnote and Endnote dialog box will close. You will see the formatting of the second footnote change:
Footnote open with the new format applied
- Let us make sure that the changes were applied to the first footnote, too. On the References tab, click the Next Footnote drop-down arrow and click Previous Footnote:
References tab with Previous Footnote option selected
- You will see that the first footnote has been updated too:
First footnote open with the new format applied
(You may need to move the cursor to see the numbering.)
- Save your document as Activity 2-5 Complete. Close Microsoft 365 Word to complete this activity.
练习:插入脚注和尾注
让我们开始吧!
在本练习中,您将查看、添加和修改脚注。请注意,当我们提到页码时,我们指的是页面的物理位置,而不是页面上出现的格式化数字。
1.单击下面的链接打开Microsoft Word练习文档,您可以使用该文档来完成此练习。
2.转到文档的第三页。请注意,太阳系标题旁边有一个数字:

标题“太阳系”,插入脚注符号

3.将鼠标移到此数字上,即可查看其所附的注释:
Word文档打开,光标放在一个数字的顶部,并显示一个注释
4.现在让我们为文档添加一些来源。转到文档的第七页。单击可将光标放置在此页面上第一段的末尾。单击“参考”→ 插入脚注:
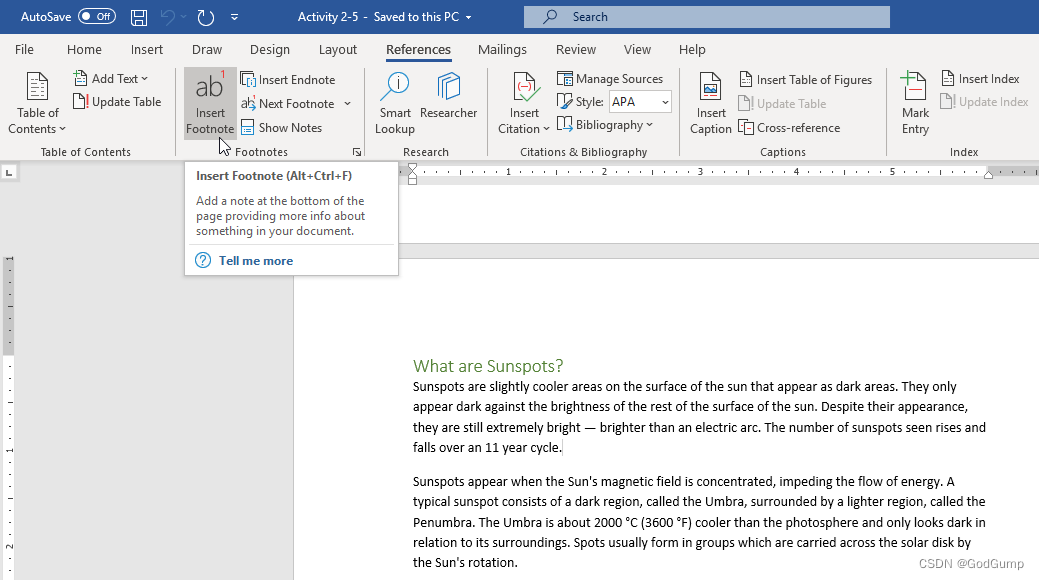
打开“参考”选项卡,选择“插入脚注”选项
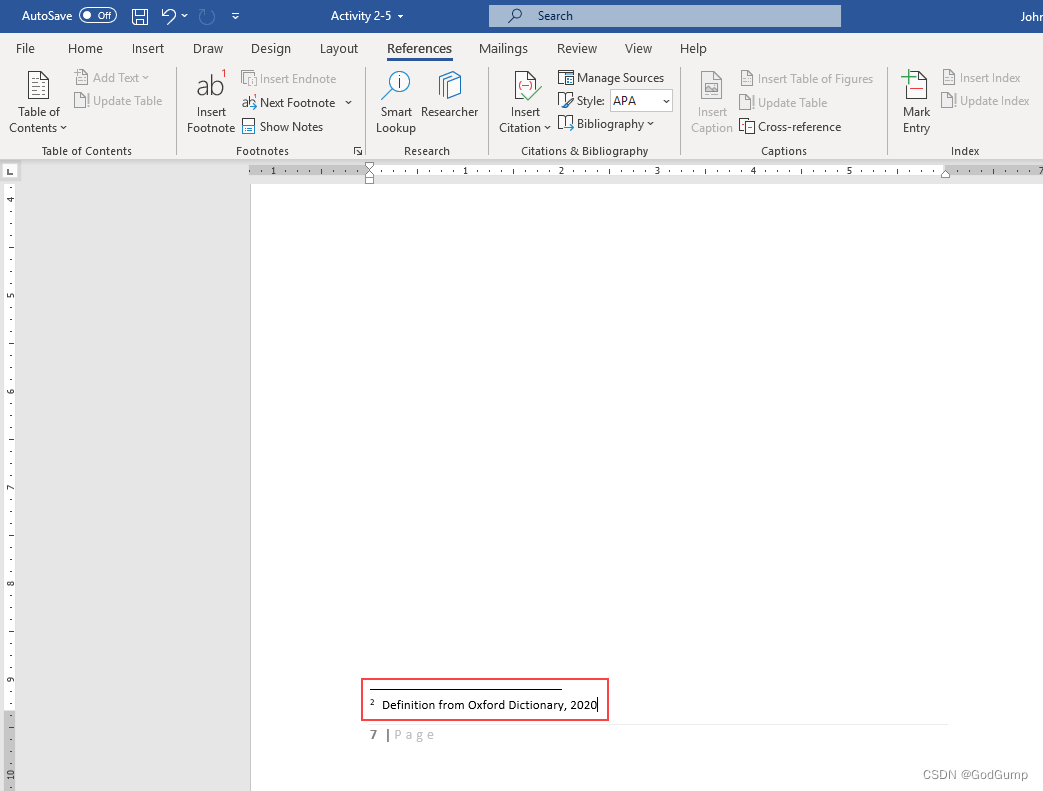
5.数字将被添加,您将被带到脚注部分。键入“牛津词典定义,2020”,不带引号:
突出显示脚注的Word文档
注意这个尾注是如何编号为“2”的,因为它是文档中的第二个尾注。
6.让我们修改一下本文件脚注的格式。单击“引用”选项卡的“脚注”组中的“脚注和尾注”选项按钮:
光标位于脚注选项卡按钮中的脚注和尾注选项处
7.“脚注和尾注”对话框将打开。单击“数字格式”菜单,然后选择大写罗马数字:
打开脚注和尾注对话框,选择“数字格式”菜单,选择罗马数字
8.单击“将更改应用到”菜单,然后单击“整个文档:”
打开脚注和尾注对话框窗口,在“将更改应用到”字段中选择“整个文档”选项
9.单击“应用”:
脚注和尾注对话框窗口打开,单击“应用”按钮
10.脚注和尾注对话框将关闭。您将看到第二个脚注的格式更改:
脚注打开并应用新格式
11.让我们确保这些修改也适用于第一个脚注。在“引用”选项卡上,单击“下一个脚注”下拉箭头,然后单击“上一个脚注:
选中“上一个脚注”选项的“参考”选项卡
12.您将看到第一个脚注也已更新:
打开第一个脚注并应用新格式
(您可能需要移动光标才能查看编号。)
13.将您的文档保存为“活动2-5完成”。关闭Microsoft 365 Word以完成此活动。
EXCEL
Working with data
Let’s get started!
In this activity, you will use AutoFill and Flash Fill to complete the financial data workbook.
- Click on the link below to open the Microsoft Excel exercise document you can use to complete this exercise.
Exercise: Working with data
- First, let’s use AutoFill to complete the formulas for the two profit columns. First, select cell G2 and place your cursor over the green AutoFill handle in the bottom right corner of the cell:
Excel workbook open Cell G2 selected, cursor placed over the green AutoFill handle in the bottom right corner of the cell
- Click and drag it down to cell G20. This will copy the formula from G2 to all the blank cells, adjusting the cell references in the formula for each row:
Excel workbook open, the Autofill was dragged it down to cell G20
- Observe the results:
Excel workbook open, the formula from G20 was copy to all the blank cell
- To extend the formula in column I, rather than clicking and dragging the AutoFill handle, simply double-click it. Note that Excel identifies the data pattern and copies the formulas to the end of the data in row 20:
Excel workbook open, Autofill selected in column “I”, the formulas was copy until the end of the data in row 20
- Now, use Flash Fill to separate the City and State data from column A into columns B and C. Click in cell B2 and type the City name from cell A2, “Warner”, then click in cell C2 and type the State abbreviation “NH”:
Excel workbook open, Cell B2 clicked and typed “Warner”, C2 clicked and typed “NH”
- Now select cell B3, then click Data → Flash Fill:
Excel workbook open, Cell B3 selected, Data clicked and then Flash Fill option
- Cells B2 through B20 now contain only the city name from column A. Now click cell C3 and click Data → Flash Fill to repeat the process for the State abbreviations:
Excel workbook open, Cells B2 to B20 contains the cities name from column A, C3 cell clicked, Data selected and Flash Fill
- Observe the results:
Excel workbook open, the changes were applied in the document
- You can now discard the data in column A by right-clicking on the column header and selecting Delete from the menu:
Excel workbook open, data in column A selected, right-click in column header, small tool box opens, delete option clicked
- The data in column A is removed and the remaining data shifts one column to the left. Note that the cell references in your formulas have changed to the new column letters automatically:
Excel workbook open, the data from column is removed, the cell refences from the formulas have changed to the new column
- Finally, we need to copy the Scorecard data to its own sheet. Select cells J1 through to L4 by clicking and dragging:
Excel workbook document open, Cells J1 through to L4
- Click Home → Copy:
Excel workbook open, Home tab selected, copy option selected
- Click the Financial Scorecard worksheet tab:
Excel workbook open, Financial Scorecard worksheet tab selected
- Ensure your cursor is in cell A1. Click the Home tab in the ribbon, click on the drop-down arrow of the Paste command, then click the Paste Values icon from the menu:
Excel workbook open, cursor placed in Cell A1, Home tab clicked, drop-down arrow clicked from Paste, Paste Values clicked
- The data will be pasted:
Excel workbook open, data pasted
If you select one of the cells in Column C and click in the formula bar, you will notice that the formulas have been replaced by static values. This is because we selected the Values option to prevent the formulas from breaking during the copy process.
- Save your workbook as Activity 2-3 Complete. Close Microsoft 365 Excel to complete this activity.
数据工作
让我们开始吧!
在这个活动中,您将使用自动填充和闪电填充来完成财务数据工作簿。
点击下面的链接打开 Microsoft Excel 练习文档,您可以使用该文档来完成此练习。
练习:处理数据
首先,让我们使用自动填充来完成两个利润列的公式。首先选中单元格 G2,将光标放在单元格右下角的绿色自动填充手柄上:
Excel 工作簿打开,选中单元格 G2,将光标放在单元格右下角的绿色自动填充手柄上。
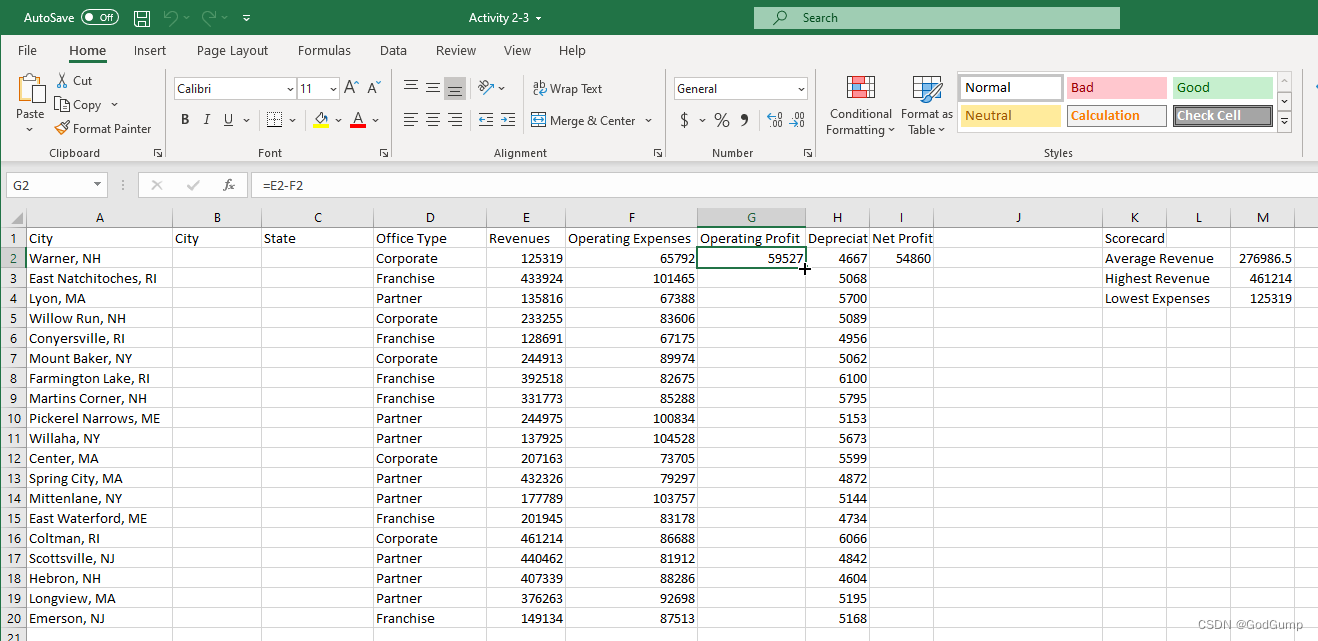
点击并拖动手柄,将其拖动到单元格 G20。这将把公式从 G2 复制到所有空白单元格,并为每一行调整单元格引用:
Excel 工作簿打开,自动填充手柄被拖动到单元格 G20。
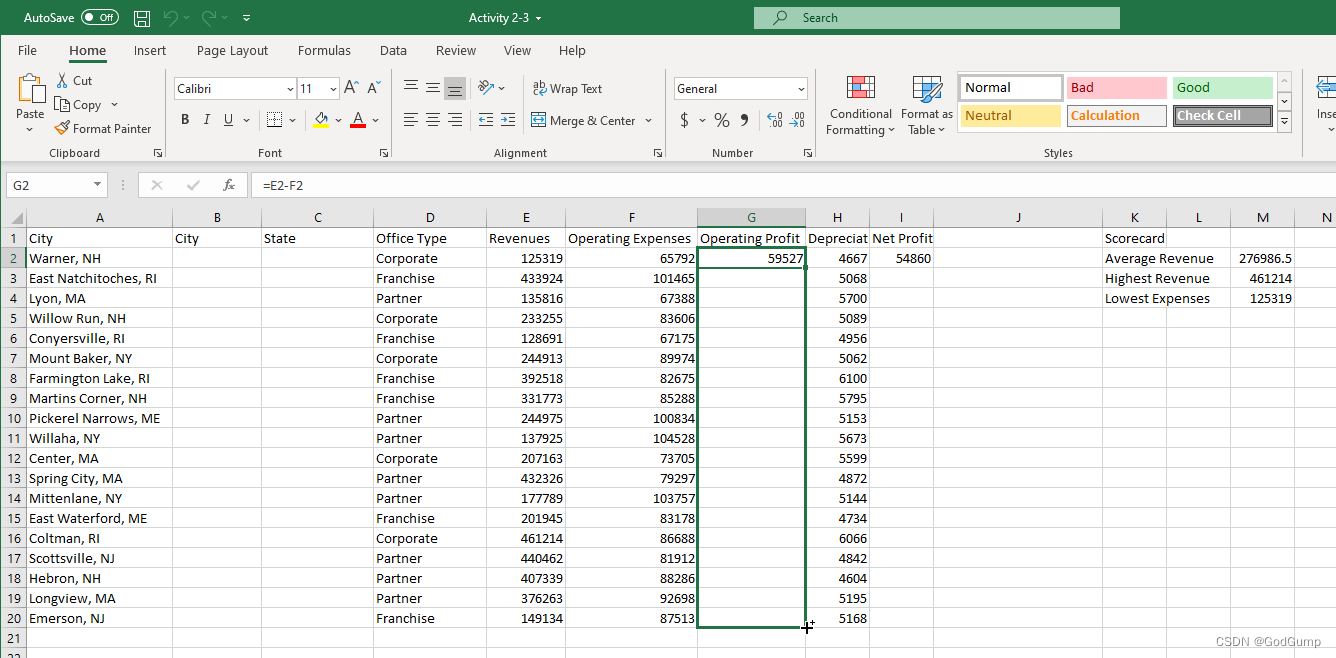
观察结果:
Excel 工作簿打开,公式从 G20 复制到所有空白单元格。
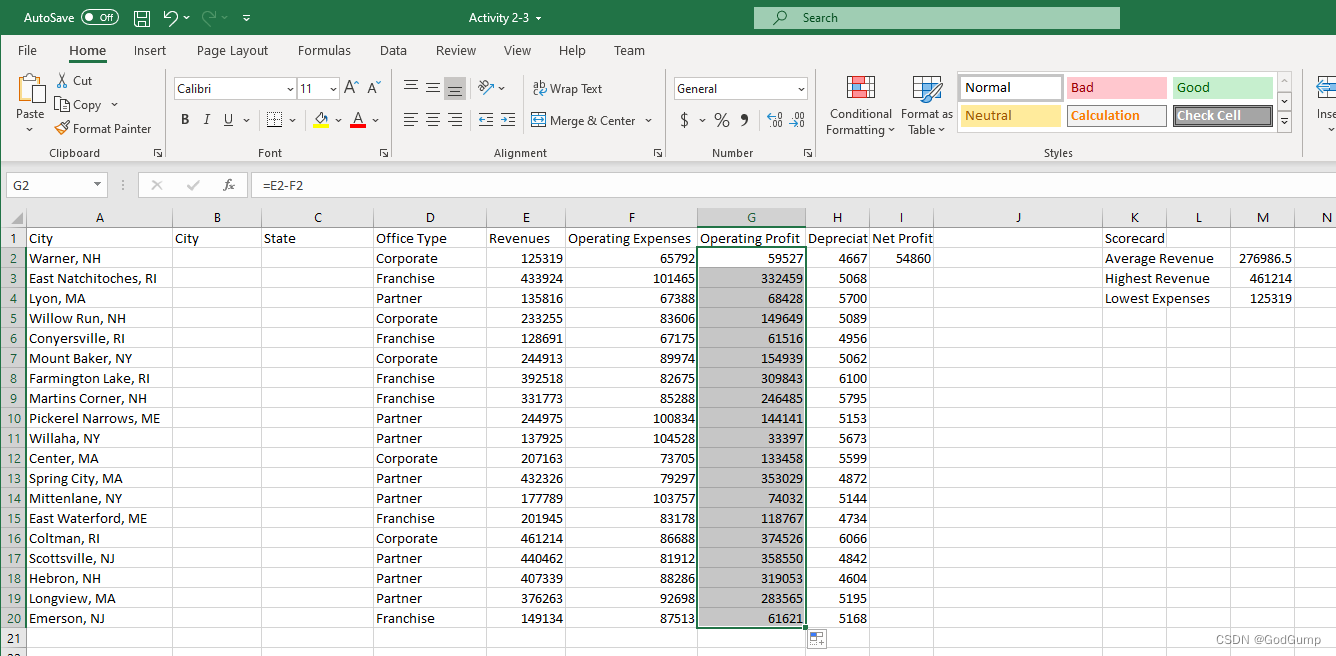
要扩展列 I 中的公式,而不是点击并拖动自动填充手柄,只需双击它。注意,Excel 会识别数据模式并将公式复制到数据的末尾,即第 20 行:
Excel 工作簿打开,在列 “I” 中选择自动填充,公式被复制到数据的末尾。
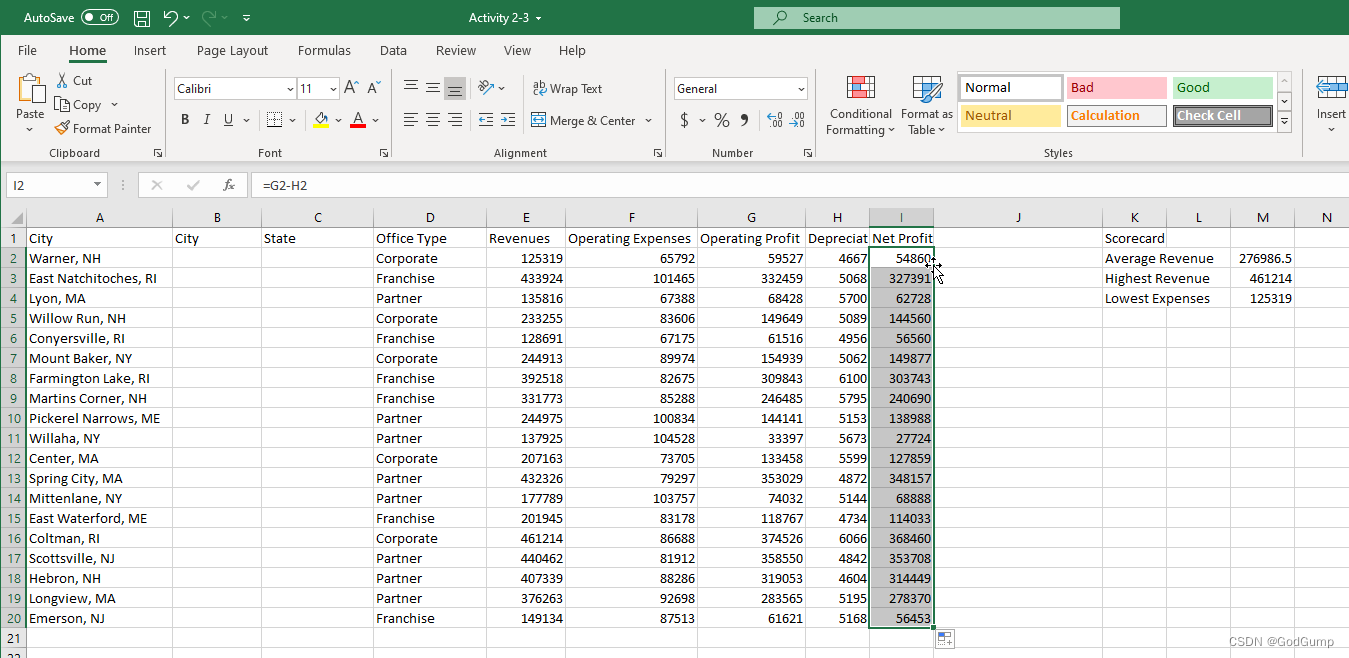
现在,使用闪电填充将列 A 中的城市和州数据分开到 B 列和 C 列。点击单元格 B2 并在其中输入来自单元格 A2 的城市名称 “Warner”,然后点击单元格 C2 并输入州的缩写 “NH”:
Excel 工作簿打开,点击单元格 B2 并输入 “Warner”,点击单元格 C2 并输入 “NH”。
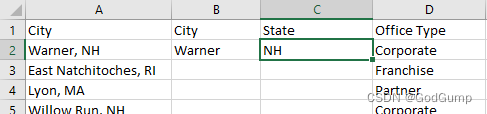
现在选中单元格 B3,然后点击 数据→闪电填充:
Excel 工作簿打开,选中单元格 B3,点击数据,然后选择闪电填充选项。
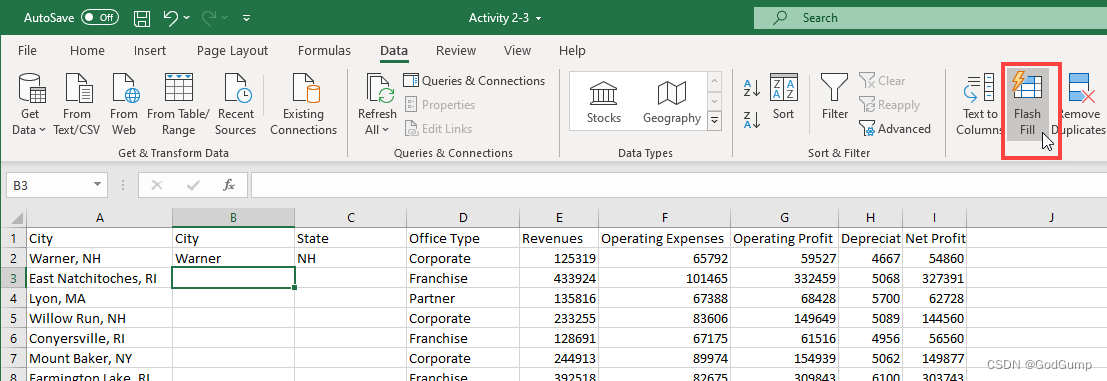
现在,单元格 B2 到 B20 中只包含列 A 中的城市名称。现在点击单元格 C3,然后点击 数据→闪电填充,以重复这个过程,将州的缩写应用到相应的单元格中:
Excel 工作簿打开,单元格 B2 到 B20 包含了列 A 中的城市名称,点击单元格 C3,选择数据,然后点击闪电填充。
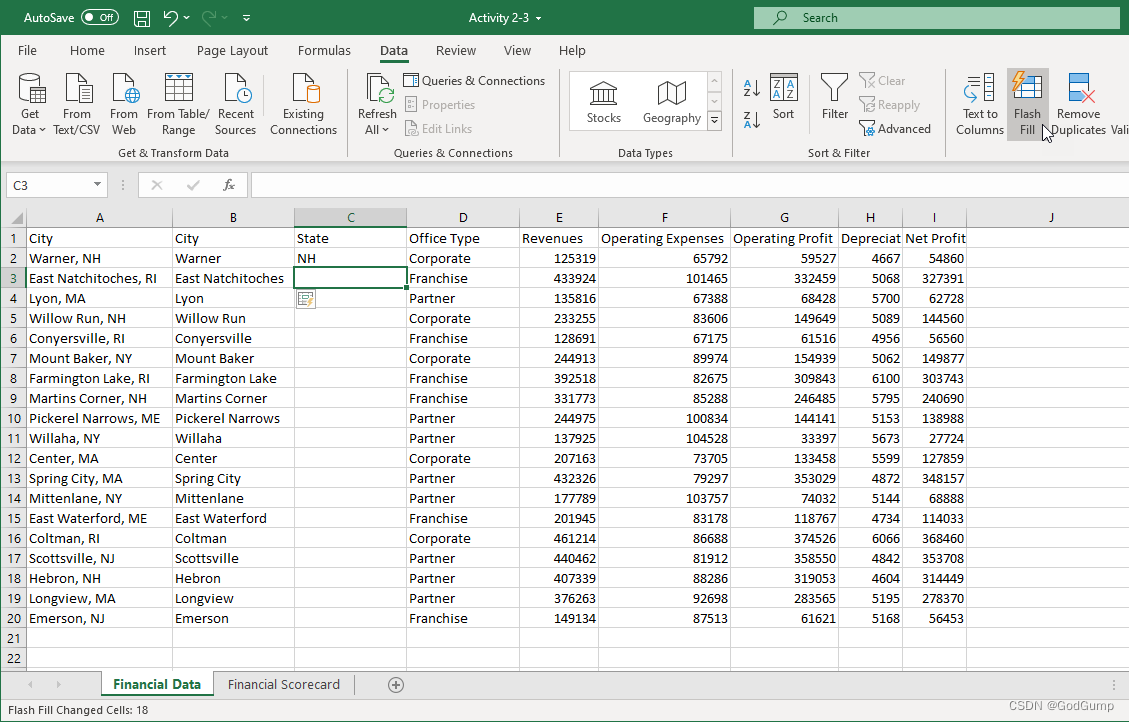
观察结果:
Excel 工作簿打开,文档中的变化已应用。

现在,您可以通过右键单击列标题并从菜单中选择“删除”来丢弃列 A 中的数据:
Excel 工作簿打开,选择列 A 中的数据,右键单击列标题,弹出小工具栏,选择删除选项
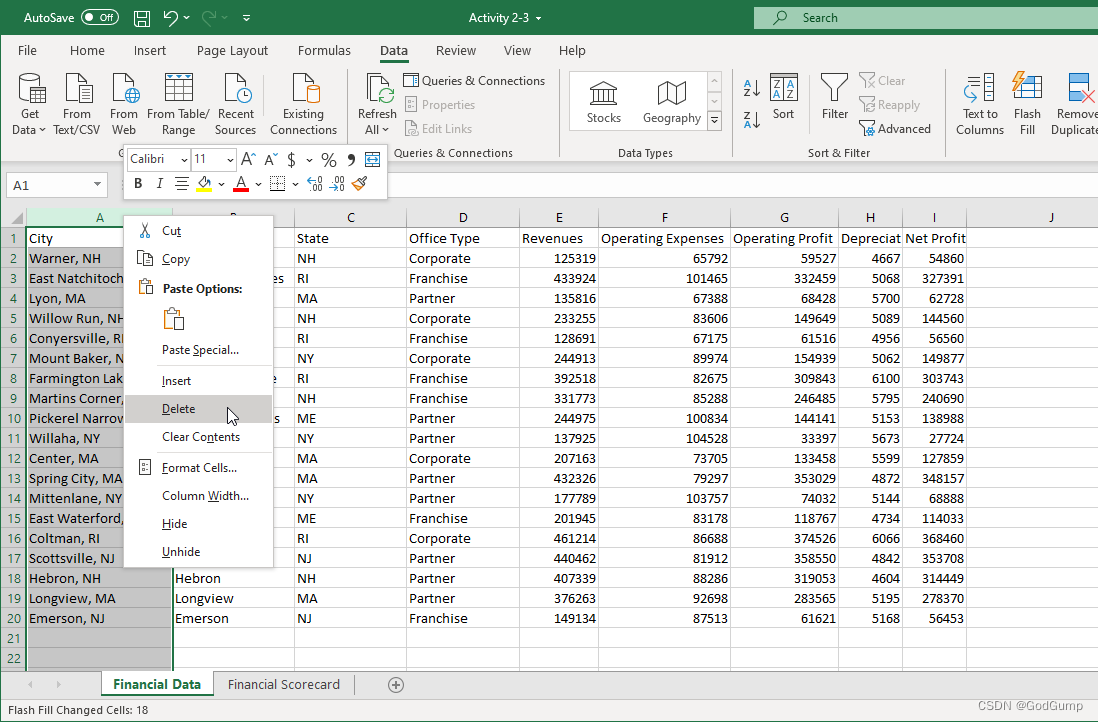
列 A 中的数据将被删除,剩余的数据会向左移动一列。请注意,公式中的单元格引用会自动更改为新的列字母:
Excel 工作簿打开,列 A 中的数据被删除,公式中的单元格引用已更改为新的列
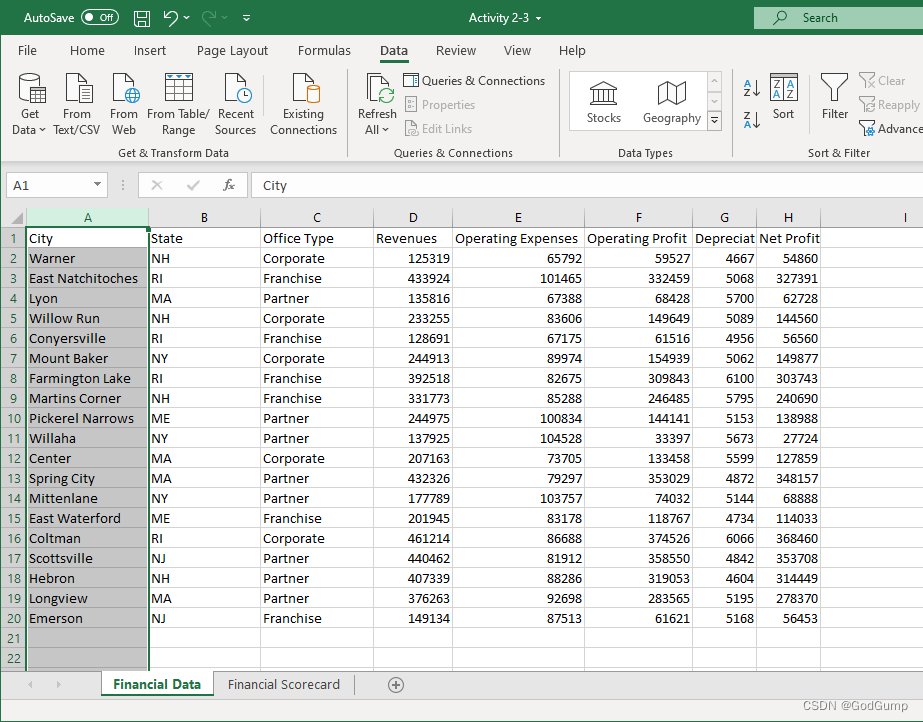
最后,我们需要将得分卡数据复制到自己的工作表中。通过点击并拖动选择单元格 J1 到 L4:
Excel 工作簿文档打开,通过点击并拖动选择单元格 J1 到 L4
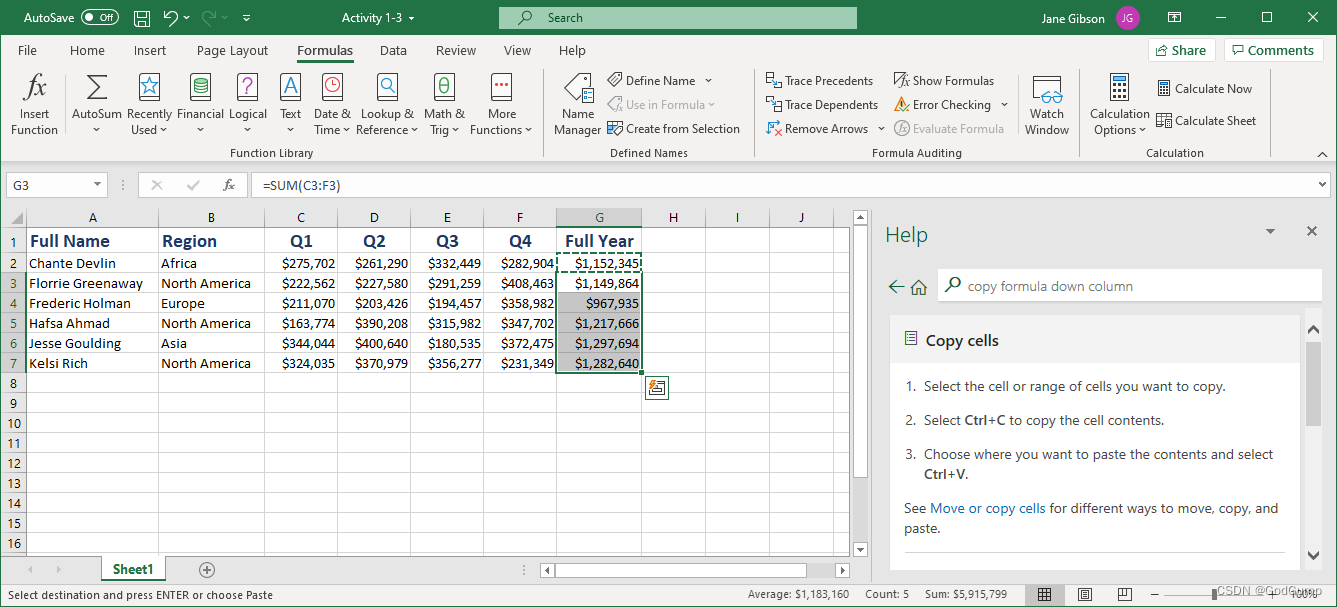
点击主页 → 复制:
Excel 工作簿打开,选择主页选项卡,选择复制选项
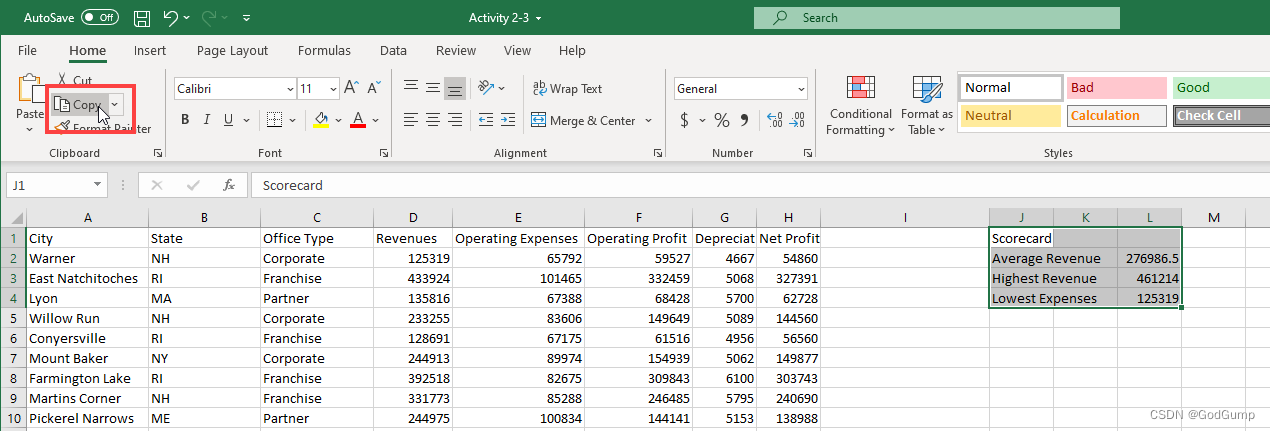
点击 Financial Scorecard 工作表选项卡:
Excel 工作簿打开,选择 Financial Scorecard 工作表选项卡
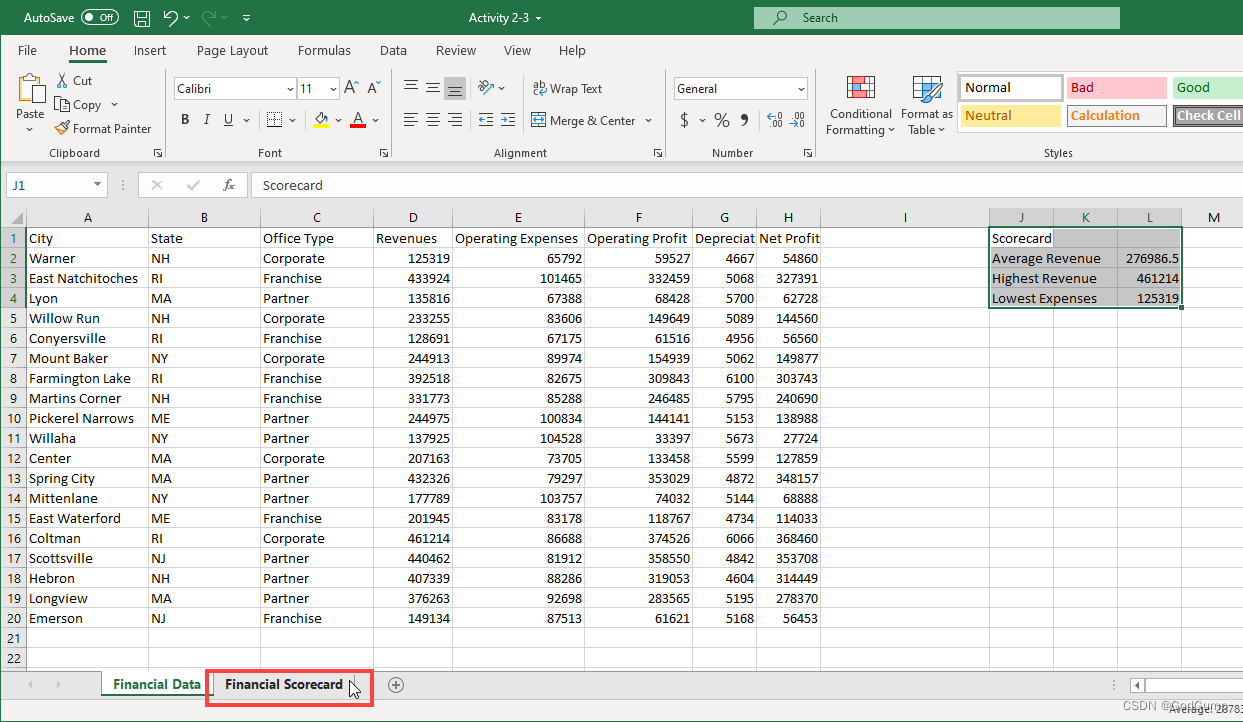
确保光标位于单元格 A1。点击主页选项卡,点击剪贴板命令的下拉箭头,然后从菜单中点击“粘贴值”图标:
Excel 工作簿打开,将光标放置在单元格 A1,点击主页选项卡,点击剪贴板命令的下拉箭头,从菜单中点击“粘贴值”图标
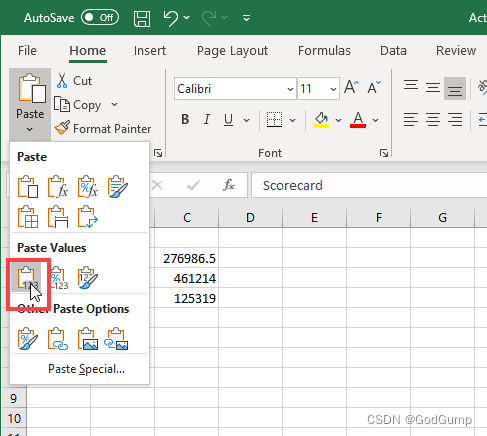
数据将被粘贴:
Excel 工作簿打开,数据已被粘贴
如果您选择列 C 中的一个单元格并在公式栏中点击,您会注意到公式已被静态值替代。这是因为我们选择了“值”选项,以防止在复制过程中破坏公式。

将您的工作簿保存为“Activity 2-3 Complete”。关闭 Microsoft 365 Excel 以完成此活动。
Formatting text
Let’s get started!
In this activity, you will format header rows and a title in your worksheet.
- Click on the link below to open the Microsoft Excel exercise document you can use to complete this exercise.
Exercise: Formatting text
- First, let’s format the header row of the Financial Data sheet. Select Row 1:
Excel workbook open, Row 1 was selected
- Click the Increase Font Size button twice:
Excel workbook open, Increase Font Size option clicked twice
- The value in the Size menu should now be 14:
Excel workbook open, the size of the font changed to 14
- Apply the Bold effect:
Excel workbook open, Bold option selected
- Click the drop-down arrow next to the Font Color command:
Excel workbook open, Font color drop-down arrow clicked
- Click the Blue swatch in the Standard Colors palette:
Excel workbook open, Standard Colors palette open, Blue Swatch color chosen
- Because of the font changes, the data no longer fits in the cells. Press Ctrl + A to select the entire worksheet. Click Home → Format → AutoFit Column Width:
Excel workbook open, entire workbook was selected, Home tab selected, Format and AutoFit Column Width were clicked
- Now, let’s copy the header row formatting to the second sheet. Click any cell in Row 1 to select it and click Home → Format Painter:
Excel workbook open, random cell in Row 1 selected, Home tab selected, Format Painter clicked
- Click the Financial Scorecard worksheet tab:
Excel workbook open, Financial Scorecard worksheet tab selected
- Click cell A1:
Excel workbook open, Cell A1 selected
The formatting will be applied; notice that the Merge & Center formatting option has been removed as part of this process. We will fix this in a later activity.
- Save your workbook as Activity 3-1 Complete. Close Microsoft 365 Excel to complete this activity.
格式化文本
让我们开始吧!
在这个活动中,您将会对工作表中的标题行和标题进行格式化。
点击下面的链接打开Microsoft Excel练习文档,您可以使用它来完成这个练习。
练习:格式化文本
首先,让我们格式化“财务数据”工作表的标题行。选择第一行:
Excel工作簿已打开,选择了第一行。
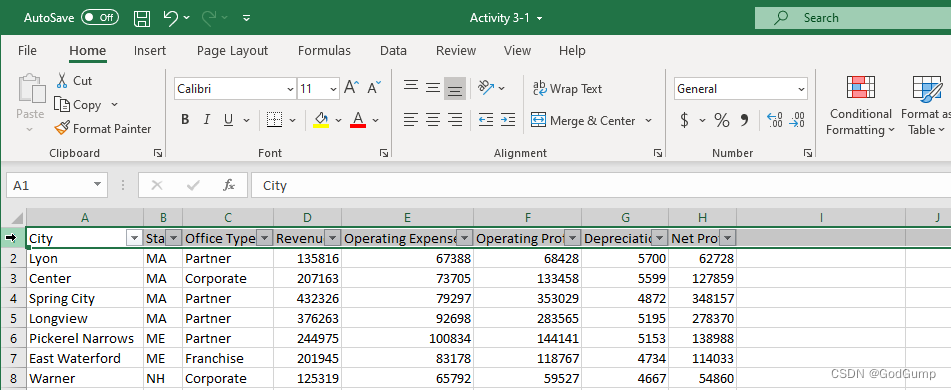
点击“增大字号”按钮两次:
Excel工作簿已打开,点击了“增大字号”选项两次。
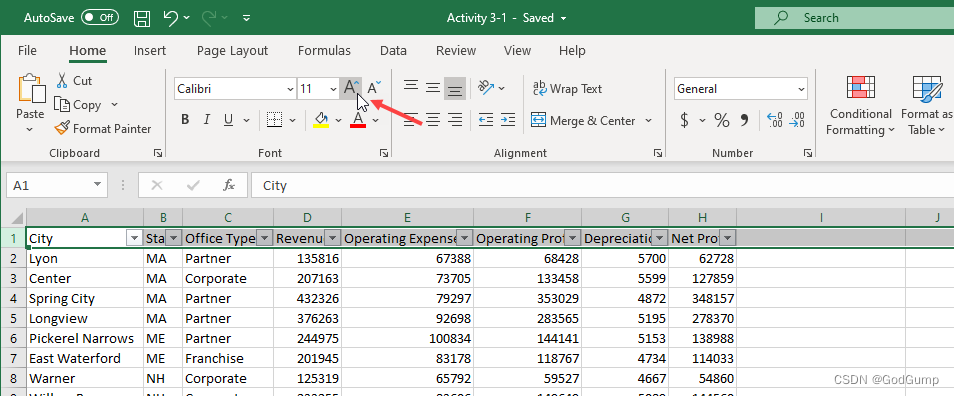
现在,大小菜单中的值应该是14:
Excel工作簿已打开,字体大小已更改为14。
应用“粗体”效果:
Excel工作簿已打开,选择了“粗体”选项。
点击“字体颜色”命令旁边的下拉箭头:
Excel工作簿已打开,点击了“字体颜色”下拉箭头。
在“标准颜色”调色板中,点击蓝色样本:
Excel工作簿已打开,“标准颜色”调色板已打开,选择了蓝色样本颜色。
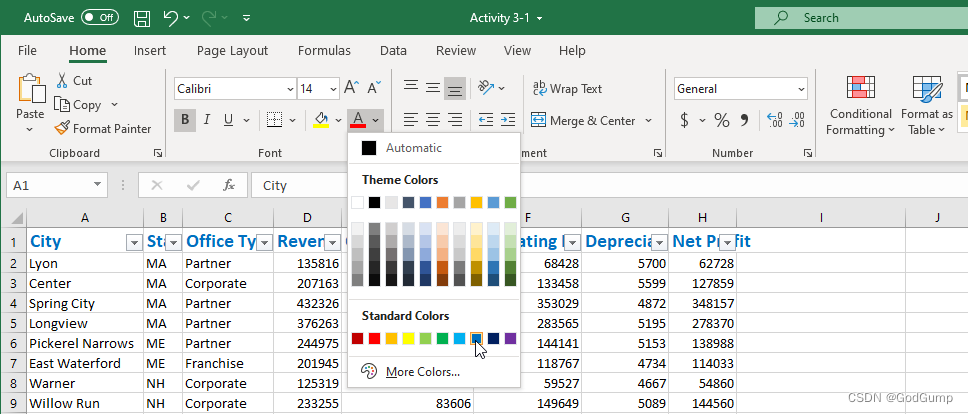
由于字体的更改,数据不再适合单元格中。按Ctrl + A选择整个工作表。点击“开始”→“格式”→“自动调整列宽度”:
Excel工作簿已打开,选择了整个工作表,“开始”选项卡被选择,“格式”和“自动调整列宽度”被点击。
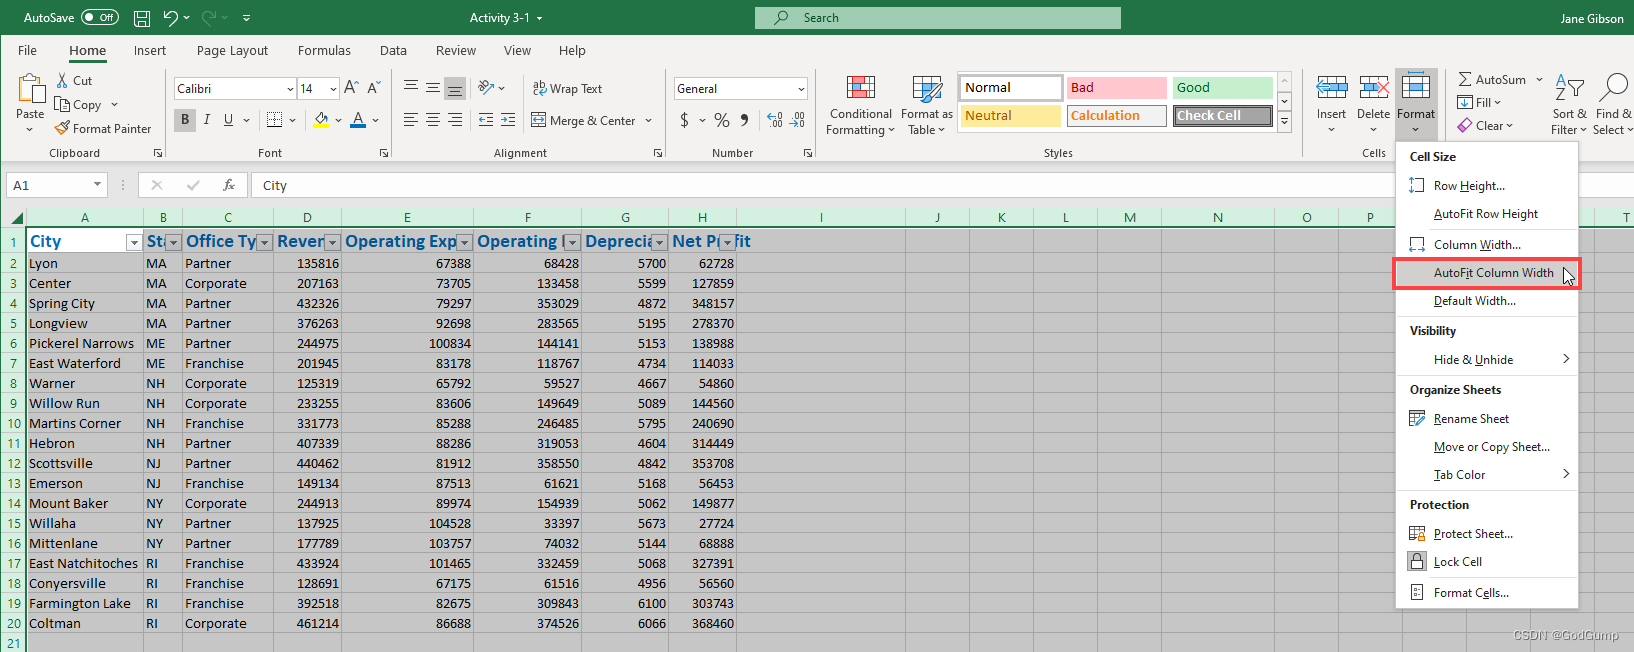
现在,让我们将标题行的格式复制到第二个工作表。点击第一行的任意单元格来选择它,然后点击“开始”→“格式刷”:
Excel工作簿已打开,选择了第一行的任意单元格,“开始”选项卡被选择,点击了“格式刷”。
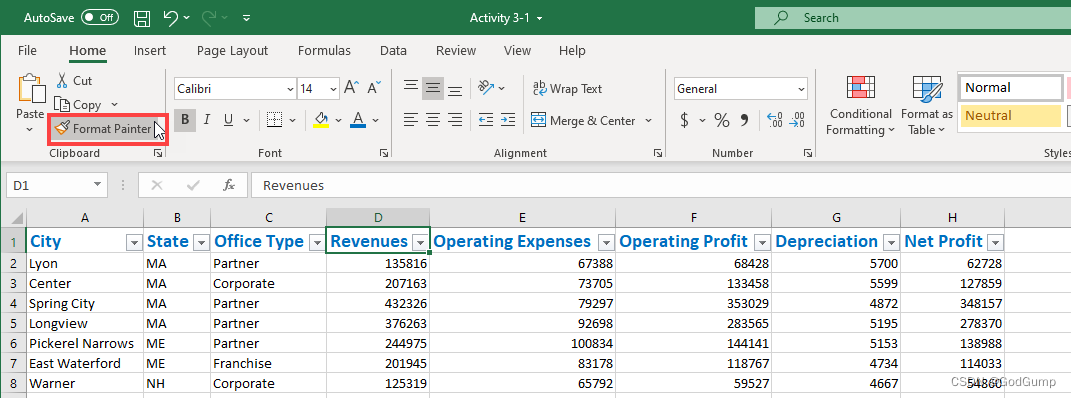
点击“财务绩效评分卡”工作表标签:
Excel工作簿已打开,点击了“财务绩效评分卡”工作表标签。
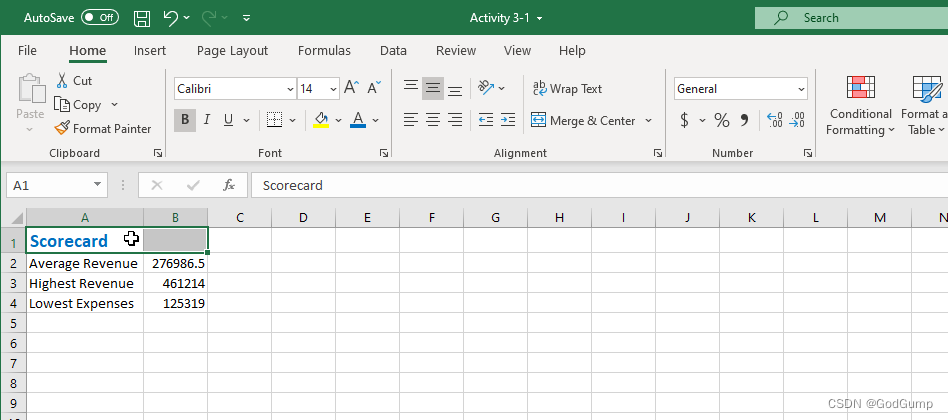
点击单元格A1:
Excel工作簿已打开,选择了单元格A1。将应用格式;请注意,在此过程中,“合并并居中”格式选项已被删除。我们将在以后的活动中修复它。

将工作簿保存为“Activity 3-1 Complete”。关闭Microsoft 365 Excel以完成这个活动。
Exercise: Formatting cells
Let’s get started!
In this activity, you will improve the appearance and readability of your sales report using borders, fills, and number formatting.
- Click on the link below to open the Microsoft Excelexercise document you can use to complete this exercise.
Exercise: Formatting cells
- First, let’s apply the proper formatting to our data. The Financial Scorecard worksheet should be open. (If not, click its tab to switch to it.) Select the three cells containing numbers in Column B:
Excel workbook open, the Three cells containing numbers in Column B selected
- Click the dollar icon in the Number group of the Home tab and click $ English (United States):
Excel workbook open, dollar icon was clicked, a small pane with options open, $ English (United States) selected
- The formatting will be applied. However, we do not need the cents information, so click Decrease Decimal twice:
Excel workbook open, Decrease Decimal option clicked twice
- This will remove the decimals from the numbers, but notice that the full value is still available in the formula bar:
Excel workbook open, the decimals was removed from the document, the value appears in the formula bar
- Now, switch to the Financial Data worksheet:
Excel workbook open, Worksheet switched to the Financial Data
- Select cells D2 through H20:
Excel workbook open, Cells D3 until H20 selected
- Click the dollar icon in the Number group of the Home tab and click $ English (United States):
Excel workbook open, Home tab open, dollar icon clicked, small pane open, $ English (United States) option selected
- Click the Decrease Decimal button twice to remove the cents values:
Excel workbook open, Decrease Decimal button clicked twice, the cents values removed
- Review the results:
Excel workbook open, the changes applied to the document
- Finally, let’s make the header row stand out a bit more. Select cells A1 to H1:
Excel workbook open, Cells A1 to H1 selected
- Click the Borders drop-down arrow and click Thick Bottom Border:
Excel workbook open, Borders drop- down arrow clicked, Thick Bottom Border selected
- The border will be added. Now, click the Fill drop-down arrow and choose the color shown here:
Excel workbook open, the border was added, Fill drop-down arrow clicked, color pane open, a color was chosen
- Click any cell to de-select the header row. Review your formatting changes:
Excel workbook open, changes applied in the document
- Save your workbook as Activity 3-2 Complete. Close Microsoft 365 Excel to complete this activity.
练习:格式化单元格
让我们开始吧!
在本练习中,您将使用边框、填充和数字格式设置来改善销售报告的外观和可读性。
单击下面的链接以打开您可以用来完成此练习的 Microsoft Excel 练习文档。
练习:格式化单元格
首先,让我们对数据应用适当的格式设置。应该打开 Financial Scorecard 工作表。(如果没有,请单击其选项卡切换到它。)选择列 B 中包含数字的三个单元格:
Excel 工作簿打开,选择列 B 中包含数字的三个单元格
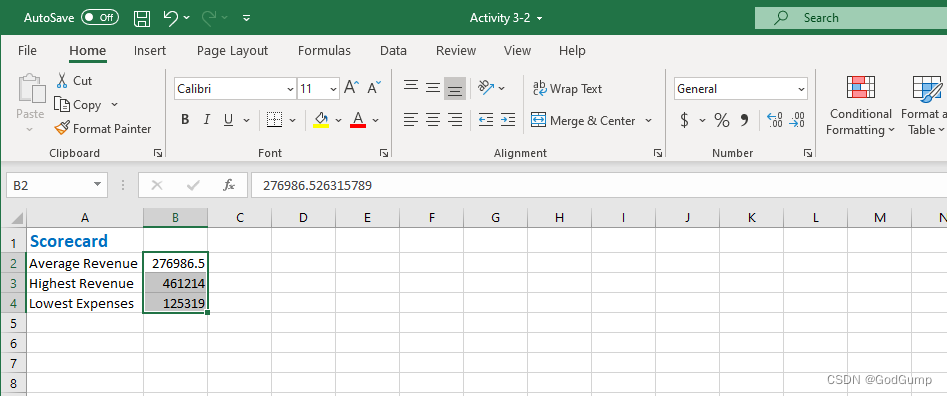
单击主页选项卡中的数字组中的美元图标,然后单击$ English (United States):
Excel 工作簿打开,单击美元图标,打开一个带有选项的小窗格,选择$ English (United States)
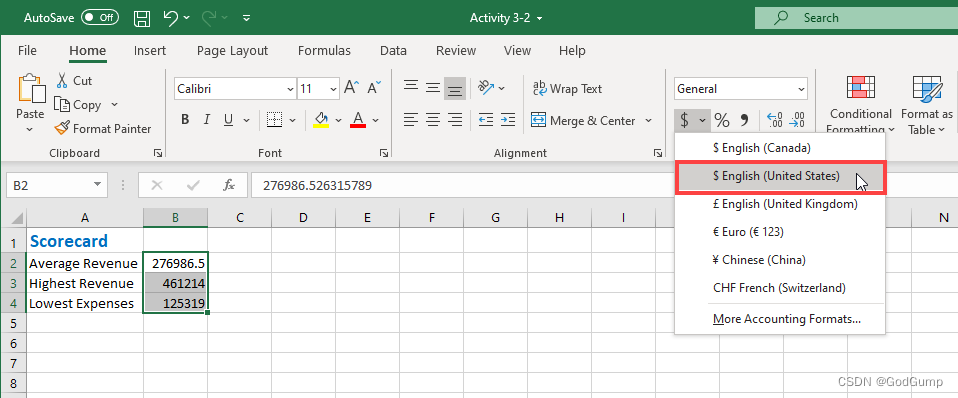
将应用格式设置。但是,我们不需要美分信息,因此单击 Decrease Decimal 两次:
Excel 工作簿打开,单击 Decrease Decimal 两次
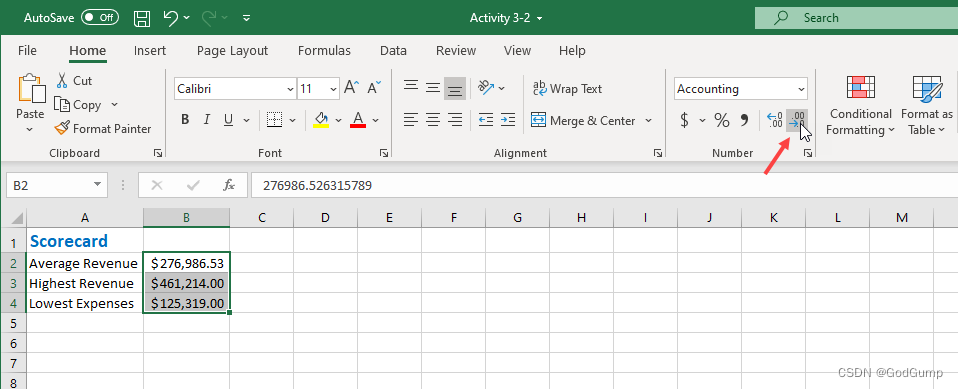
这将从数字中删除小数点,但请注意,完整的值仍然可在公式栏中看到:
Excel 工作簿打开,从文档中删除了小数位,值在公式栏中显示
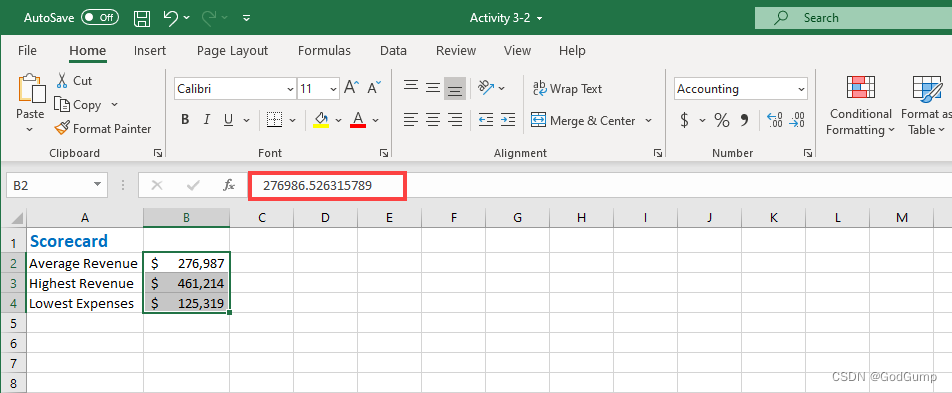
现在,切换到 Financial Data 工作表:
Excel 工作簿打开,切换到 Financial Data 工作表

选择单元格 D2 到 H20:
Excel 工作簿打开,选择单元格 D2 到 H20
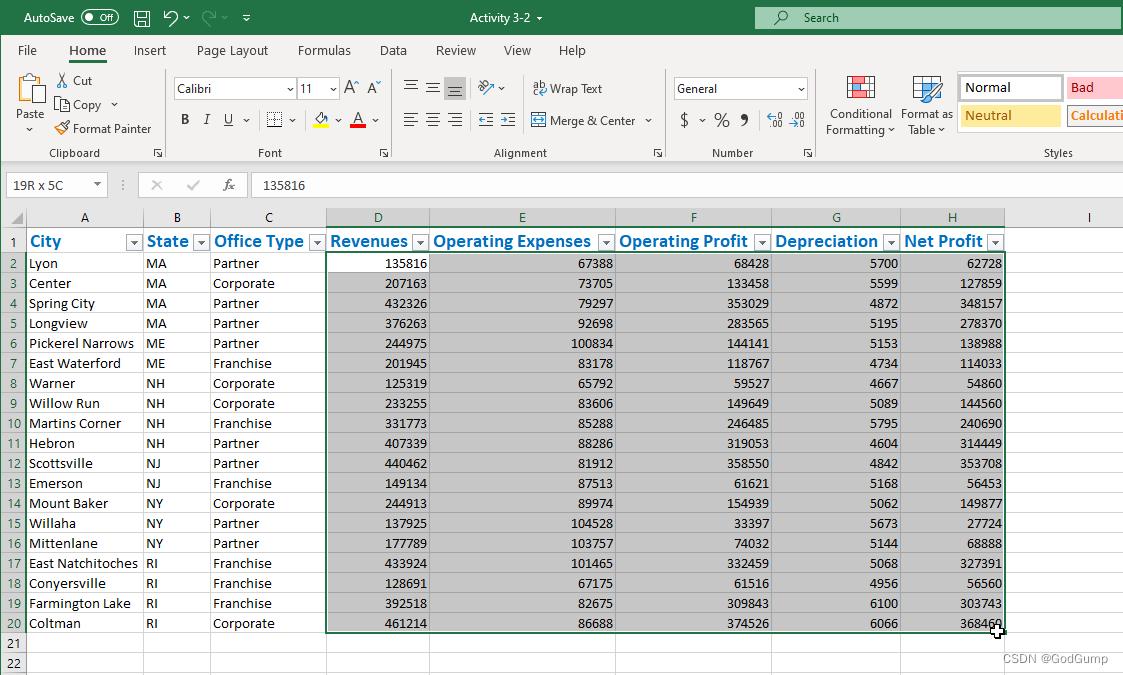
单击主页选项卡中的数字组中的美元图标,然后单击$ English (United States):
Excel 工作簿打开,主页选项卡打开,单击数字组中的美元图标,打开一个小窗格,选择$ English (United States)
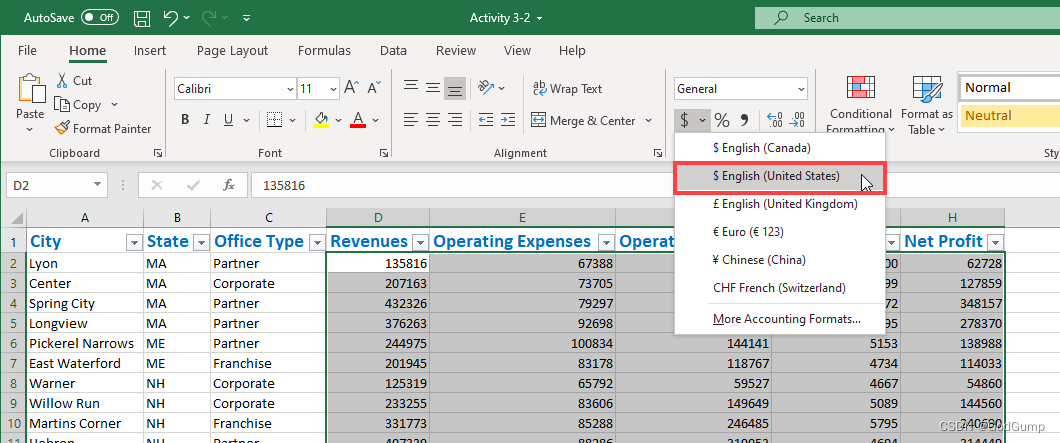
单击 Decrease Decimal 按钮两次以删除美分值:
Excel 工作簿打开,单击 Decrease Decimal 按钮两次,删除美分值
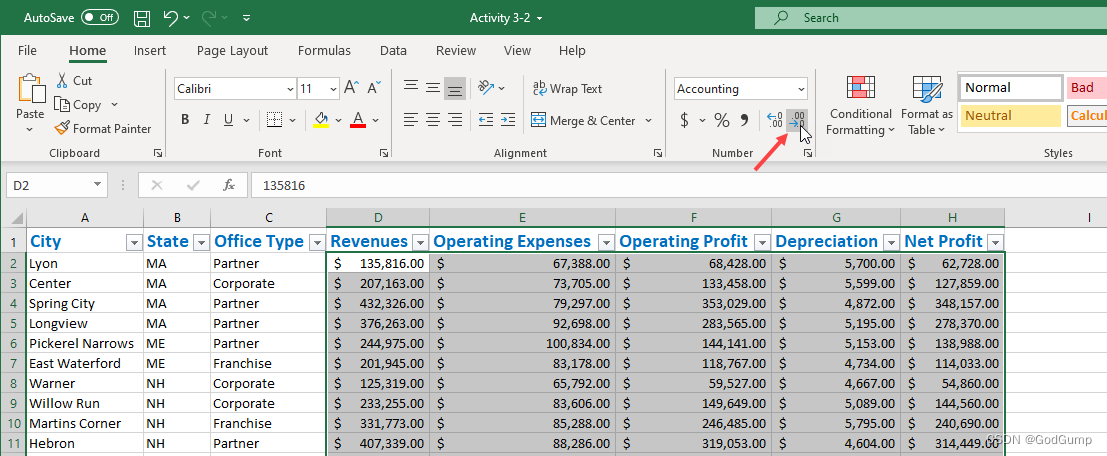
查看结果:
Excel 工作簿打开,更改应用于文档
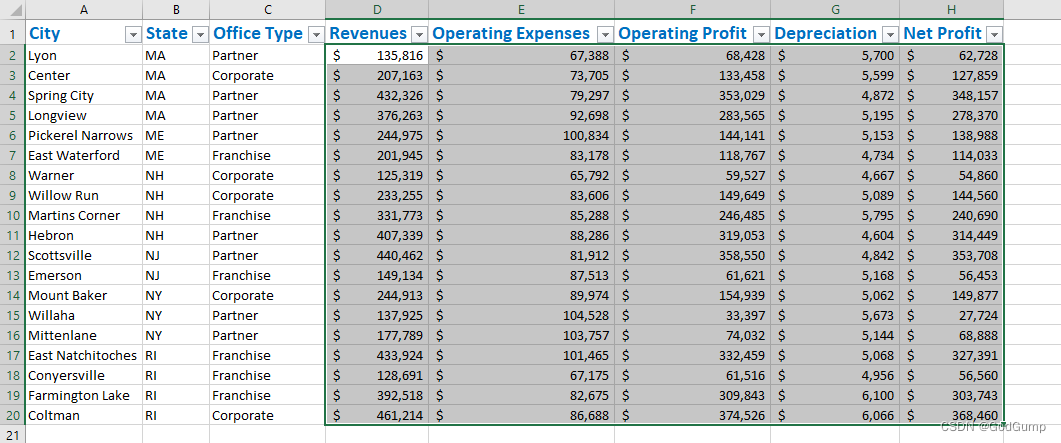
最后,让我们使标题行更加突出一些。选择单元格 A1 到 H1:
Excel 工作簿打开,选择单元格 A1 到 H1
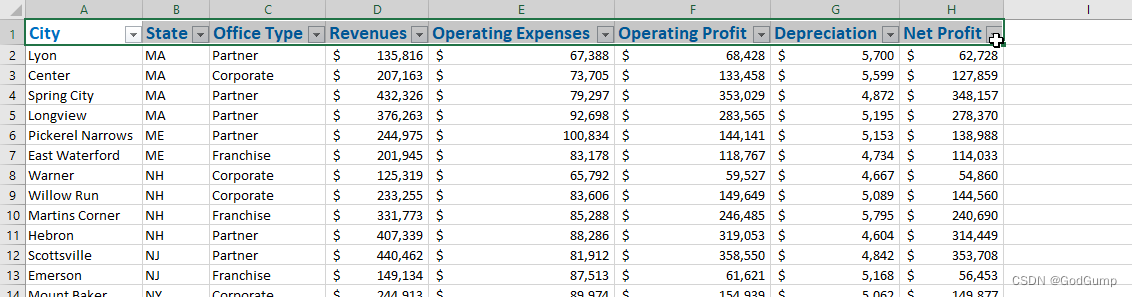
单击边框下拉箭头,然后单击 Thick Bottom Border:
Excel 工作簿打开,单击边框下拉箭头,然后单击 Thick Bottom Border
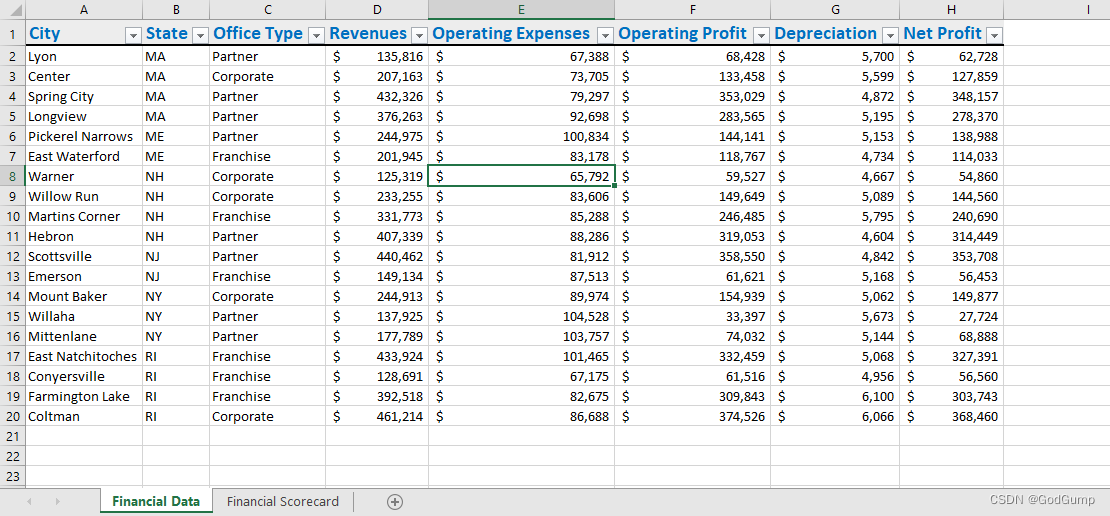
边框将被添加。现在,单击填充下拉箭头,选择此处显示的颜色:
Excel 工作簿打开,添加了边框,单击填充下拉箭头,选择颜色
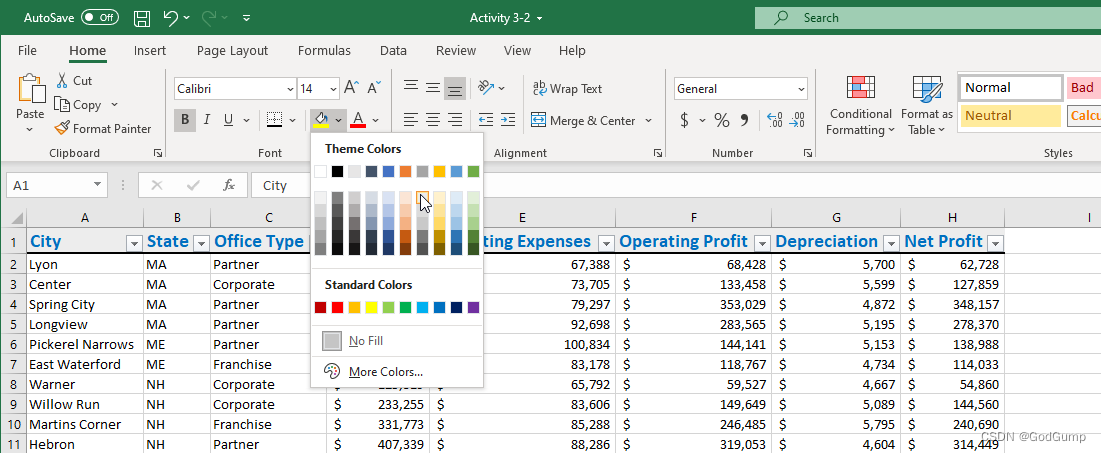
点击任意单元格取消选择标题行。检查您的格式更改:
Excel工作簿打开,文档中的格式更改已生效。

将您的工作簿保存为“Activity 3-2 Complete”。关闭Microsoft 365 Excel以完成此活动。
Exercise: Searching for and replacing data
Let’s get started!
You have been asked to make some changes to the Sales Report. Rather than manually changing every cell you decide to use the Find and Replace tool.
- Click on the link below to open the Microsoft Excel exercise document you can use to complete this exercise.
Exercise: Searching for and replacing data
- First, you need to replace all of the forward slashes separating the countries and regions with a hyphen. If you have any area of the spreadsheet highlighted, click outside the highlight to cancel it. Click Home → Find & Select → Replace:
Excel workbook open, Home tab selected, Find & select clicked, a small pane open, Replace option selected
- Type the forward-slash character (“/”) in the “Find what” field, type space, hyphen, space (“ – “), in the “Replace with” field, then click Replace All:
Find and Replace box open, Find What field typed slash character, Replace With field typed Space hyphen, Replace All selected
- An information dialog box will appear indicating that the operation is complete, and 20 replacements were made. Click OK:
Information dialog box open, indicating that the operation is complete, “OK” button selected
- Now click on the Email Addresses tab:
Excel workbook open, Email Addresses tab selected
- Notice that the forward slashes on this sheet have not been replaced. Click on the Sales Data tab to return to that sheet:
Email Addresses tab open, the replacement was applied in this document. Sales Data tab selected
- Now Click the Options button in the Find and Replace dialog box, select Workbook from the Within drop-down menu, then click Replace All:
Find and Replace dialog window open, Options button clicked, Workbook chosen from Within drop down menu, Replace all clicked
- Note that the Information dialog box now reports that another 20 replacements have been made, this time on the Email Addresses sheet:
Email Address tab open, information dialog box open indicating how many replacements was made
- The next task is to remove any values of zero from the quarterly sales numbers. Switch back to the Sales Data worksheet and replace the contents of the Find what field with a zero (“0”). Next, select the contents of the Replace with field and press Delete. Finally, click Replace All:
Sales Data tab open, Find and Replace window open, Find what field typed “0”, Replace with field deleted, Replace All clicked
- Once you have clicked OK to acknowledge the 40 replacements, note that the cells with a value of zero been replaced, and any zeros in the quarterly sales values have also been removed:
Sales data workbook open, the changes were applied
- Click the Undo drop-down arrow on the Quick Access toolbar and select the most recent replace action to restore the correct data:
Excel workbook open, at the Quick Access toolbar the Undo drop-down arrow clicked, the most recent replace action selected
- Now click to select the Match entire cell contents checkbox and, once again, click Replace All:
Find and Replace dialog box open, Match entire cell contents checkbox selected, Replace All option selected
- Now only the six cells that have a zero as the entire cell contents have been replaced:
Excel workbook open, the changes were applied in the document
- Click Close to close the Find and Replace dialog box, then save your workbook as Activity 3-4 Complete. Close Microsoft 365 Excel to complete this activity.
练习:搜索和替换数据
让我们开始吧!
你被要求对销售报告进行一些更改。而不是手动更改每个单元格,你决定使用查找和替换工具。
点击下面的链接打开Microsoft Excel的练习文档,你可以使用这个文档完成练习。
练习:搜索和替换数据
首先,你需要将所有国家和地区之间的斜杠替换为连字符。如果你已经在电子表格中选择了任何区域,请点击区域外面取消选择。点击首页→查找和选择→替换:
Excel工作簿已打开,选择了首页选项卡,点击了查找和选择,打开了一个小窗格,选择了替换选项
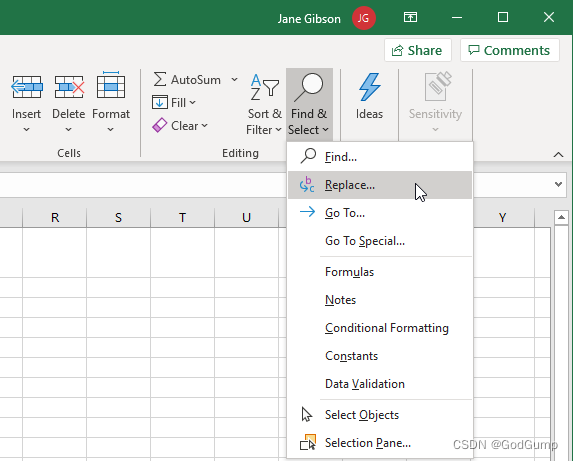
在“查找内容”字段中键入斜杠字符 (“/”),在“替换为”字段中键入空格、连字符、空格(" - “),然后点击"全部替换”:
查找和替换对话框已打开,查找内容字段输入斜杠字符,替换为字段输入空格连字符,选择全部替换
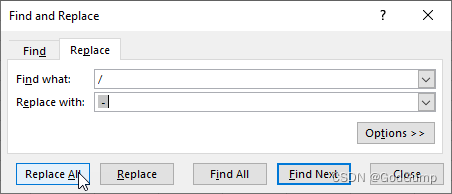
一个信息对话框将出现,指示操作已完成,并且进行了20次替换。点击"确定":
信息对话框打开,指示操作已完成,选择"确定"按钮
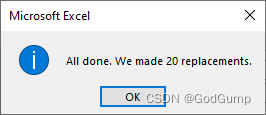
现在点击"电子邮件地址"选项卡:
Excel工作簿已打开,"电子邮件地址"选项卡被选中
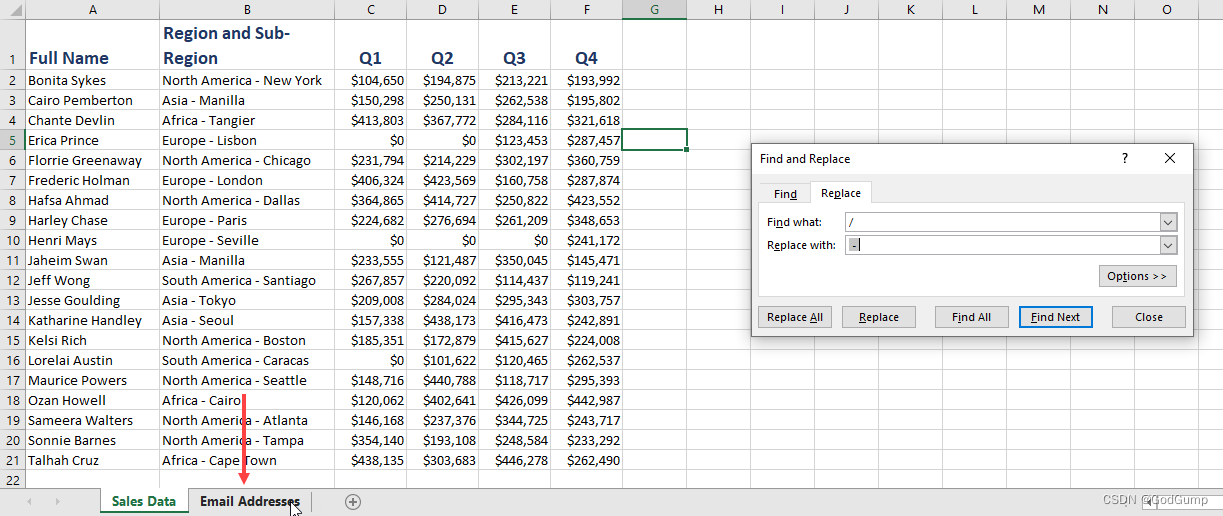
注意到这个工作表上的斜杠没有被替换。点击"销售数据"选项卡返回到那个工作表:
"电子邮件地址"选项卡已打开,替换未应用在这个文档中,"销售数据"选项卡被选中
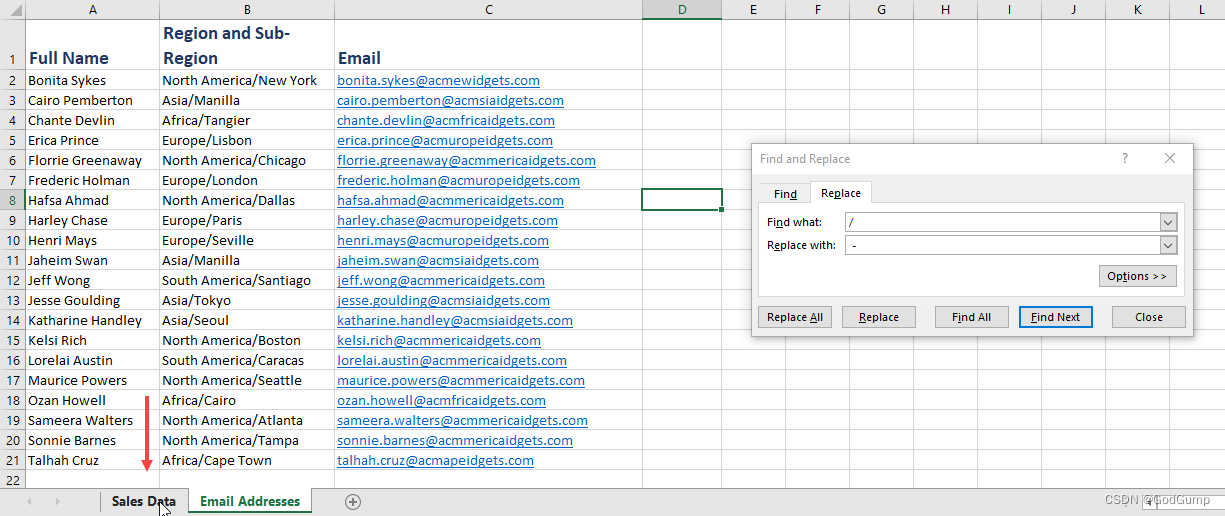
现在点击查找和替换对话框中的"选项"按钮,从"在"下拉菜单中选择"整个工作簿",然后点击"全部替换":
查找和替换对话框已打开,点击了选项按钮,选择了整个工作簿,点击了全部替换
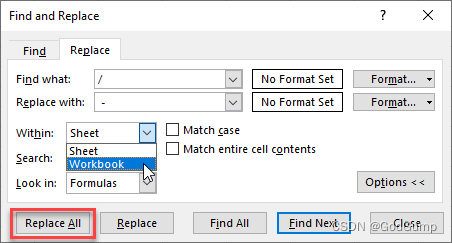
注意到信息对话框现在报告又进行了20次替换,这次是在"电子邮件地址"工作表上:
"电子邮件地址"选项卡已打开,信息对话框打开,指示进行了多少次替换
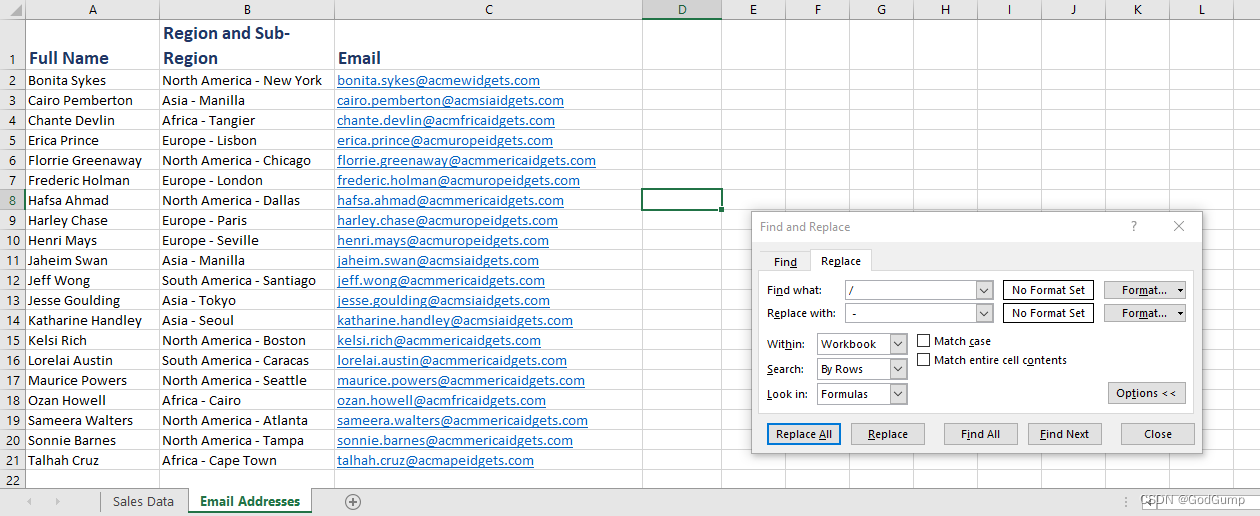
下一个任务是从季度销售数字中删除所有的零值。切换回到"销售数据"工作表,将"查找内容"字段的内容替换为零 (“0”)。接下来,选中"替换为"字段的内容,按下删除键。最后,点击"全部替换":
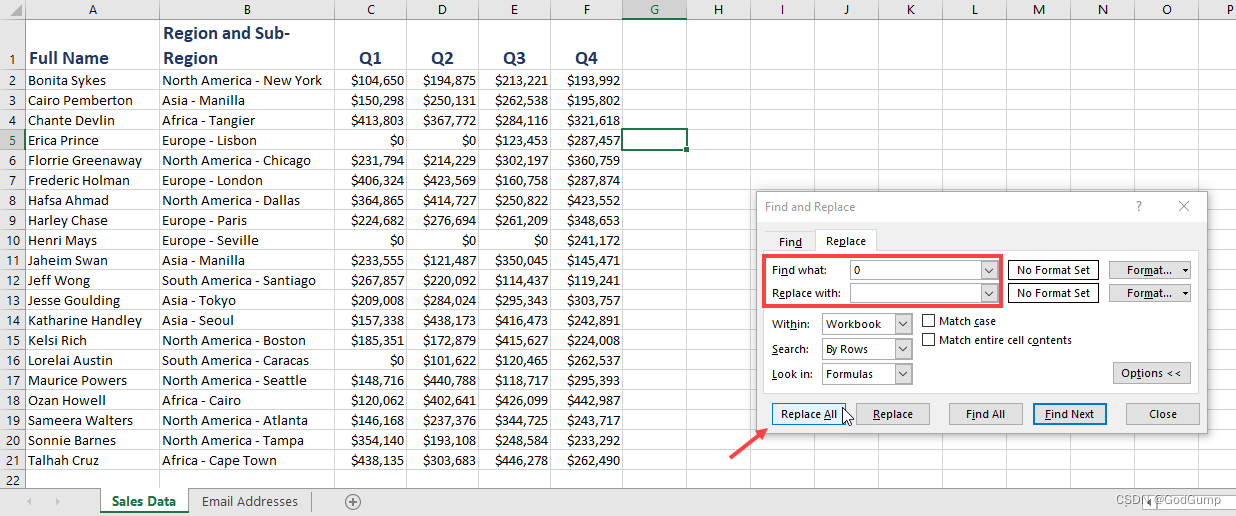
一旦点击“确定”按钮确认40个替换操作,注意到具有零值的单元格已被替换,并且季度销售数据中的任何零值也已被删除:
打开销售数据工作簿,更改已应用
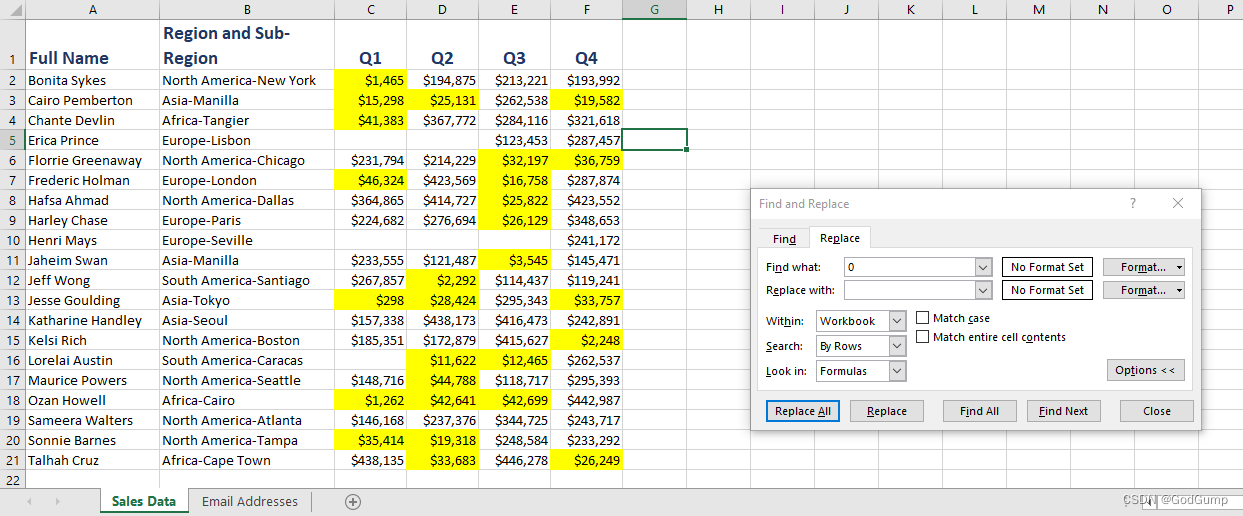
点击快速访问工具栏上的撤消下拉箭头,并选择最近的替换操作以恢复正确的数据:
打开Excel工作簿,点击快速访问工具栏上的撤消下拉箭头,选择最近的替换操作
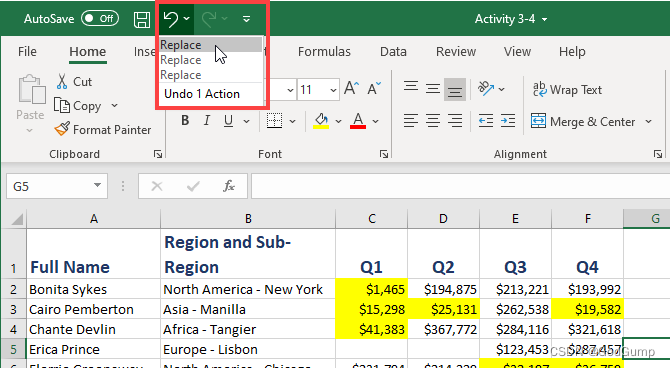
现在点击以选择“匹配整个单元格内容”复选框,然后再次点击“全部替换”:
打开查找和替换对话框,选择“匹配整个单元格内容”复选框,点击“全部替换”选项
现在只有包含零值的六个单元格被替换:
Excel工作簿中,只有六个包含零值的单元格被替换

点击“关闭”以关闭查找和替换对话框,然后将工作簿保存为“Activity 3-4 Complete”。关闭Microsoft 365 Excel以完成本次活动。
Refining the page layout and applying print options
Let’s get started!
You need to print a worksheet that shows sales information, but you would like to print it on four pages. Additionally, a page break must appear between the years and the regions. All pages also need title information for each row and column.
- Click on the link below to open the Microsoft Excel exercise document you can use to complete this exercise.
Exercise: Refining the Page Layout and Applying Print Options
- Insert a manual page break by first selecting cell H1 and then clicking Page Layout → Breaks → Insert Page Break:
Excel workbook open, Cell H1 selected, Page Layout tab selected, Breaks clicked, Insert Page Break option selected.
- Insert another manual page break by selecting cell H27 and then clicking Page Layout → Breaks → Insert Page Break:
Excel workbook open, Cell H27 selected, Page Layout tab selected, Breaks clicked, Insert Page Break option chosen
- Next, use your cursor to select the D6:K50 range:
Excel workbook open, the Cells D6 to K50 selected
- Click Page Layout → Print Area → Set Print Area:
Excel workbook open, the Cells are selected, Page Layout tab selected, Print Area selected, Set Print area option chosen
- Next, with the previously selected cell range still selected, click Page Layout → Print Titles:
Page Layout selected, Print Titles option selected
- The Page Setup dialog box will now be open to the Sheet tab. Click the cell selector button on the far right of the Rows to repeat at top text box:
Page Setup dialog window open, Cell selector button clicked on the far right of the Rows to repeat at top text box
- Your worksheet will now be shown. Click and drag to select rows 1 through 5:
Excel workbook open, the rows 1 through 5 was selected
- In the cell selector dialog box, click the cell selector button to return to the Page Setup dialog box, or press Enter:
Page Setup dialog box open, Cell selector button clicked
- Back at the Page Setup dialog box, click inside the Columns to repeat at left text box and type “ A : A: A:C”:
Page Setup dialog box open, Columns to repeat at left box text selected, typed “ A : A: A:C”
- Click OK to apply the new settings:
Page Setup dialog open, “OK” button clicked
- Click File → Print:
File option selected, Print option selected
- Examine the preview portion of this screen. You will see that the current worksheet has been divided into four pages. Each page has both column and row titles:
Print dialog window open, workbook appears in the preview area with the changes applied
- Save your workbook as Activity 4-2 Complete. Close Microsoft 365 Excel to complete this activity.
完善页面布局并应用打印选项
让我们开始吧!
您需要打印一个显示销售信息的工作表,但您希望将其打印在四张页面上。此外,在年份和地区之间需要显示分页符。所有页面还需要每行和每列的标题信息。
点击下面的链接以打开Microsoft Excel练习文档,您可以使用该文档完成这个练习。
练习:完善页面布局并应用打印选项
通过首先选择单元格H1,然后点击页面布局(Page Layout)→ 断点(Breaks)→ 插入分页符(Insert Page Break)来插入手动分页符:
Excel工作簿打开,选中单元格H1,选择页面布局(Page Layout)选项卡,点击断点(Breaks),选择插入分页符(Insert Page Break)选项。
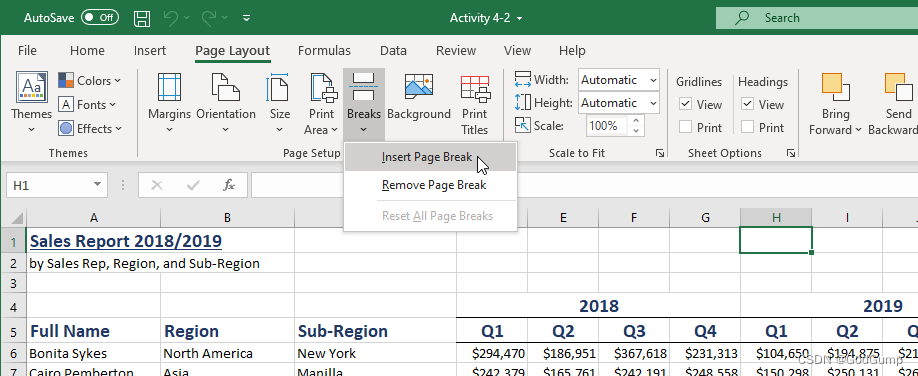
通过选择单元格H27,然后点击页面布局(Page Layout)→ 断点(Breaks)→ 插入分页符(Insert Page Break)来插入另一个手动分页符:
Excel工作簿打开,选中单元格H27,选择页面布局(Page Layout)选项卡,点击断点(Breaks),选择插入分页符(Insert Page Break)选项。
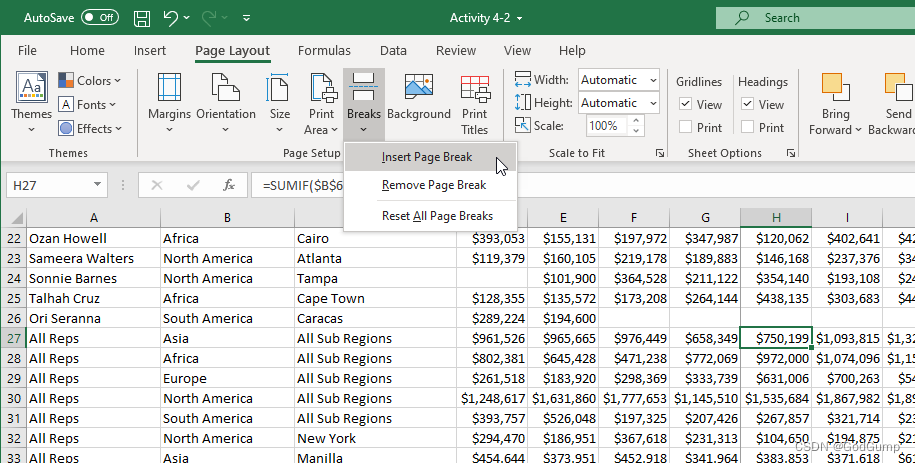
接下来,使用鼠标光标选择D6:K50范围:
Excel工作簿打开,选择了单元格D6到K50。
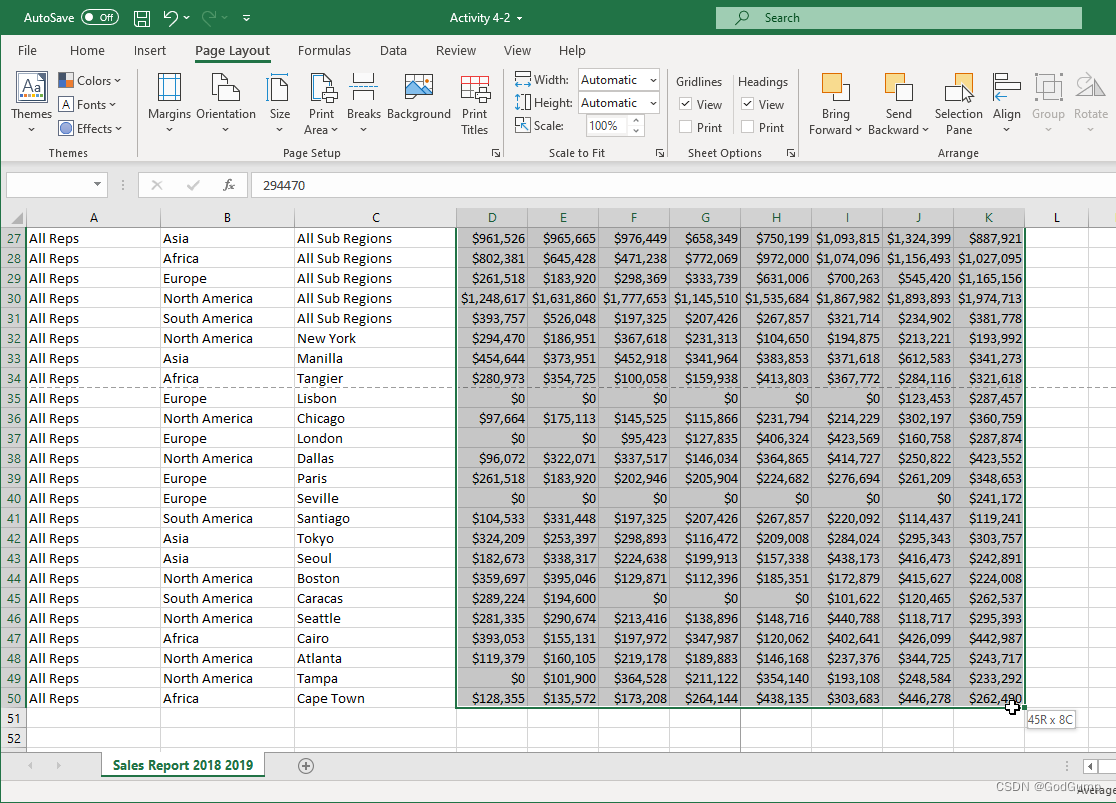
点击页面布局(Page Layout)→ 打印区域(Print Area)→ 设置打印区域(Set Print Area):
Excel工作簿打开,选择了单元格范围,选择页面布局(Page Layout)选项卡,选择打印区域(Print Area),选择设置打印区域(Set Print Area)选项。
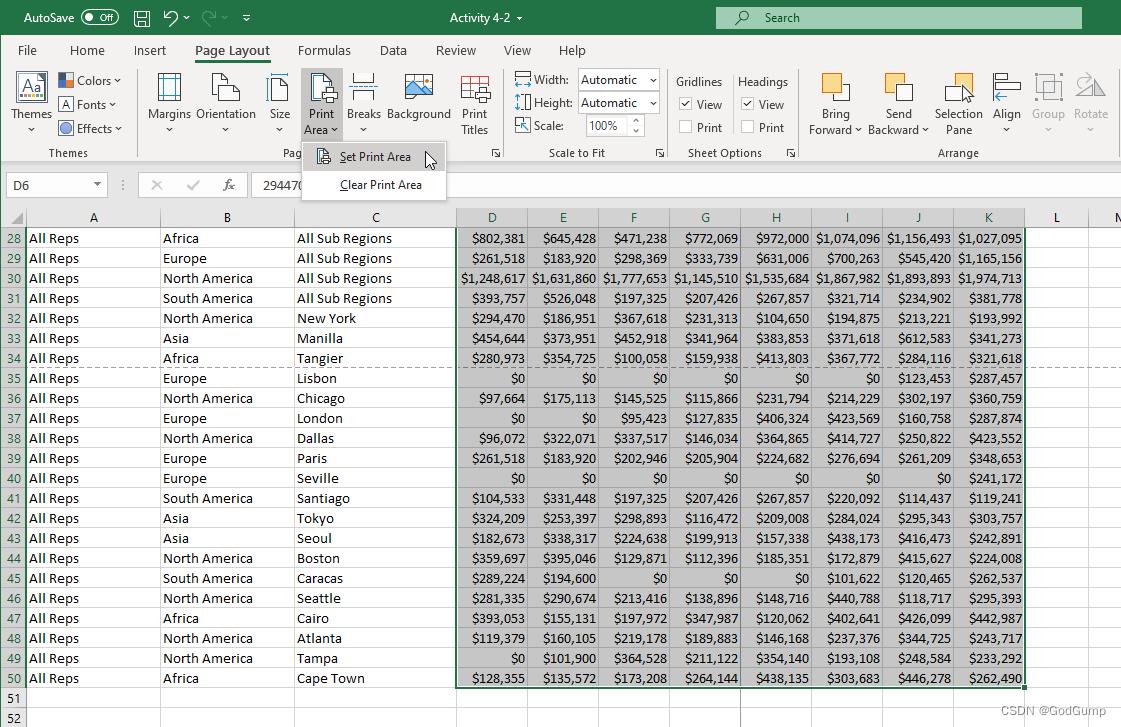
接着,保持之前选择的单元格范围选中状态,点击页面布局(Page Layout)→ 打印标题(Print Titles):
选择了页面布局(Page Layout),选择了打印标题(Print Titles)选项。
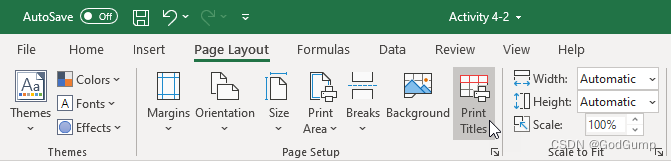
现在,页面设置对话框将打开到“工作表”选项卡。点击在顶部重复的行的右侧的单元格选择器按钮:
页面设置对话框打开,点击在顶部重复的行的单元格选择器按钮。
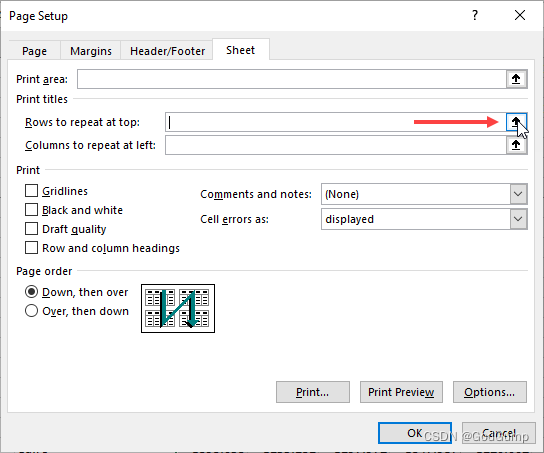
您的工作表现在会显示出来。点击并拖动以选择从第1行到第5行的行:
Excel工作簿打开,选择了第1行到第5行的行。
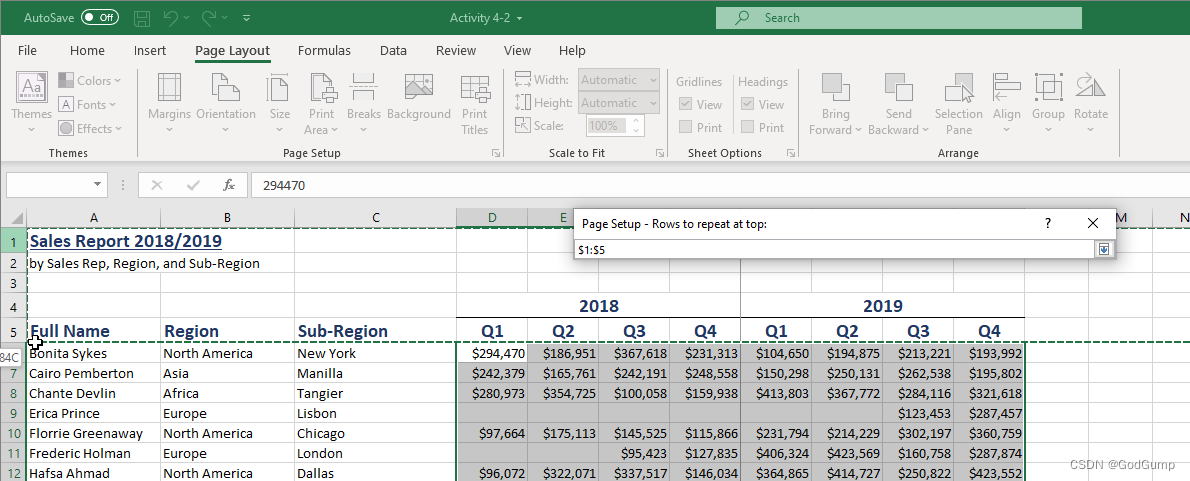
在单元格选择器对话框中,点击单元格选择器按钮以返回页面设置对话框,或者按Enter键:
页面设置对话框打开,点击单元格选择器按钮。

在“页面设置”对话框中,点击“左侧重复的列”文本框,并输入“ A : A: A:C”:
页面设置对话框打开,选择“左侧重复的列”文本框,输入“ A : A: A:C”
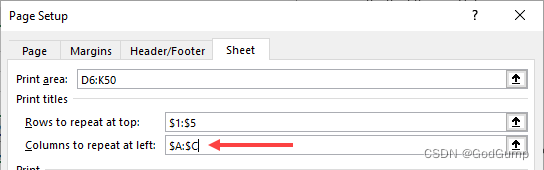
点击“确定”以应用新的设置:
页面设置对话框打开,点击“确定”按钮
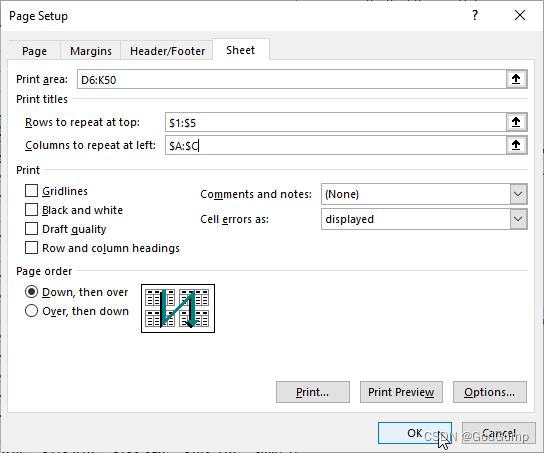
点击“文件” → “打印”:
选择“文件”选项,点击“打印”选项
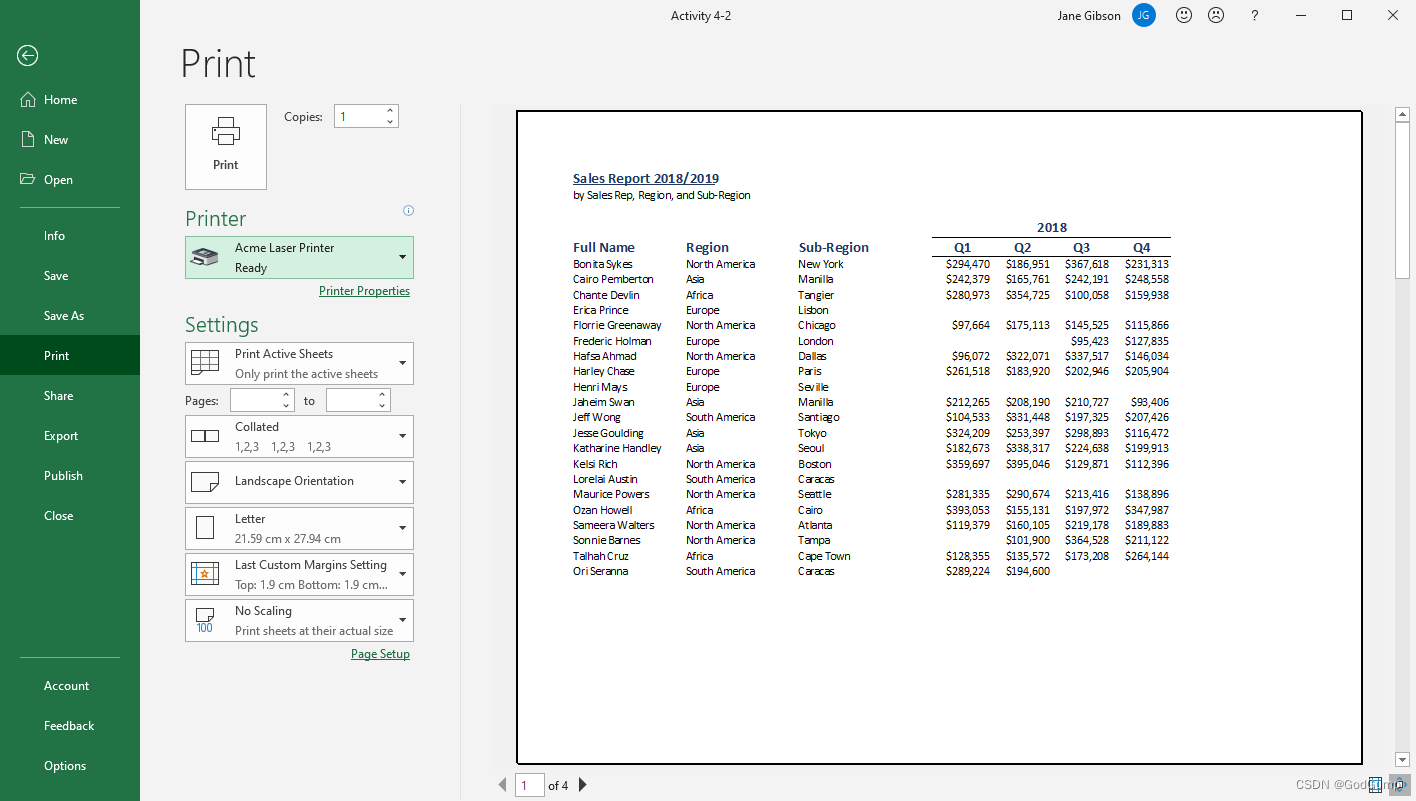
检查屏幕上的打印预览部分。您会看到当前的工作表被分成了四页,每页都包含列和行的标题:
打印对话框打开,工作簿在预览区显示了应用的更改

将您的工作簿保存为“Activity 4-2 Complete”。关闭Microsoft 365 Excel以完成本活动。
Exercise: Using formulas and functions
Let’s get started!
In this activity, you will start working on a rough draft of a sales report.
- Click on the link below to open the Microsoft Excel exercise document you can use to complete this exercise.
Exercise: Using formulas and functions
- First, we need to set up formulas to calculate the operating profit. Click cell F2:
Excel workbook open, Cell F2 selected
- Type an equal sign (=), then, click cell D2:
Excel workbook open, equal sign typed in the Cell F2 field, D2 selected and added in the Cell F2
- Type a minus sign (-) and click cell E2:
Excel workbook open, minus sign typed in the Cell F2, Cell E2 selected and added in the Cell F2
- Press Enter to complete the formula:
Excel workbook open, the result appears in the Cell F2
- We will complete the rest of the column in the next activity. For now, click cell H2 and repeat Steps 2 through 5 to create a formula that subtracts depreciation from the operating profit, to calculate the net profit:
Excel workbook open, Cell H2 selected, Cell F2 and G2 added in the Cell H2
- Now, let’s work on our scorecard. Click cell L2, where we want to calculate the average revenue:
Excel workbook open, Cell L2 selected
- Click the AutoSum arrow on the Home tab and click Average:
\workbook open, Home tab selected, AutoSum command selected, a small pane open, Average option selected
- By default, Excel will select the values in the first part of the row, but this is not what we want. Click and drag to select cells D2 to D20 instead:
Excel workbook open, Cells D2 to D20 selected
- Press Enter to complete the formula and calculate the results:
Excel workbook selected, the formula was calculated and appears in L2
- Cell L3 should now be selected. This is where we want to display the highest revenue. Let’s use a different method to create this formula. To begin, click Formulas → Insert Function:
Excel workbook open, L3 selected, Formulas tab open, Insert Formula option selected
- Ensure that the Most Recently Used category is selected. Then, click the MAX function from the list. Click OK to insert it. If you do not see the MAX function in the Most Recently Used category, change to the Maths category and select it from there.
Insert Function dialog window open, Most Recently Used category selected, Max function chosen and “OK” button clicked
- Now, click and drag to select cells D2 to D20:
Excel workbook open, Cells D2 to D20 selected
- Click OK to complete the formula and calculate the results:
Function Arguments dialog window open, “OK” button selected
- Now, use either the AutoSum command or the Insert Function command to calculate the lowest value in the Expenses column with the MIN function:
Excel workbook open, Cell L4 selected with the MIN function
- Let’s double-check the first two values we calculated. Select cells D2 to D20:
Excel workbook open, Cell D2 to D20 selected
- Look at the average calculated in the status bar, and compare it to the average calculated using the function:
Excel workbook open, average was calculated in the status bar
- However, the MAX function is not shown here. Right-click anywhere on the Status bar, then click to select Maximum in the Customize Status Bar dialog box:
Excel workbook open, right clicked in the status bar, Customize Status Bar dialog open, Maximum option selected
- Click anywhere in the Excel window outside of the Customize Status Bar dialog box. The dialog box will close, and you will now see the Max value in the status bar, which should match the result of the Max function:
Excel workbook open, dialog box closed, the Max value appears n the status bar. And match with the result in the Max function
- Save your workbook as Activity 2-2 Complete. Close Microsoft 365 Excel to complete this activity.
练习:使用公式和函数
让我们开始吧!
在这个活动中,你将开始草拟一份销售报告的初步草稿。
点击下面的链接打开 Microsoft Excel 练习文档,你可以使用这个文档来完成本次练习。
练习:使用公式和函数
首先,我们需要设置公式来计算营业利润。点击单元格 F2:
Excel 工作簿打开,选择了单元格 F2
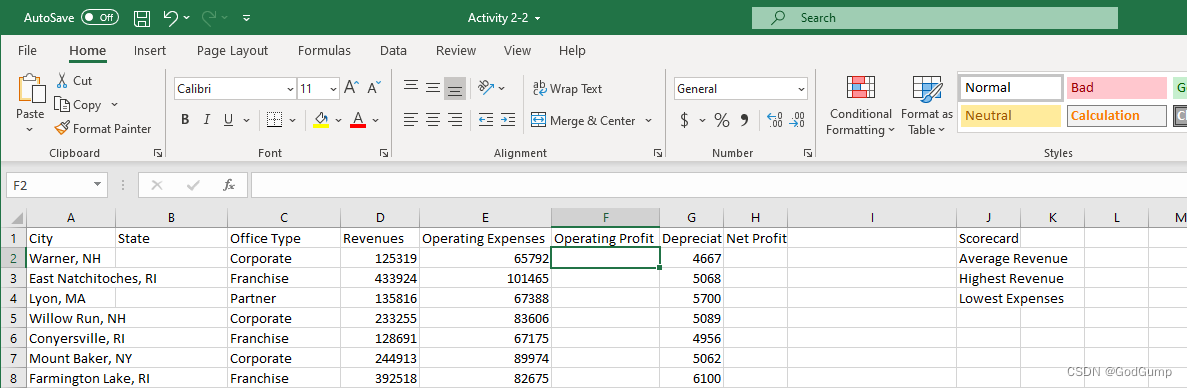
输入等号(=),然后点击单元格 D2:
Excel 工作簿打开,单元格 F2 中输入了等号,选择了单元格 D2 并添加到单元格 F2 中
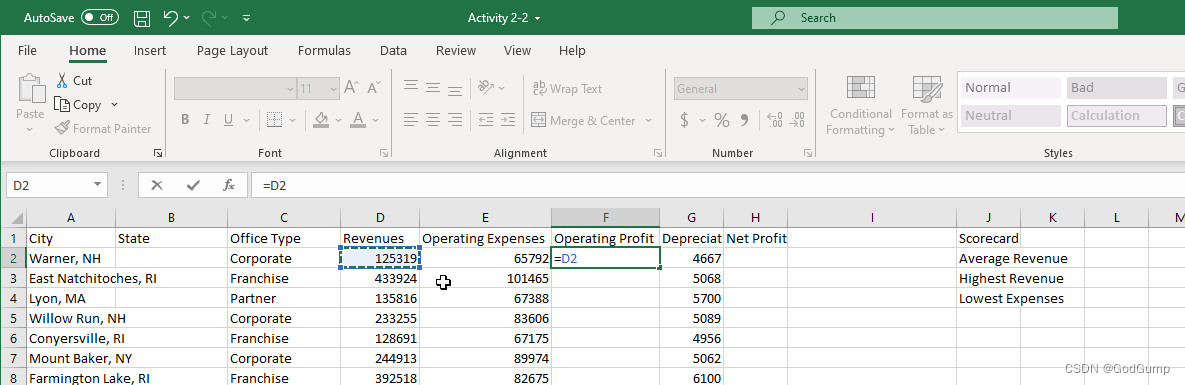
输入减号(-),然后点击单元格 E2:
Excel 工作簿打开,单元格 F2 中输入了减号,选择了单元格 E2 并添加到单元格 F2 中

按下 Enter 键完成公式:
Excel 工作簿打开,结果显示在单元格 F2 中
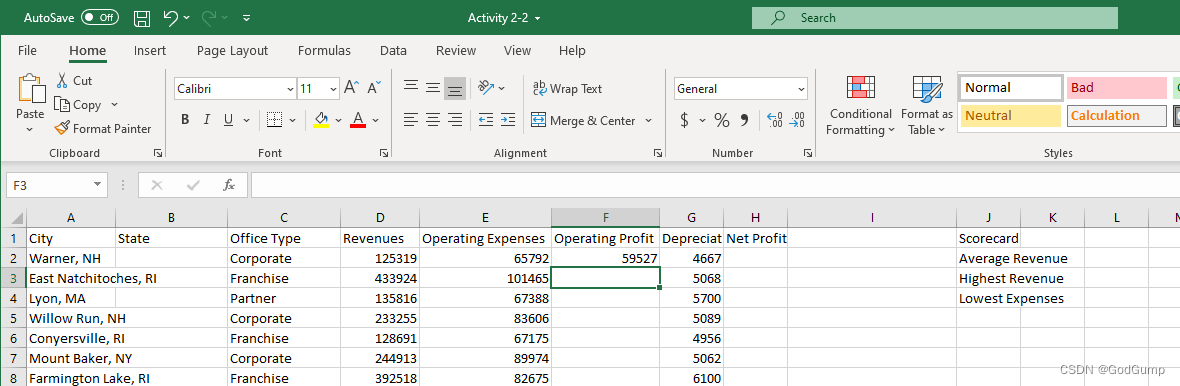
我们将在下一步完成该列的其余部分。现在,点击单元格 H2,并重复步骤 2 到 5,创建一个公式,从营业利润中减去折旧费用,计算净利润:
Excel 工作簿打开,选择了单元格 H2,将单元格 F2 和 G2 添加到单元格 H2 中
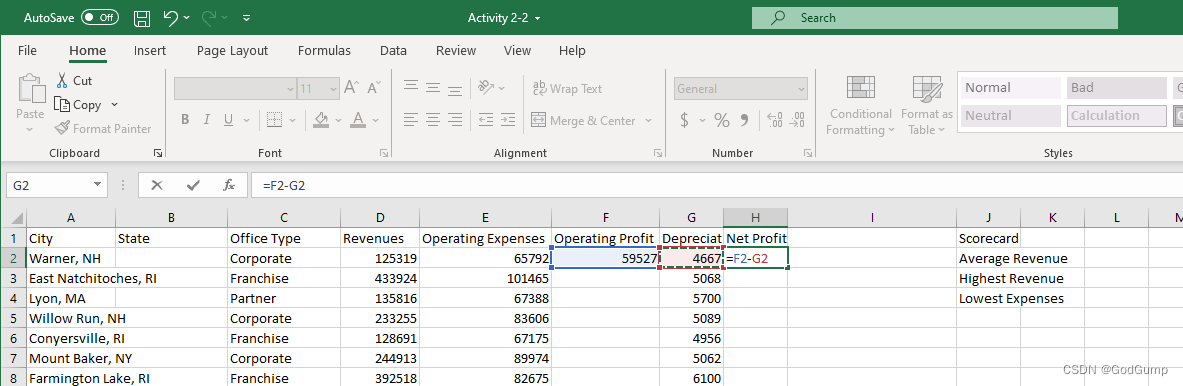
现在,让我们来处理我们的绩效评分卡。点击单元格 L2,这是我们要计算平均营收的地方:
Excel 工作簿打开,选择了单元格 L2
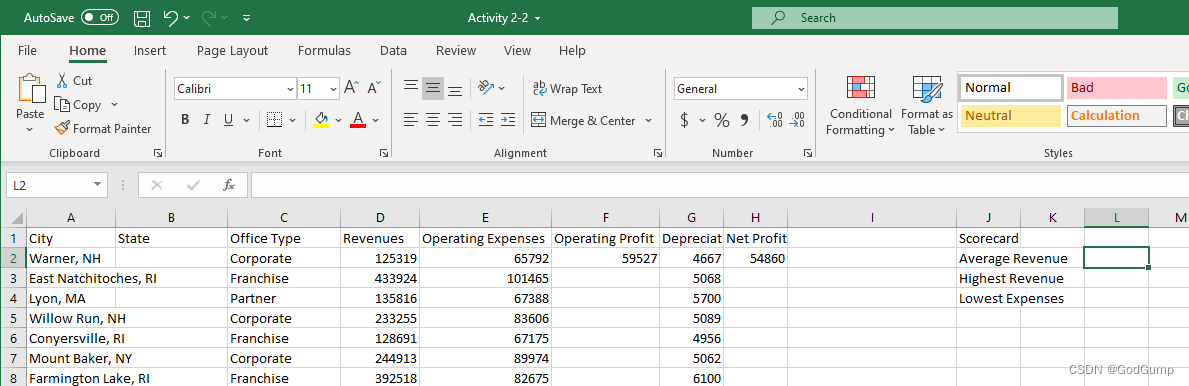
在主页选项卡上点击自动求和箭头,然后点击平均值:
Excel 工作簿打开,主页选项卡选择,自动求和命令选择,一个小窗口打开,选择了平均值选项
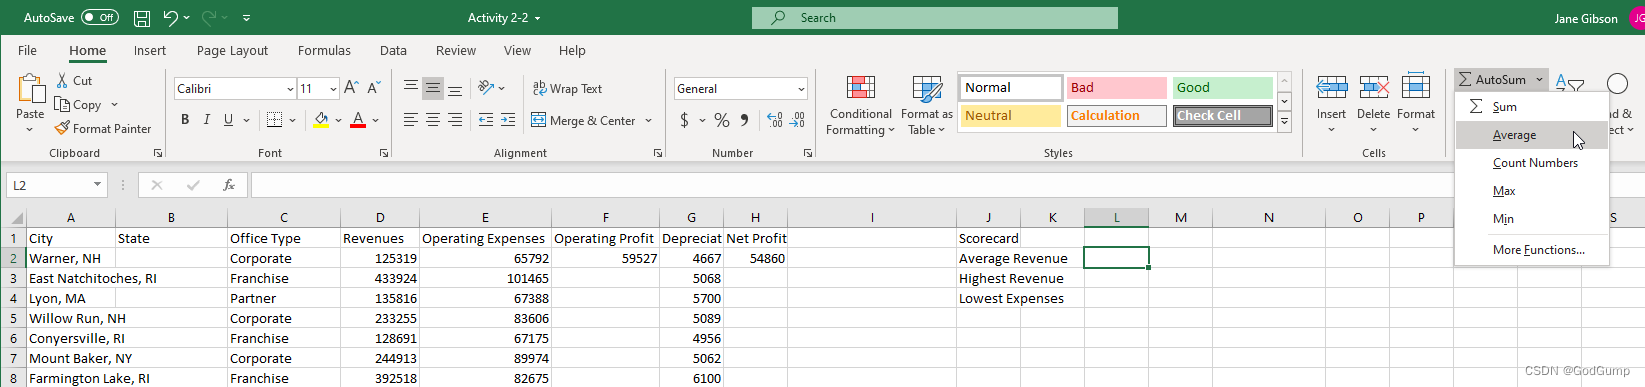
默认情况下,Excel 会选择行的前部分的值,但这不是我们想要的。点击并拖动选择单元格 D2 到 D20:
Excel 工作簿打开,选择了单元格 D2 到 D20
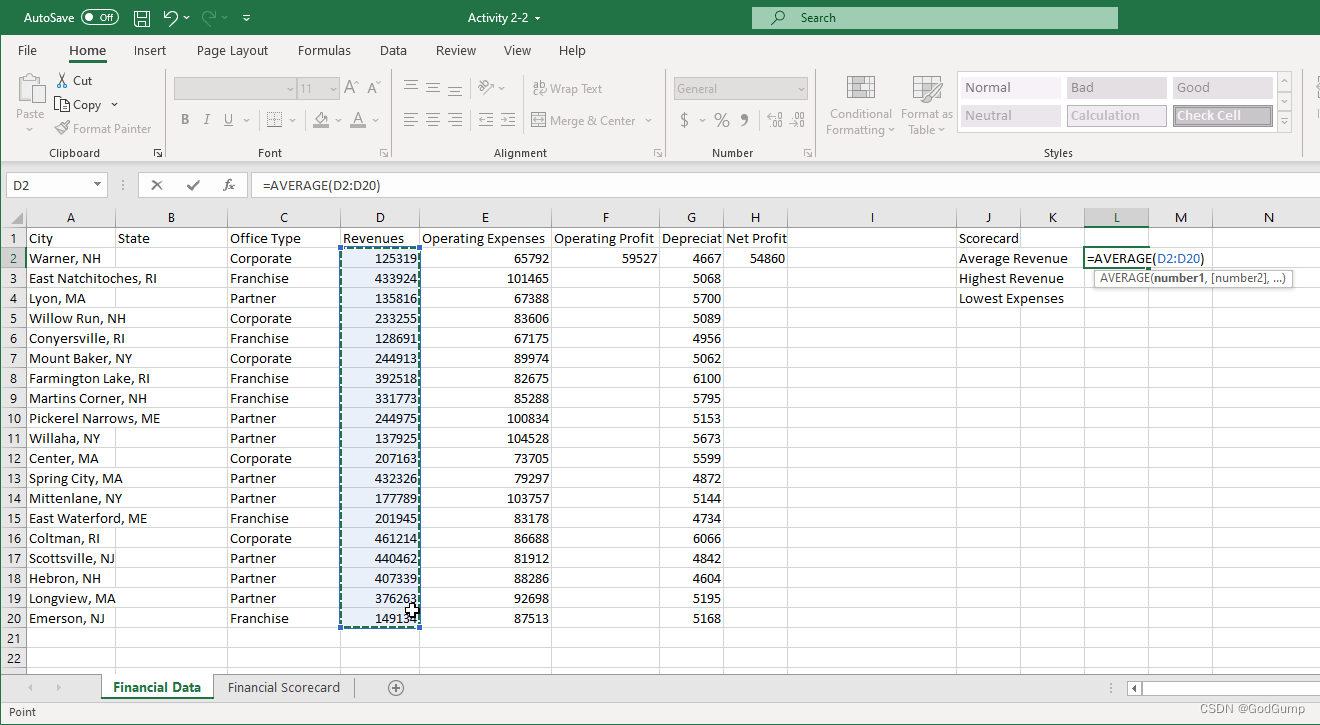
按下 Enter 键完成公式并计算结果:
Excel 工作簿选择,公式计算并显示在 L2 单元格中
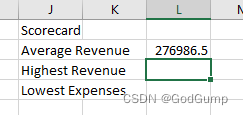
现在,应该选择单元格 L3。这是我们要显示最高营收的地方。让我们使用另一种方法创建这个公式。首先,点击公式 → 插入函数:
Excel 工作簿打开,选择了单元格 L3,公式选项卡打开,选择了插入函数选项
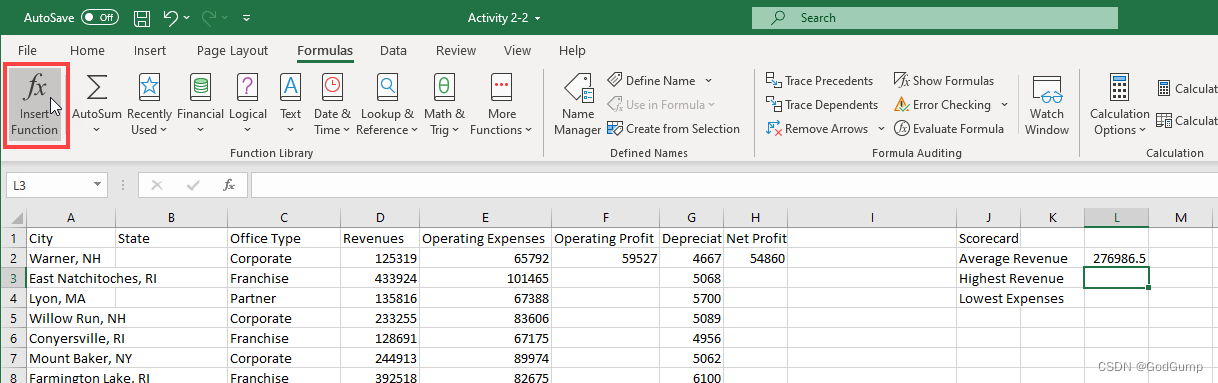
确保选择了"最近使用的"类别。然后从列表中点击"MAX"函数。点击"确定"以插入它。如果在"最近使用的"类别中没有看到"MAX"函数,可以切换到"数学"类别并从那里选择。
打开"插入函数"对话框,选择了"最近使用的"类别,选择了"MAX"函数,点击"确定"按钮。
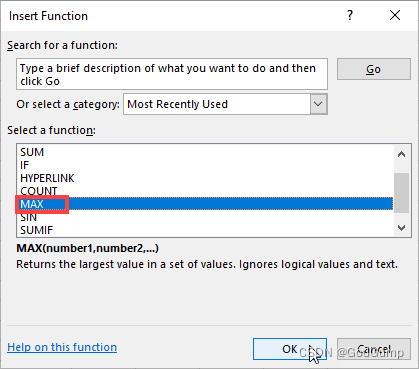
现在,点击并拖动以选择单元格D2到D20:
Excel工作簿打开,选择了单元格D2到D20。
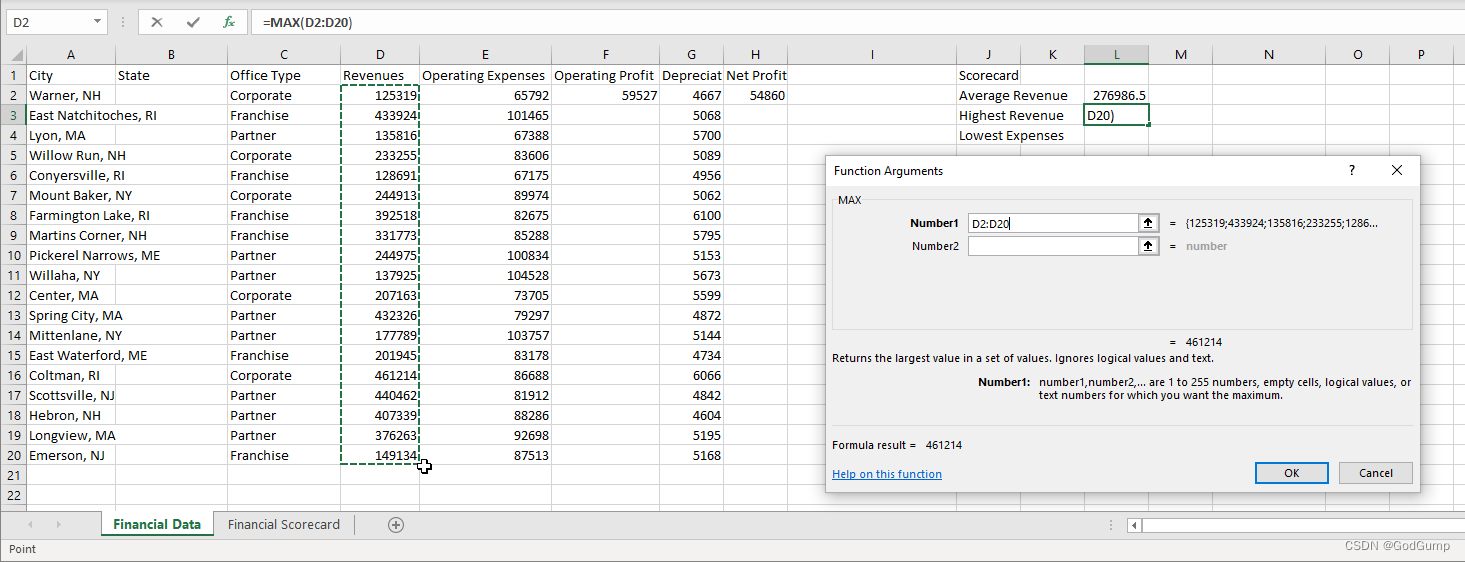
点击"确定"以完成公式并计算结果:
"函数参数"对话框打开,选择了"确定"按钮。
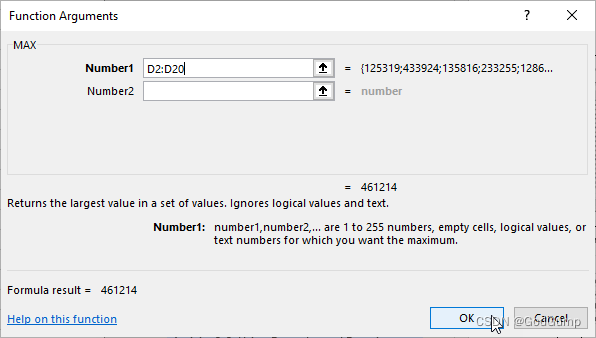
现在,使用"自动求和"命令或"插入函数"命令来使用"MIN"函数计算"支出"列中的最小值:
Excel工作簿打开,选择了包含"MIN"函数的单元格L4。
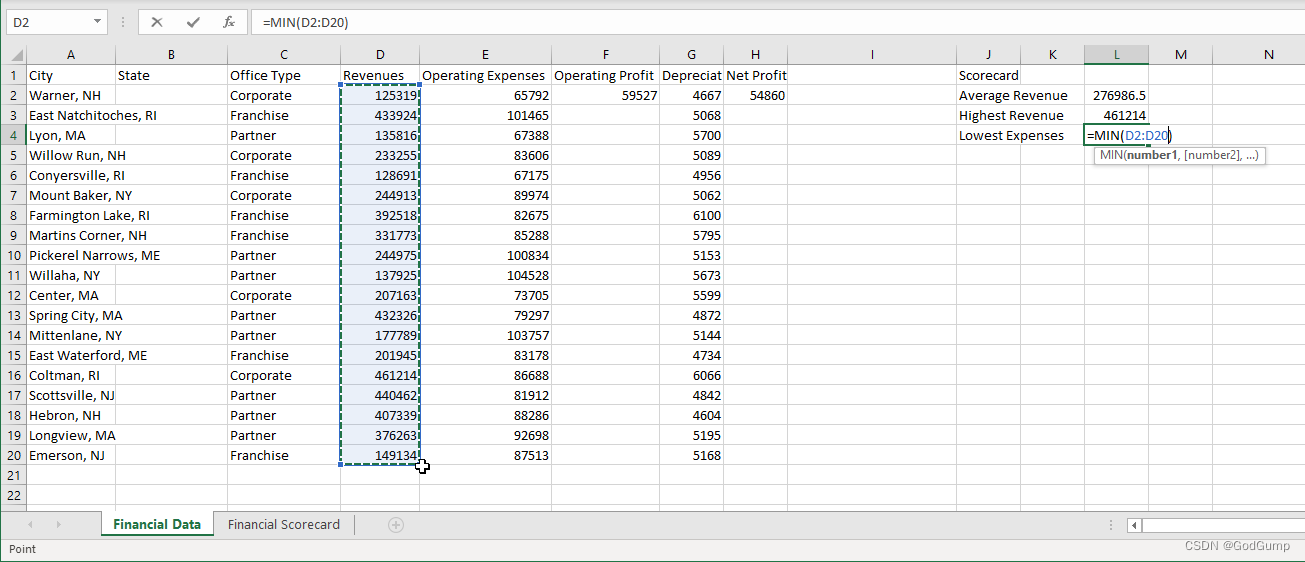
让我们再次检查前两个计算出的值。选择单元格D2到D20:
Excel工作簿打开,选择了单元格D2到D20。
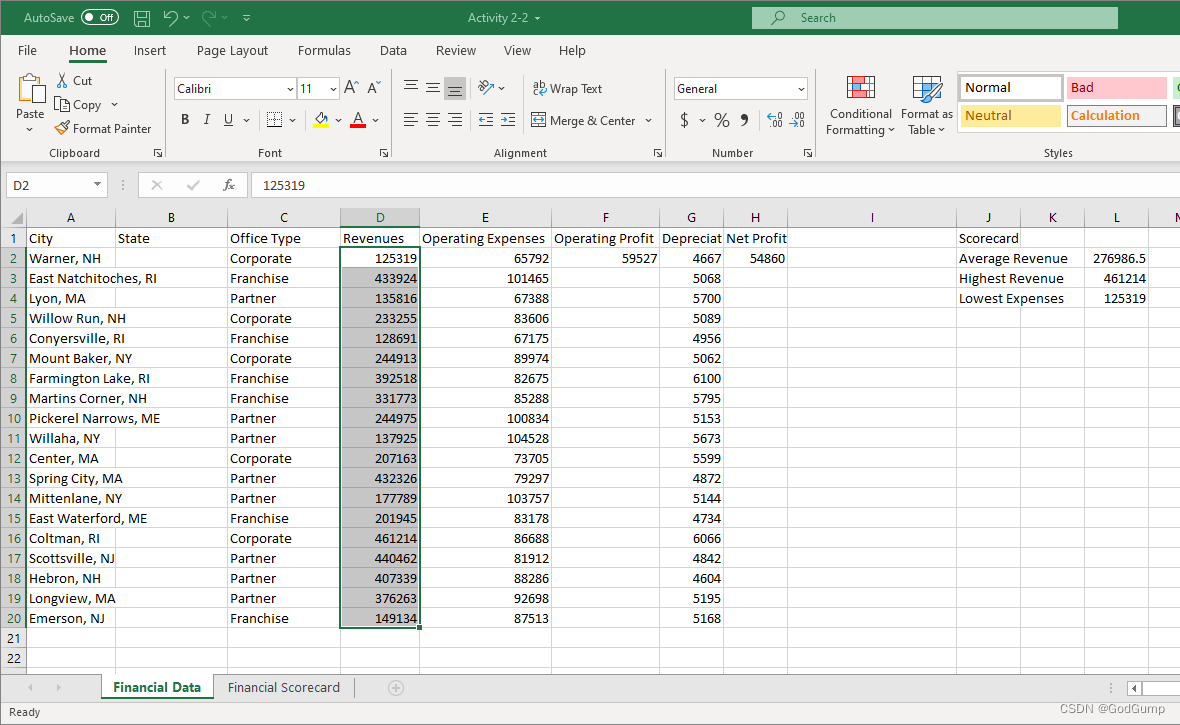
查看状态栏中计算出的平均值,并将其与使用函数计算出的平均值进行比较:
Excel工作簿打开,状态栏中计算出了平均值。
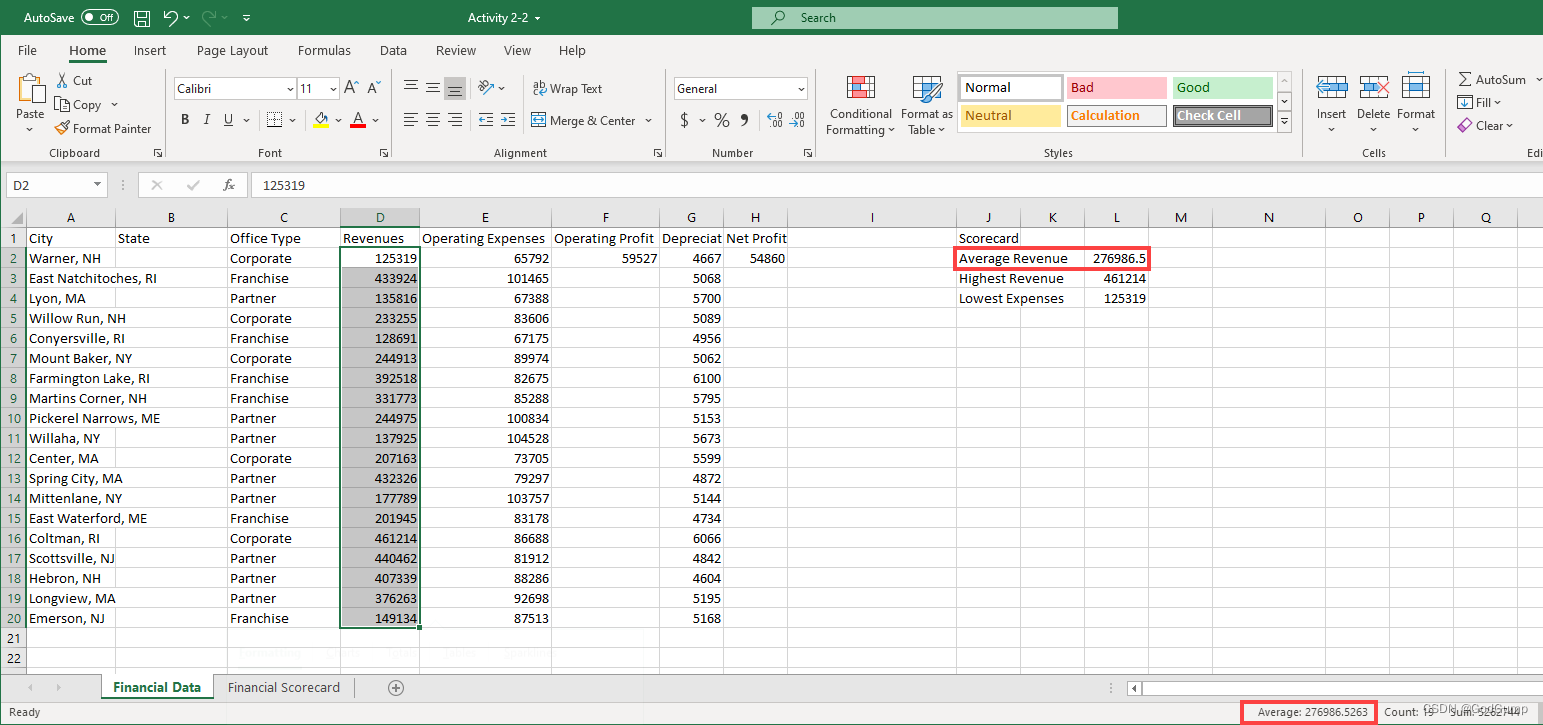
然而,在这里没有显示"MAX"函数。在状态栏的任何位置右键单击,然后在"自定义状态栏"对话框中点击以选择"最大值":
Excel工作簿打开,在状态栏的任何位置右键单击,打开"自定义状态栏"对话框,选择了"最大值"选项。
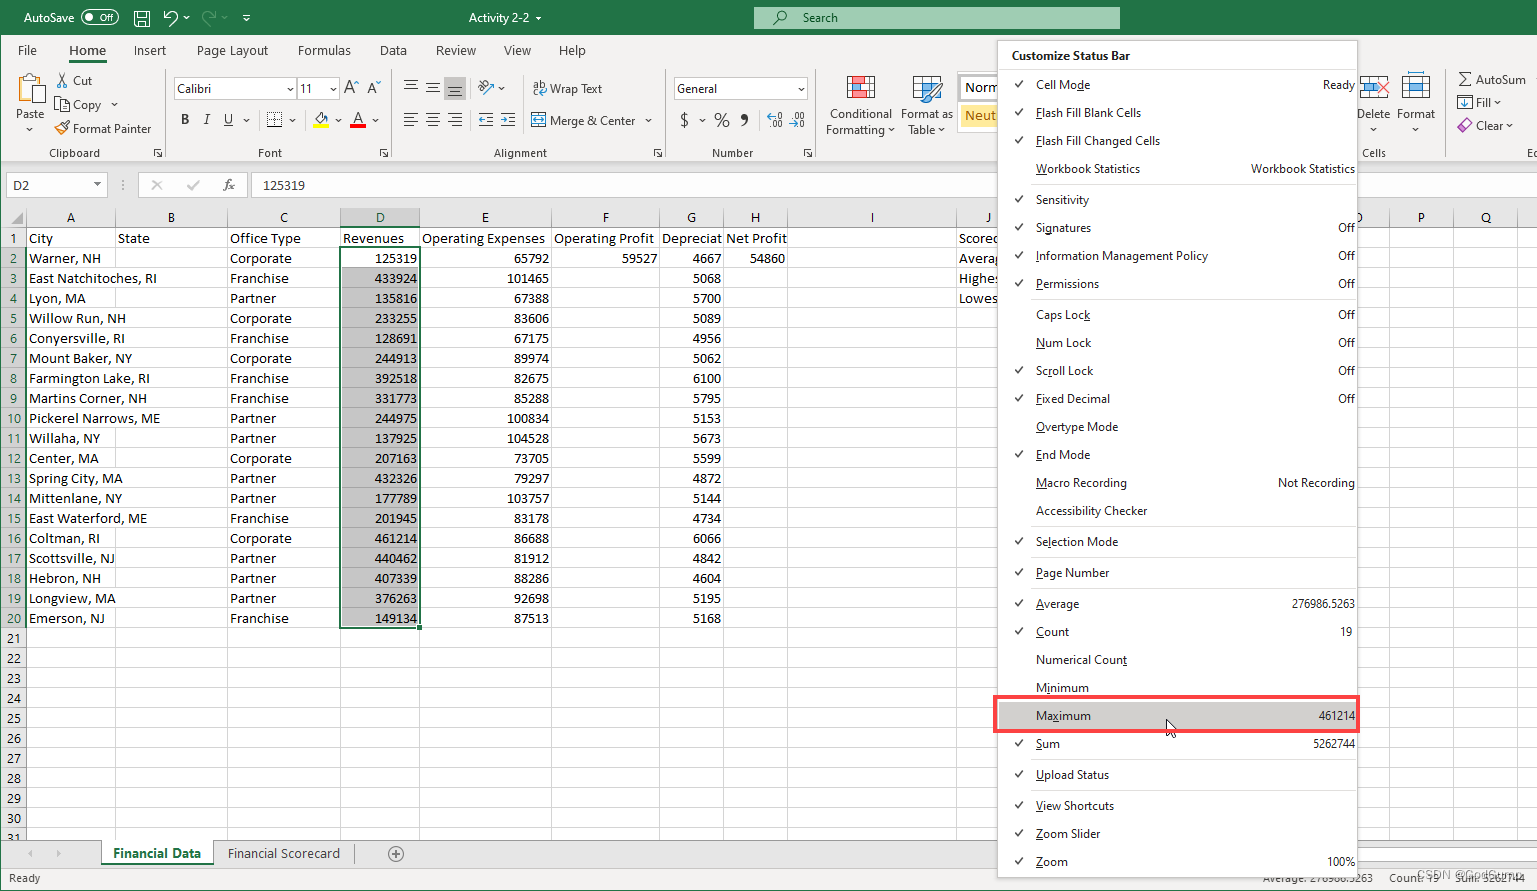
在"Excel"窗口的任何位置单击以关闭"自定义状态栏"对话框。对话框将关闭,现在在状态栏中将显示"Max"值,应与"Max"函数的结果相匹配:
Excel工作簿打开,对话框已关闭,在状态栏中显示了"Max"值,并与"Max"函数的结果相匹配。
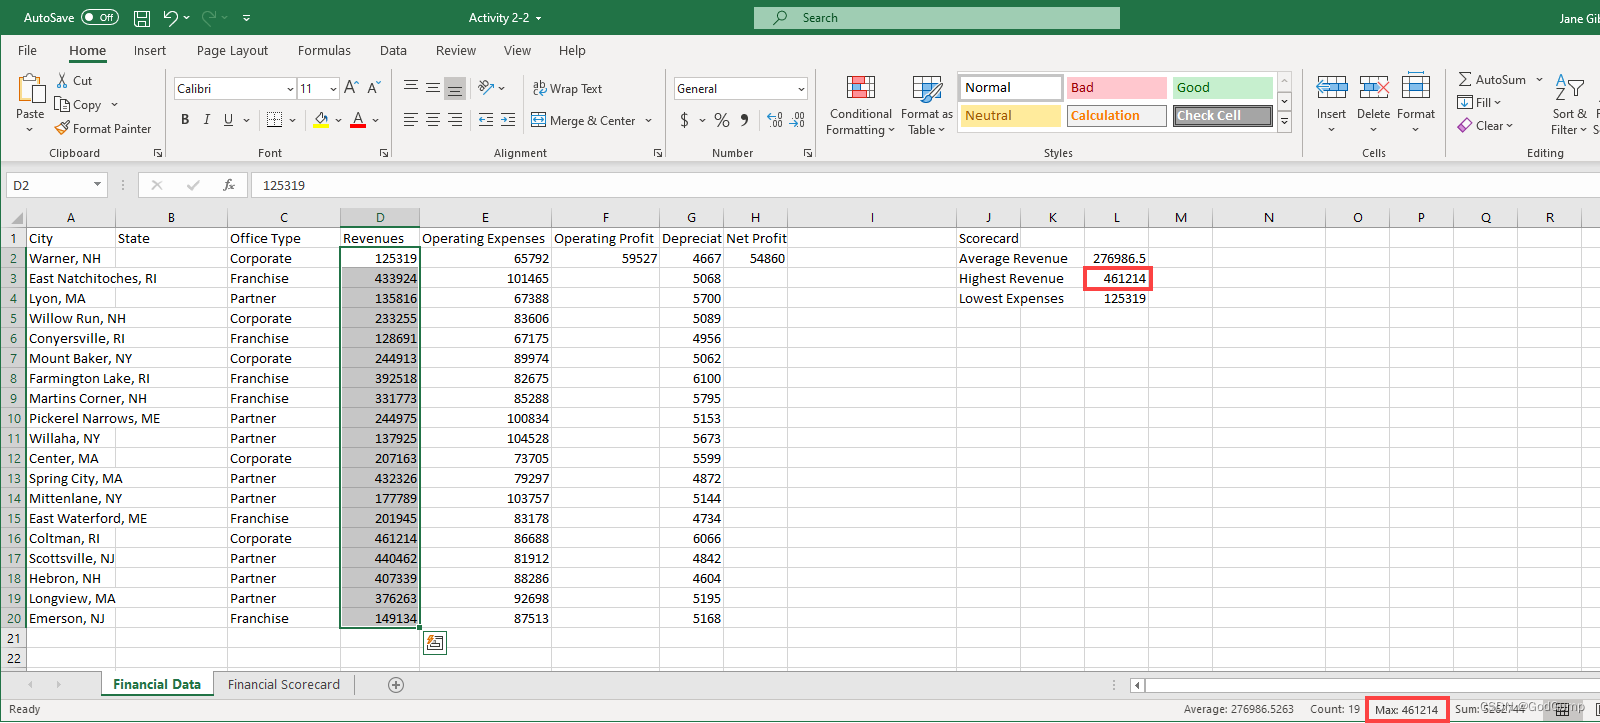
将工作簿保存为"Activity 2-2 Complete"。关闭Microsoft 365 Excel以完成此活动。
Exercise: Sort and filter data
Let’s get started!
You have been asked to present the sales report data by state and to exclude all corporate information. You will use Excel 365 sorting and filtering tools to accomplish these tasks.
- Click on the link below to open the Microsoft Excel exercise document you can use to complete this exercise.
Exercise: Sort and filter data
- Our first task is to sort the data by state. Select cells B2 to B20:
Excel workbook open, Cells B2 to B20 selected
- Now, click Home → Sort & Filter → Sort Ascending:
Excel workbook open, Home tab selected, Sort & Filter option selected, Sort Ascending chosen
- Select Expand the selection in the Sort Warning dialog box and click Sort:
Sort Warning dialog window open, Expand the selection selected, “Sort” button selected
- Review the results:
Excel workbook open, results applied in the document
- Now we want to filter out the corporate data. Select any cell within the data and click Data → Filter:
Excel workbook open, random Cell selected containing data, Data tab selected, Filter option selected
- Click the drop-down arrow in cell C1 (Office Type):
Excel workbook open, drop-down arrow selected in Cell C1
- Click in the checkbox next to Corporate to deselect, then click OK:
Excel workbook open, a small pane open, Checkbox next to Corporate option was deselected, “OK” button selected
- Review the results, and note the AutoFilter icon in cell C1, the blue row numbers, and the double lines indicating the hidden cells:
Excel workbook open, the changes were applied
- Save your workbook as Activity 2-5 Complete. Close Microsoft 365 Excel to complete this activity.
练习:排序和筛选数据
让我们开始吧!
您被要求按州对销售报告数据进行排序,并排除所有公司信息。您将使用Excel 365的排序和筛选工具来完成这些任务。
点击下面的链接打开Microsoft Excel练习文档,您可以使用它来完成这个练习。
练习:排序和筛选数据
我们的第一个任务是按州对数据进行排序。选择单元格B2到B20:
Excel工作簿打开,选择了单元格B2到B20
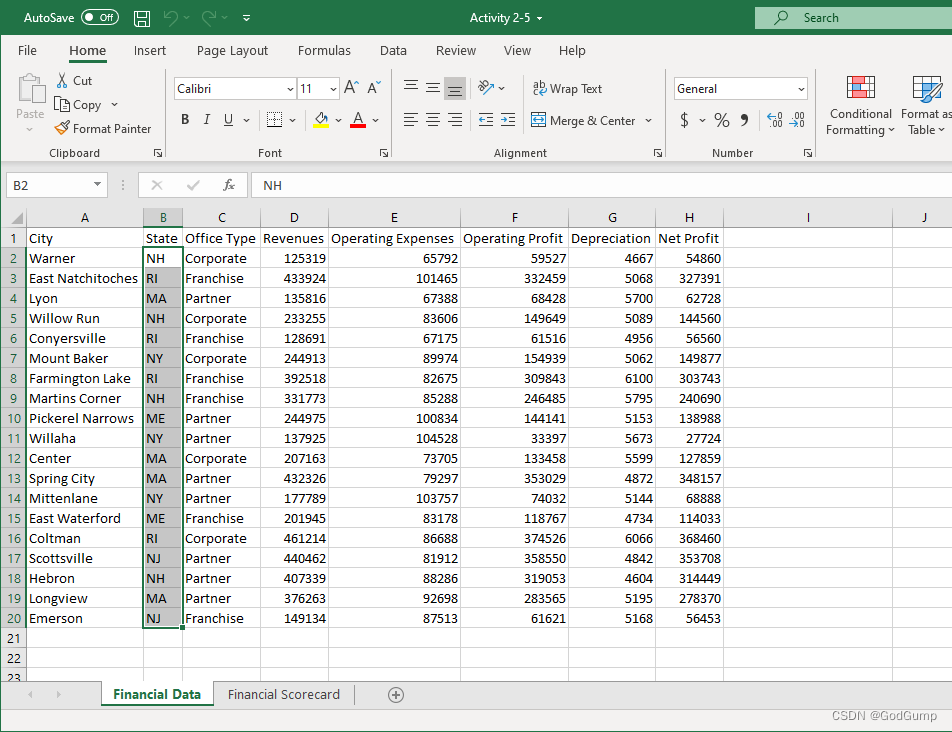
现在,点击首页 → 排序与筛选 → 升序排序:
Excel工作簿打开,选择首页选项卡,选择了排序与筛选选项,选择了升序排序
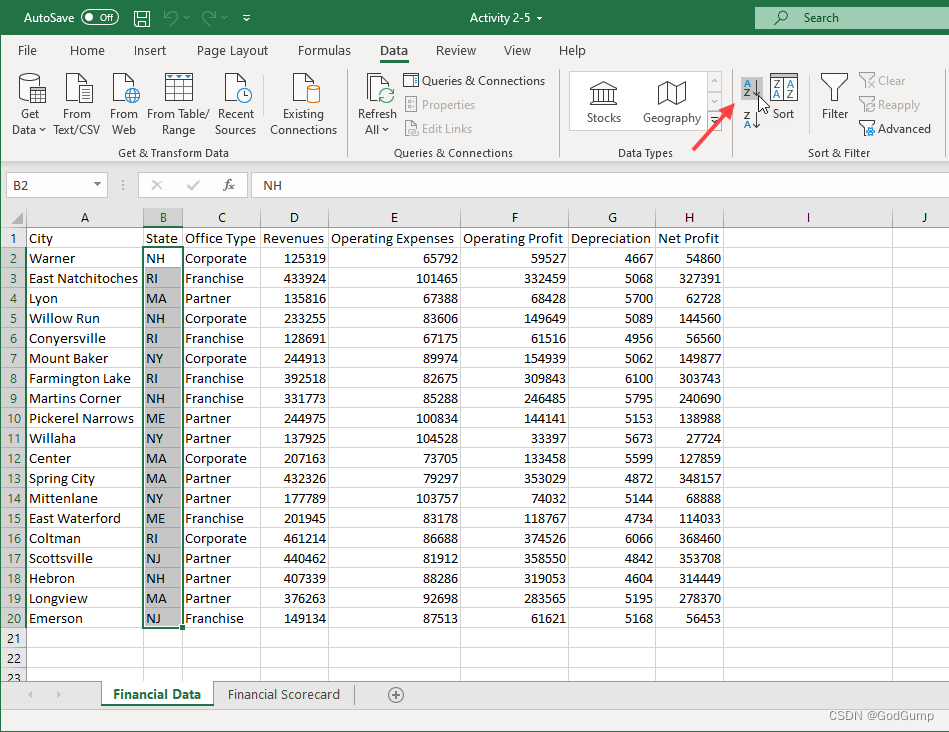
在排序警告对话框中选择扩展选择,然后点击排序:
排序警告对话框打开,选择了扩展选择,点击了"排序"按钮
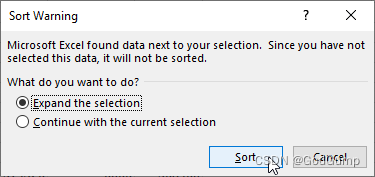
检查结果:
Excel工作簿打开,文档中应用了排序结果
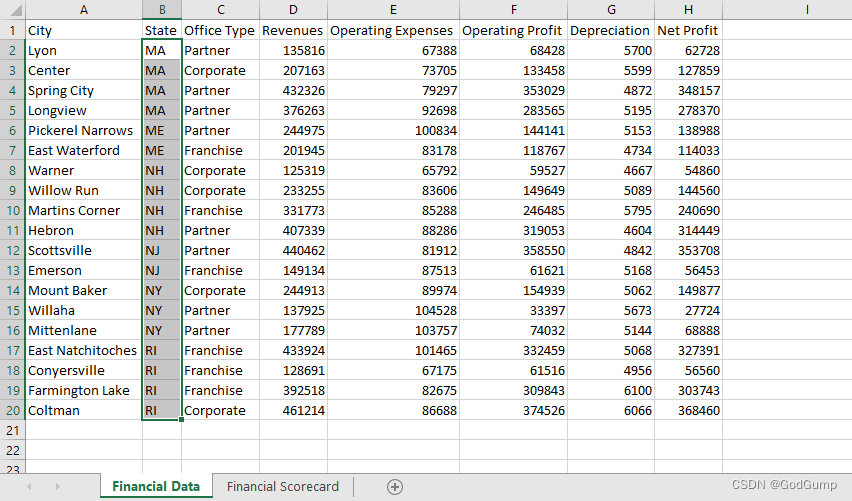
现在我们想要筛选掉公司数据。在数据中选择任何一个单元格,然后点击数据 → 筛选:
Excel工作簿打开,选择了包含数据的任意单元格,选择了数据选项卡,选择了筛选选项
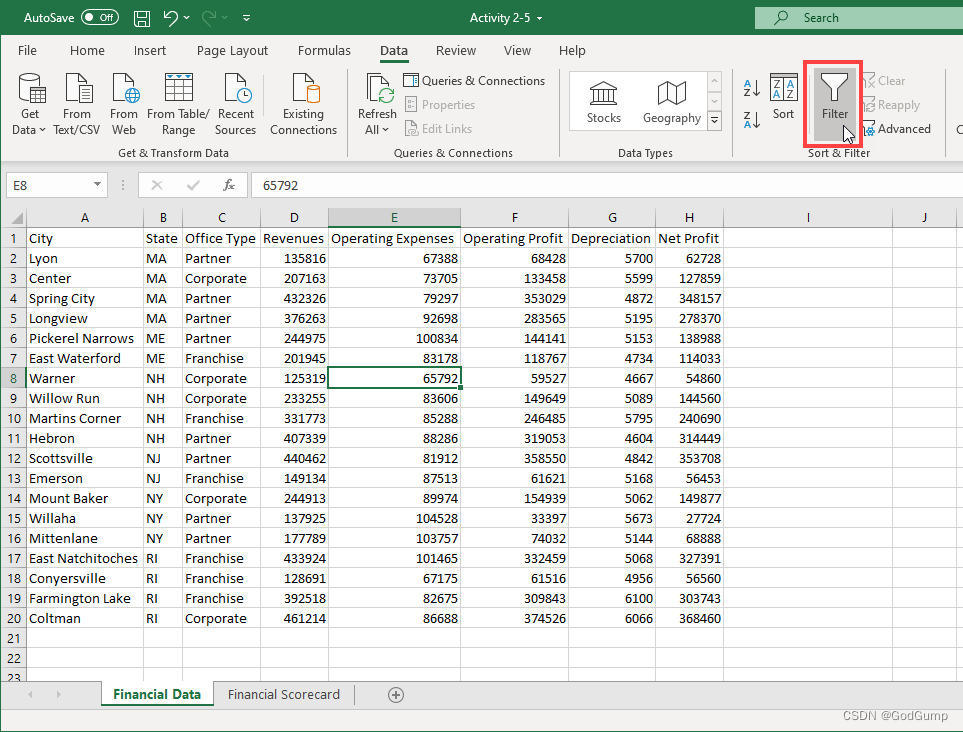
点击单元格C1中的下拉箭头(Office类型):
Excel工作簿打开,选择了单元格C1中的下拉箭头
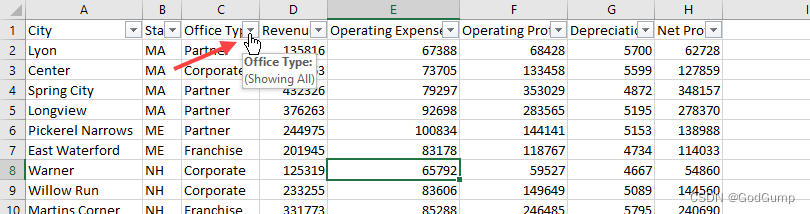
在公司选项旁的复选框中点击以取消选择,然后点击确定:
Excel工作簿打开,一个小窗口打开,取消选择了公司选项旁的复选框,点击了"确定"按钮
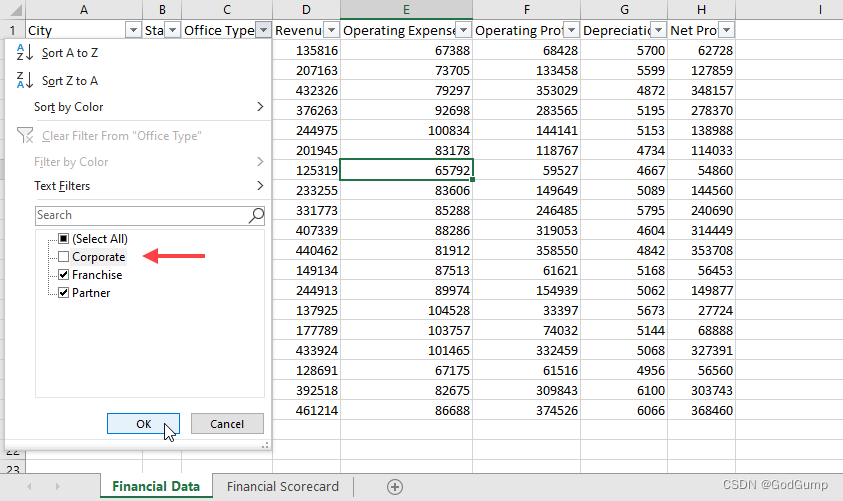
检查结果,并注意单元格C1中的自动筛选图标、蓝色的行号和表示隐藏单元格的双线:
Excel工作簿打开,应用了更改
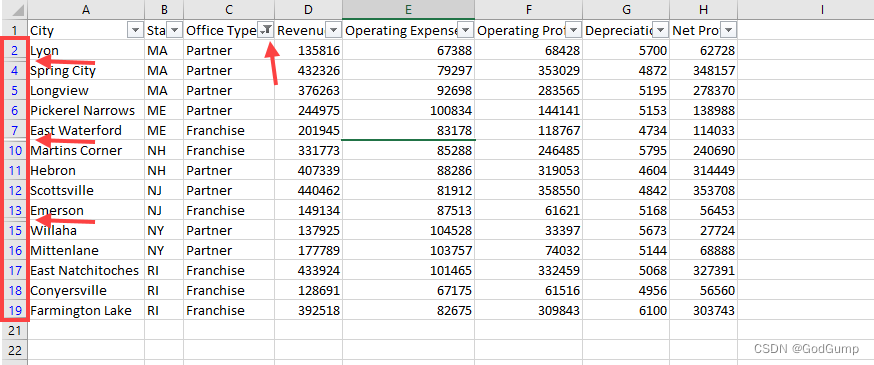
将您的工作簿保存为"Activity 2-5 Complete"。关闭Microsoft 365 Excel以完成这个练习。
Exercise: Analyzing data using text functions
Let’s get started!
Using some of the text functions that you have learned about in this session, you would like to automate portions of an invoice form to decrease the time needed for data entry.
- Click on the link below to open the Microsoft Excel exercise document you can use to complete this exercise.
Exercise: Analyzing Data Using Text Functions
- First you would like to find the first initial from the first name that is entered into column A. Click to select cell C2 and type “=LEFT(A2)” into the Formula Bar:
Excel workbook open, Cell C2 selected and typed “=LEFT(A2)” into the Formula Bar
- Press the Enter key on your keyboard and you will see that the previously selected cell now displays the initial from the first name (“J” in this case):
Excel workbook open, Enter key pressed ad the previously selected cell now displays the initial from the first name
- Next, you need to do the same thing and find the first initial from the last name that is entered into column B. Click to select cell D2 and type “=LEFT(B2)” into the Formula Bar:
Excel workbook open, Cell D2 selected and typed “=LEFT(B2)” into the Formula Bar
- Press the Enter key on your keyboard and you will see that the previously selected cell now displays the initial from the last name (“S” in this case):
Excel workbook open, Enter tab pressed, The previously Cell selected now displays the initial from the last name
- Now you need to use the TEXTJOIN function to fill in the Full Initials column. Click to select the E2 cell and then type “=TEXTJOIN(,TRUE,C2,D2)” into the Formula Bar:
Excel workbook open, Cell E2 selected and typed “=TEXTJOIN(,TRUE,C2,D2)” into the Formula Bar
- Press the Enter key and you will see that the values from cells C2 and D2 have been combined to show the full initials:
Excel workbook open, Enter tab pressed, the values from the Cells C2 and D2 have been combined to show the full initials
- Finally, you would like to automatically fill in the shipment method based on the number of characters that appear in the invoice number. If the invoice has more than five characters, then it is designated a rush order and if it is five characters or less, it is a standard order. Select H2:
Excel workbook open, Cell H2 selected
- Type “=IF(LEN(G2)>5, “RUSH”, “STANDARD”)” into the Formula Bar.
Excel workbook open, Typed "IF(LEN(G2)>5, “RUSH”, “STANDARD” into the Formula Bar
- Press the Enter key on your keyboard and you will see that this particular order is a rush order because its invoice number is more than five characters:
Excel workbook open, Enter key clicked, the “RUSH” word appears in the cell because the number contain more then 5 characters
- Use the Auto Fill feature to copy the formulas that you entered during this activity into the adjacent cells in row 3:
Excel workbook open, Auto Fill feature used to copy the formulas into the adjacent Cells in row 3
- Save the current workbook as Activity 2-1 Complete and then close Microsoft 365 Excel to complete this exercise.
练习:使用文本函数分析数据
让我们开始吧!
使用您在本课程中学到的一些文本函数,您希望自动化发票表单的部分内容,从而减少数据输入所需的时间。
点击下面的链接打开 Microsoft Excel 练习文档,您可以使用它来完成这个练习。
练习:使用文本函数分析数据
首先,您想要从输入到 A 列的第一个名字中找到第一个字母。点击选择单元格 C2,并在公式栏中键入 “=LEFT(A2)”:
Excel 工作簿已打开,选中单元格 C2 并在公式栏中键入 “=LEFT(A2)”
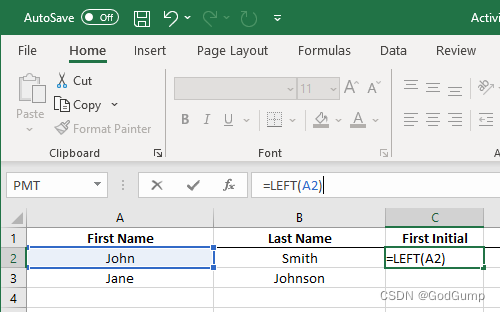
按下键盘上的 Enter 键,您会看到之前选择的单元格现在显示了第一个名字的首字母(在这个例子中为 “J”):
Excel 工作簿已打开,按下 Enter 键,之前选中的单元格现在显示了第一个名字的首字母
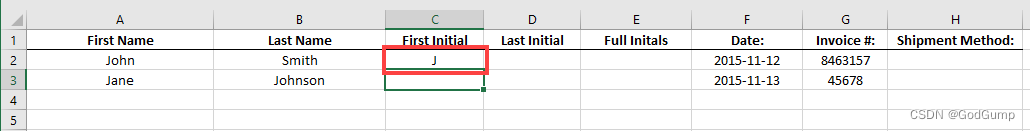
接下来,您需要做同样的事情,找到输入到 B 列的姓氏的第一个字母。点击选择单元格 D2,并在公式栏中键入 “=LEFT(B2)”:
Excel 工作簿已打开,选中单元格 D2 并在公式栏中键入 “=LEFT(B2)”
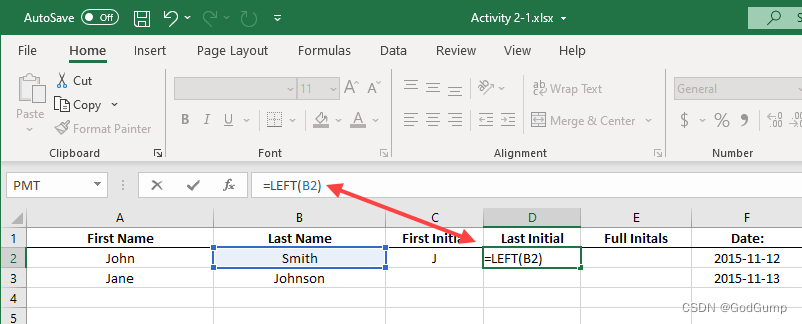
按下键盘上的 Enter 键,您会看到之前选择的单元格现在显示了姓氏的首字母(在这个例子中为 “S”):
Excel 工作簿已打开,按下 Enter 键,之前选中的单元格现在显示了姓氏的首字母
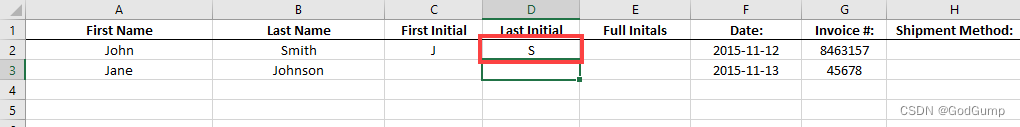
现在您需要使用 TEXTJOIN 函数来填写 Full Initials 列。点击选择单元格 E2,然后在公式栏中键入 “=TEXTJOIN(,TRUE,C2,D2)”:
Excel 工作簿已打开,选中单元格 E2 并在公式栏中键入 “=TEXTJOIN(,TRUE,C2,D2)”
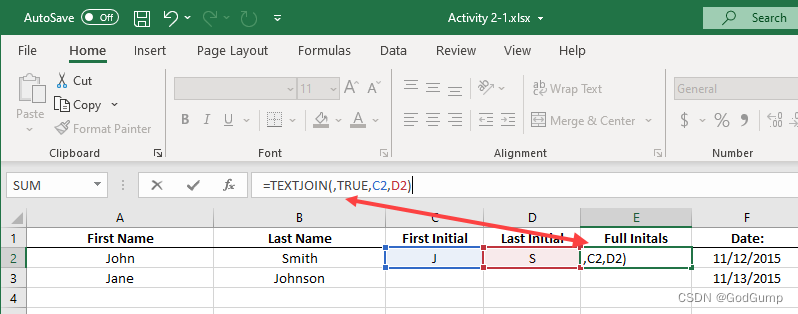
按下 Enter 键,您会看到来自单元格 C2 和 D2 的值已经组合在一起,显示了完整的首字母:
Excel 工作簿已打开,按下 Enter 键,来自单元格 C2 和 D2 的值已经组合在一起,显示了完整的首字母
最后,根据发票号码中出现的字符数自动填写运输方式。如果发票号码超过五个字符,则被指定为紧急订单,如果不超过五个字符,则为标准订单。选择 H2:
Excel 工作簿已打开,选择了单元格 H2
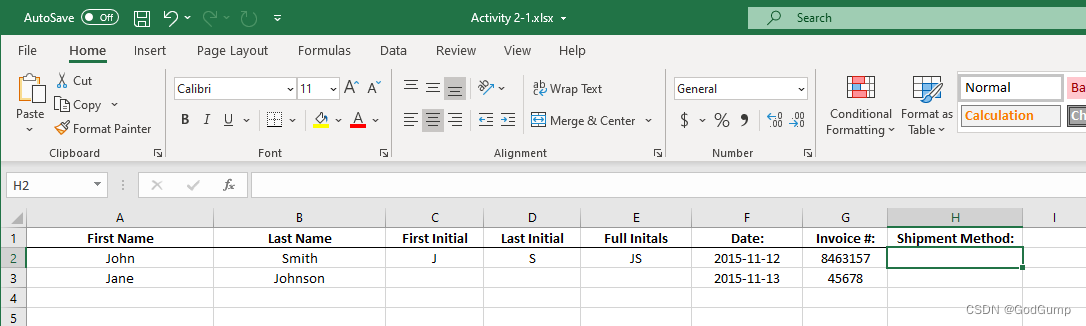
在公式栏中键入 “=IF(LEN(G2)>5, “RUSH”, “STANDARD”)”。
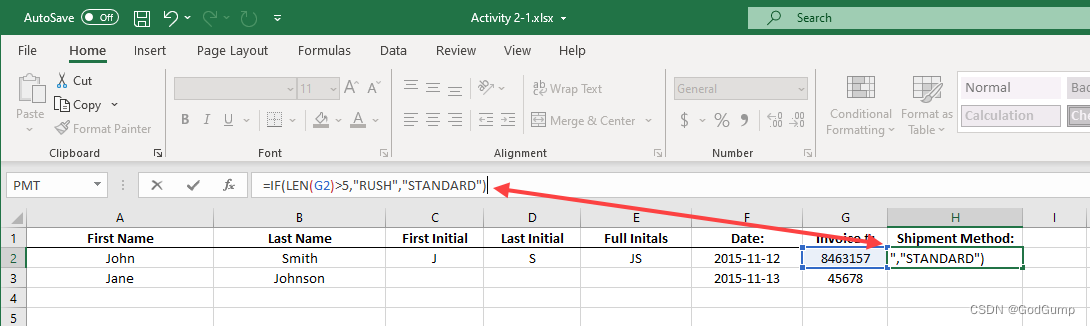
按下键盘上的回车键,您会看到这个特定订单是一个紧急订单,因为其发票号码超过五个字符:
Excel工作簿打开,按下回车键,单元格中显示“RUSH”字样,因为发票号码超过五个字符
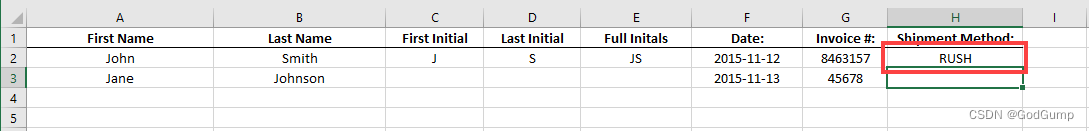
使用“自动填充”功能将您在此活动中输入的公式复制到第3行的相邻单元格中:
Excel工作簿打开,使用“自动填充”功能将公式复制到第3行的相邻单元格中
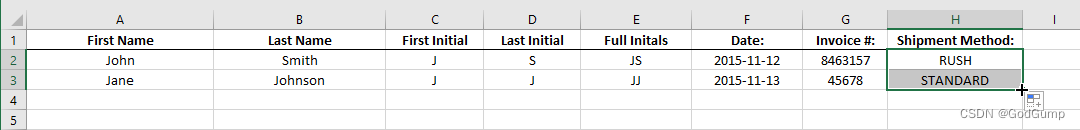
将当前工作簿保存为“Activity 2-1 Complete”,然后关闭Microsoft 365 Excel,以完成此练习。
Exercise: Analyzing data using logical functions
Let’s get started!
- Click on the link below to open the Microsoft Excel exercise document you can use to complete this exercise.
Exercise: Analyzing Data Using Logical Functions
- First you need to fill in the ID column. This data is the first name and last name separated by an underscore (). While you can do this manually, the TEXTJOIN function is built for exactly this type of work. Select cell C5, then, in the Formula Bar, type “=TEXTJOIN(“”,TRUE,A5,B5)”
Excel workbook open, Cell C5 selected, “typed TEXTJOIN(”_“,TRUE,A5<B5)” in the Formula Bar
- Press Enter, to enter the formula, then select cell C5 again, hover your cursor over the cell handle until your cursor icon turns into a small black cross:
Excel workbook open, Enter key clicked, Cell C5 selected, cursor was hovered over the cell, a small icon black cross appeared
- Double click on the cell handle to automatically copy your formula down the column, to cell C14:
Excel workbook open, Double click on the cell hande, automatically the formula was copied down to the column to cell C14
- Next, you need to determine which salespeople are going to receive a bonus. Bonuses are dispensed when the representative exceeds their weekly sales goal, and if their call reports are complete. For this purpose, you can use the AND function. Use your cursor to select cells G5 on the worksheet:
Excel workbook open, Cell G5 selected
- Inside the Formula Bar, type “=AND(D5=“Yes”,E5>F5)” and then press Enter:
Excel workbook open, Fomula “=AND(D5=“Yes”,E5>F5)” typed in Formula Bar, Enter Key clicked
- Because both logical tests are true, the formula returns the value of TRUE in cell G5. Now drag the AutoFill handle at the bottom right of the cell down to cell G14:
Excel workbook open, in the G5 Cell appeared the word “True”, The AutoFill handle dragged until down to Cell G14
- All sales representatives who have met both conditions now show a value of TRUE in this column. To add the bonus amount to column H, first select cells H5 through H14:
Excel workbook open, Cell H5 through H14 selected
- Inside the Formula Bar, type “=IF(G5:G14=TRUE,K2, 0)”. Because this is an array function, press Ctrl + Shift + Enter:
Excel workbook open, Formula “=IF(G5:G14=TRUE,K2,0)”, Ctrl plus Shift plus Enter commands clicked
- The bonus information has now been calculated for all employees in this worksheet:
Excel workbook open, the bonus information was calculated in the document
- Save the current workbook as Activity 2-2 Complete and then close Microsoft 365 Excel to complete this exercise.
练习:使用逻辑函数分析数据
让我们开始吧!
点击下面的链接打开 Microsoft Excel 练习文档,你可以使用它来完成这个练习。
练习:使用逻辑函数分析数据
首先需要填写ID列。这些数据是名字和姓氏之间用下划线()分隔的。虽然你可以手动完成,但TEXTJOIN函数正好用于这种类型的工作。选择单元格C5,然后在公式栏中输入“=TEXTJOIN(“”,TRUE,A5,B5)”。
Excel工作簿打开,选择了单元格C5,在公式栏中输入了“=TEXTJOIN(“_”,TRUE,A5,B5)”
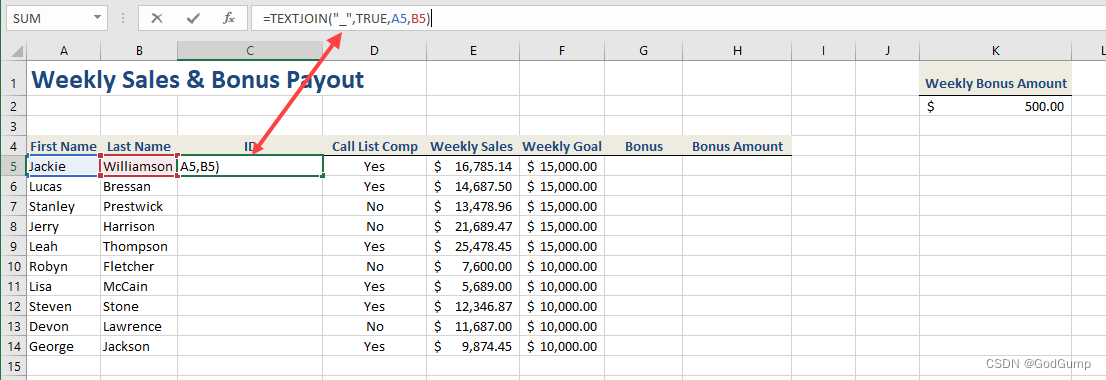
按下Enter键,输入公式,然后再次选择单元格C5,将光标悬停在单元格手柄上,直到光标图标变成小黑十字:
Excel工作簿打开,点击Enter键,选择了单元格C5,将光标悬停在单元格上,出现了小黑十字图标
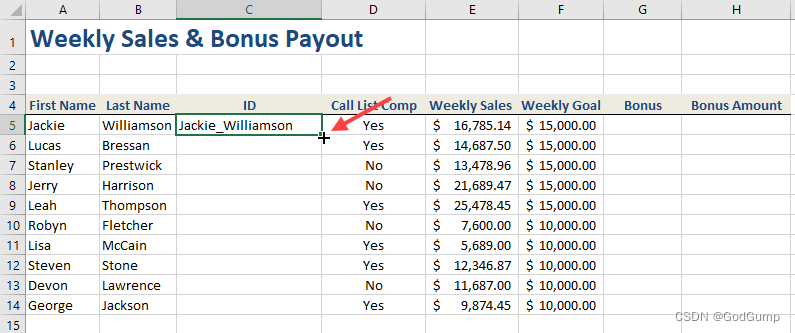
双击单元格手柄,自动将公式复制到整列,直到单元格C14:
Excel工作簿打开,双击单元格手柄,将公式自动复制到整列,直到单元格C14
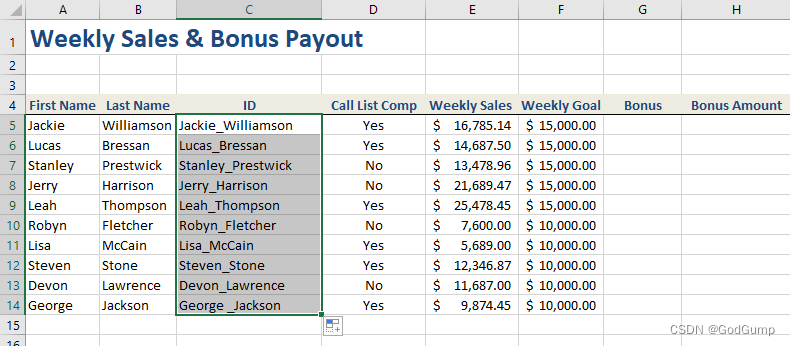
接下来,你需要确定哪些销售人员将获得奖金。当销售代表超过他们的每周销售目标,并且他们的通话报告完整时,奖金会发放。为此,你可以使用AND函数。使用光标选择工作表上的单元格G5:
Excel工作簿打开,选择了单元格G5
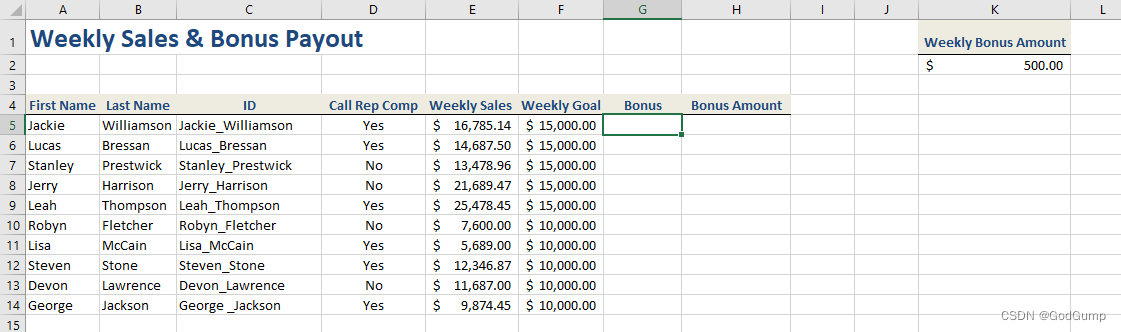
在公式栏中输入“=AND(D5=“Yes”,E5>F5)”,然后按Enter键:
Excel工作簿打开,在公式栏中输入了“=AND(D5=“Yes”,E5>F5)”,按下Enter键
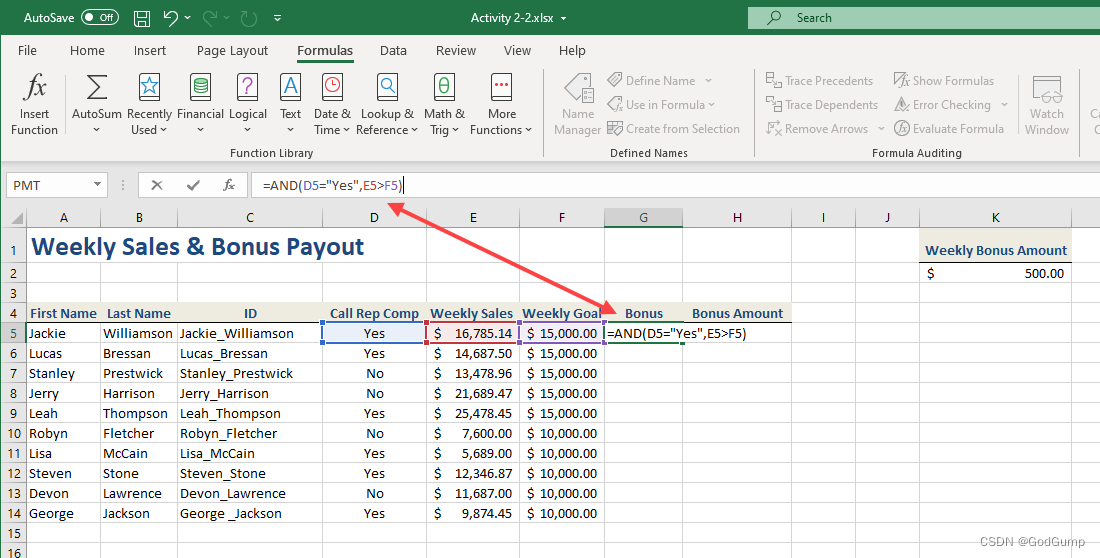
因为两个逻辑测试都为真,所以公式在单元格G5中返回了TRUE的值。现在将自动填充手柄拖到单元格G14:
Excel工作簿打开,在G5单元格中出现了“True”字样,将自动填充手柄拖到单元格G14
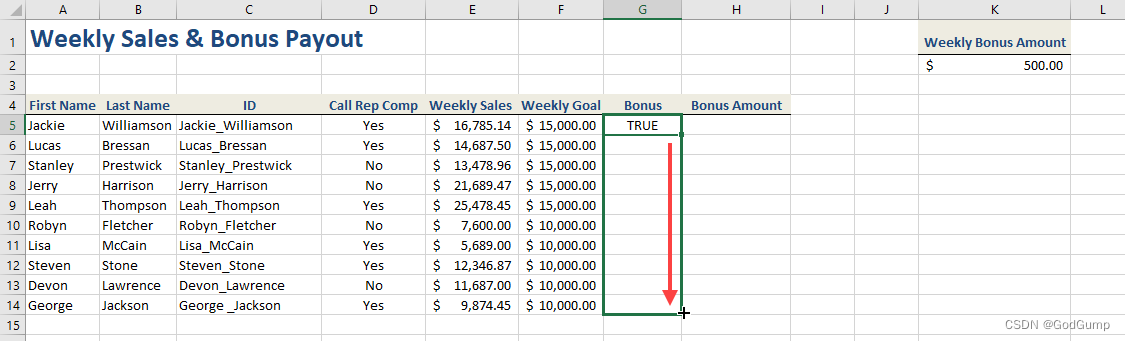
所有满足两个条件的销售代表现在在这一列中显示为TRUE的值。要在H列中添加奖金金额,首先选择单元格H5到H14:
Excel工作簿打开,选择了单元格H5到H14

在公式栏内输入“=IF(G5:G14=TRUE,K2,0)”。因为这是一个数组函数,按下Ctrl + Shift + Enter:
Excel工作簿打开,公式栏内输入“=IF(G5:G14=TRUE,K2,0)”,按下Ctrl + Shift + Enter键。
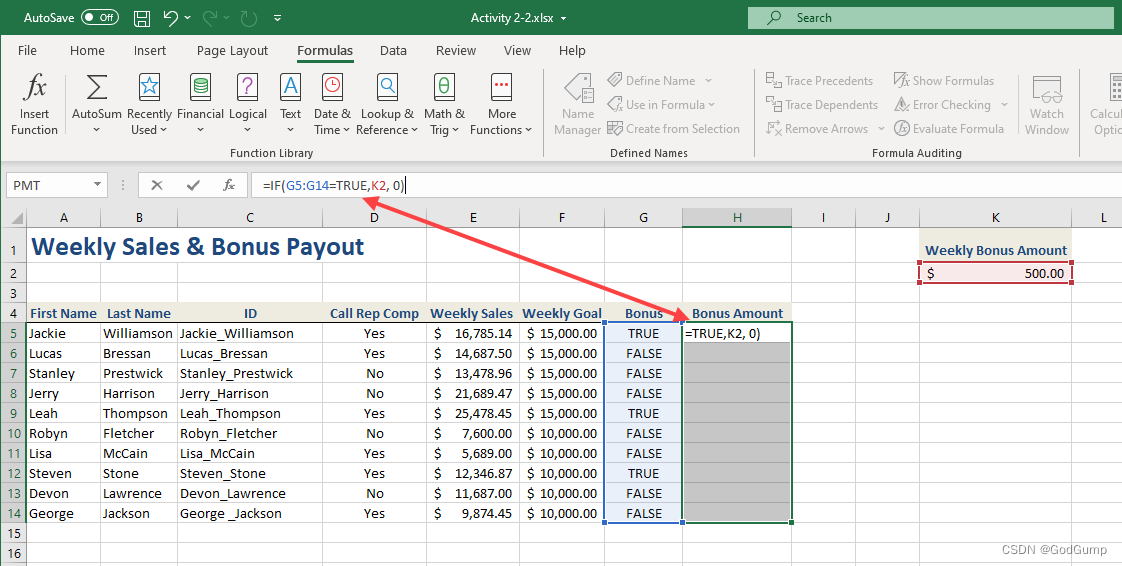
现在,工作表中的所有员工的奖金信息已被计算出来:
Excel工作簿打开,文档中计算出了奖金信息。
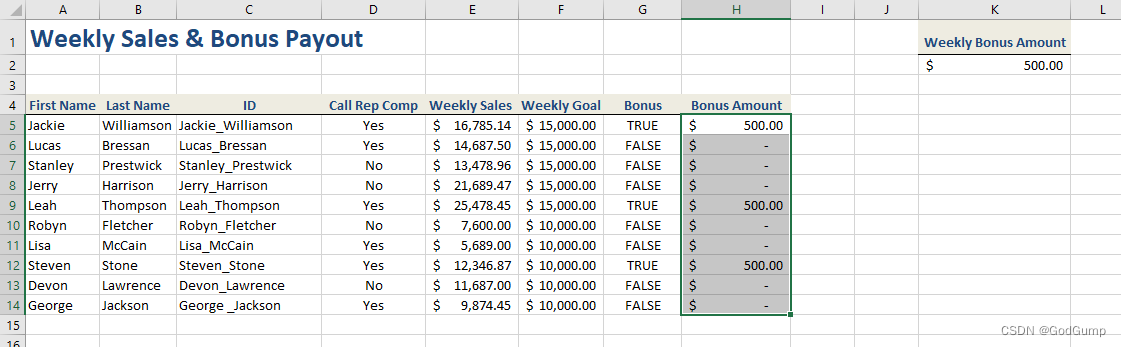
将当前工作簿保存为“Activity 2-2 Complete”,然后关闭Microsoft 365 Excel,完成这个练习。
Exercise: Creating and modifying a table
Let’s get started!
You have decided that because the Weekly Sales & Bonus Payout worksheet will become larger on a weekly basis, it is a good idea to convert the range into a table to facilitate data analysis. You would also like to apply a new table style to it.
- Click on the link below to open the Microsoft Excel exercise document you can use to complete this exercise.
Exercise: Creating and Modifying a Table
- First, use your cursor to select the A4:G14 cell range:
Excel workbook open, Cells A4 until G14 selected
- Next, click Insert → Table:
Excel workbook open, insert tab selected, Table option selected
- In the Create Table dialog box, you will see that the range you previously selected is listed inside the “Where is the data for your table?” text box:
Create table dialog window open, with the information that was previous selected inside the text box
- Ensure that the “My table has headers” checkbox is checked and click OK:
Create Table dialog window open, My table has headers checkbox was selected, “OK” button selected
- You will see that the previously selected range has now been converted into a table:
Excel workbook open, the changes were applied in the document
- Now, you need to apply a new table style. With any of the cells inside the table selected, open the Table Design contextual tab. Within the Table Styles group, click the More arrow:
Excel workbook open, Table Design selected, More Arrow was selected n the Table Styles group
- A variety of different quick styles to choose from is now displayed. For this example, click Table Style Medium 8:
Excel workbook open, different styles pane open, Table Style medium 8 selected
- The new style is now applied to the current table:
Excel workbook open, the style was applied in the document
- Save the current workbook as Activity 3-1 Complete and then close Microsoft 365 Excel to complete this exercise.
练习:创建和修改表格
让我们开始吧!
您决定因为每周销售和奖金支付工作表的数据范围将会逐周增大,所以将其转换为表格以便于数据分析。您还想为表格应用一个新的表格样式。
点击下面的链接打开Microsoft Excel练习文档,您可以使用它来完成这个练习。
练习:创建和修改表格
首先,使用光标选择A4:G14单元格范围:
打开Excel工作簿,选择从A4到G14的单元格范围
接下来,点击插入(Insert)→ 表格(Table):
打开Excel工作簿,选择插入(Insert)选项卡,点击表格(Table)选项
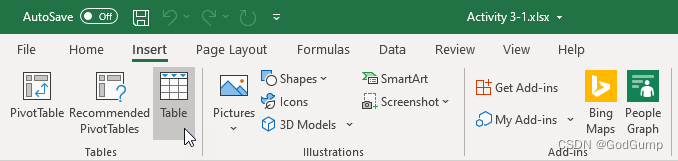
在创建表格(Create Table)对话框中,您会看到之前选择的范围已列在“您的表格数据在哪里?”文本框内:
打开创建表格对话框,之前选择的信息显示在文本框内
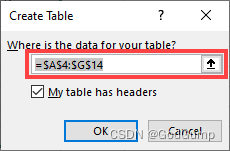
确保“我的表格具有标题”复选框被选中,然后点击确定(OK):
打开创建表格对话框,选中了“我的表格具有标题”复选框,点击“确定”按钮
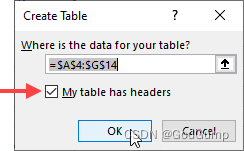
您会看到之前选择的范围现在已经被转换为一个表格:
打开Excel工作簿,文档中的范围已经变成了表格
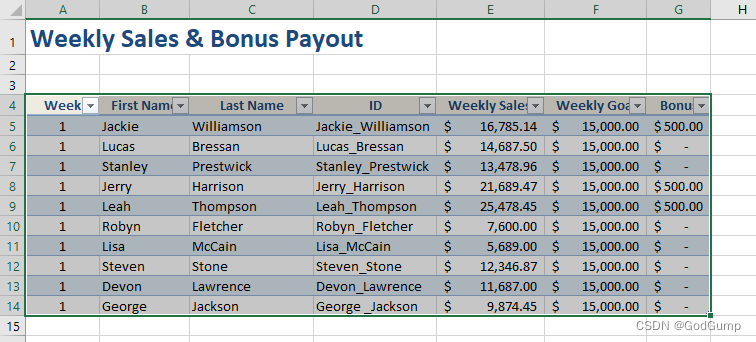
现在,您需要应用一个新的表格样式。选中表格内的任意单元格,打开表格设计(Table Design)上下文选项卡。在表格样式(Table Styles)组中,点击更多箭头:
打开Excel工作簿,选择表格设计(Table Design),在表格样式(Table Styles)组中点击更多箭头
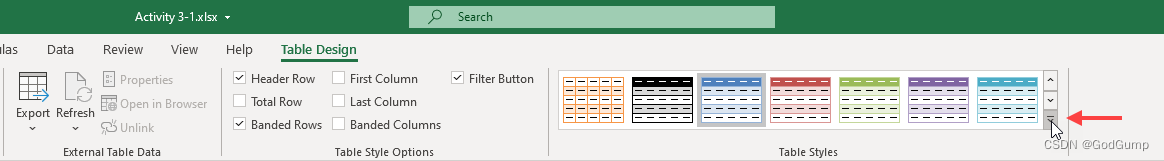
现在会显示出各种不同的快速样式可供选择。对于本示例,点击表格样式中的Medium 8(中号8):
打开Excel工作簿,不同样式的窗格打开,选择表格样式中的Medium 8(中号8)
新的样式现在应用到了当前表格:
打开Excel工作簿,文档中的表格应用了新的样式

将当前工作簿保存为“Activity 3-1 Complete”,然后关闭Microsoft 365 Excel以完成这个练习。
Exercise: Creating charts
Let’s get started!
You need to produce a chart that easily demonstrates to your supervisor which salesperson made the most sales in week 1.
- Click on the link below to open the Microsoft Excel exercise document you can use to complete this exercise.
Exercise: Creating charts
- First, you need to select the dataset with which you would like to work. Use your cursor to select cells C4:C14 and E4:E14. Remember to hold the Ctrl key down when selecting non-adjacent cell ranges:
Excel workbook open, Cells C4 until C14 and E4 until E14 was selected
- Next, click Insert → Insert Column or Bar Chart → Clustered Column:
Excel workbook open, Insert tab selected, Insert column or Bar Chart selected, a small pane open, clustered Column chosen
- The new chart now appears on the current worksheet, overlapping some of the data:
Excel workbook open, a new chart appears on the document
- Click and drag this chart to a location on the worksheet where it is not overlapping anything:
Excel workbook open, the chart was clicked and dragged to a location where was not overlapping anything
- Examine the new chart. You will quickly see that Thompson made the most sales in week 1, with Harrison as the next runner up. McCain clearly has some work to do:
Chart open, containing all the information from the Excel workbook
- Save the current workbook as Activity 4-1 Complete and then close Microsoft 365 Excel to complete this exercise.
练习:生成图表
让我们开始!
您需要生成一个图表,以便向您的主管清楚地展示哪位销售人员在第一周销售最多。
点击下面的链接打开Microsoft Excel练习文档,您可以使用该文档完成这个练习。
练习:创建图表
首先,您需要选择要使用的数据集。使用光标选择单元格C4:C14和E4:E14。记住在选择非相邻单元格范围时按住Ctrl键:
Excel工作簿已打开,选中了单元格C4到C14和E4到E14
接下来,点击插入 → 插入柱形图或条形图 → 簇状柱形图:
Excel工作簿已打开,选中插入选项卡,选择插入柱形图或条形图,打开一个小窗口,选择了簇状柱形图

新的图表现在出现在当前工作表上,与一些数据重叠:
Excel工作簿已打开,一个新的图表出现在文档上
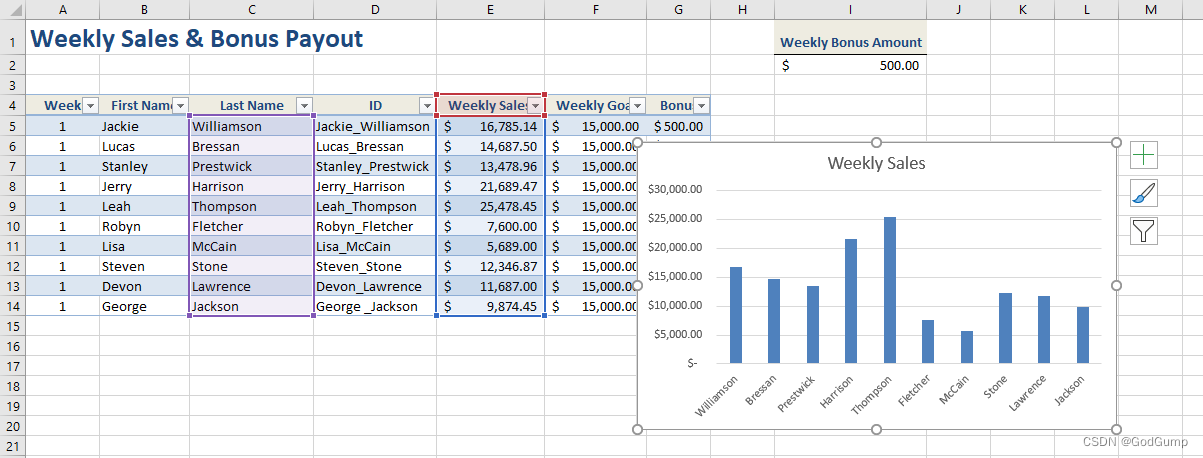
点击并拖动这个图表到工作表上没有重叠任何内容的位置:
Excel工作簿已打开,点击并拖动图表到没有重叠内容的位置
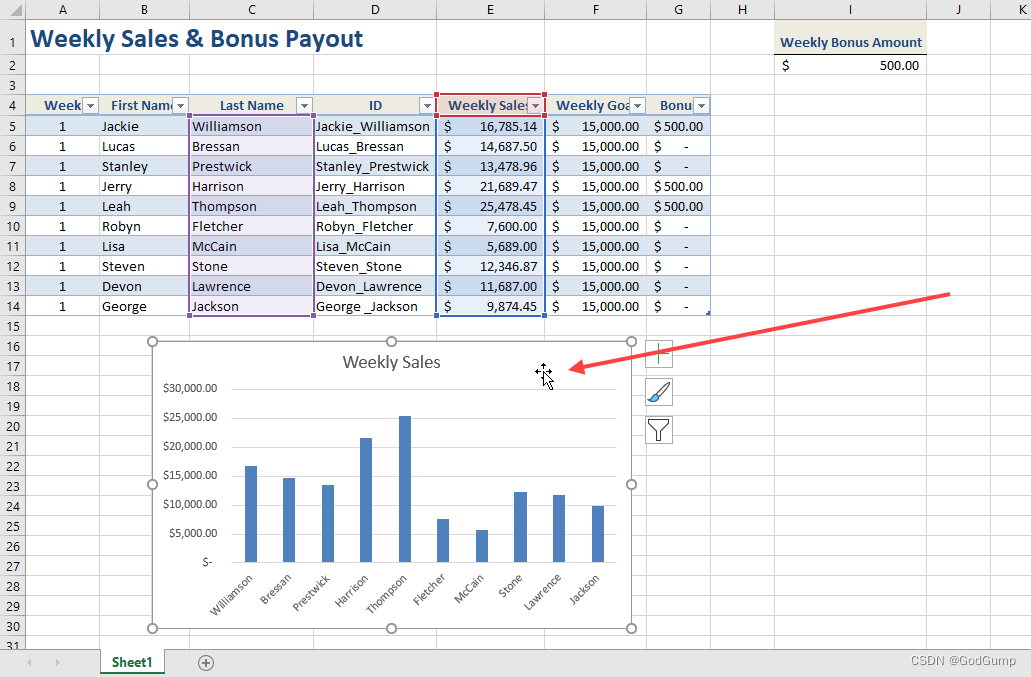
检查新的图表。您很快就会看到Thompson在第一周的销售最多,Harrison是次佳。McCain显然还有一些工作要做:
打开的图表,包含了Excel工作簿中的所有信息
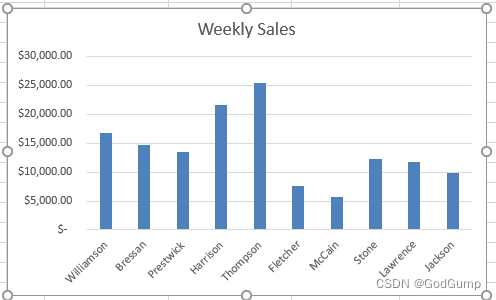
将当前工作簿另存为“Activity 4-1 Complete”,然后关闭Microsoft 365 Excel,完成这个练习。
Exercise: Modifying and formatting charts
Let’s get started!
You have created a chart that illustrates the weekly sales made by your sales staff. You would like to improve the look of the chart. Additionally, it looks as though George Jackson’s data has been accidentally left out of the chart.
- Click on the link below to open the Microsoft Excel exercise document you can use to complete this exercise.
Exercise: Modifying and formatting charts
- Click to select the chart on the current worksheet. You will see the Chart Design and Format contextual tabs appear on the ribbon:
Excel workbook open, the Chart was selected and the Chart Design and Format tabs appears on the ribbon
- First, you should add a title to this chart. Click Chart Design → Add Chart Element → Chart Title → Above Chart:
Excel workbook open, Add Char Element selected, small pane open, Chart Title selected, and Above Chart option was chosen
- The chart title is now displayed above the data series on the chart:
Chart title was displayed above the data series on the chart
- Next, you should add gridlines to make this chart a little easier to read. Click to select the chart and then click the Chart Elements button that appears near the top right-hand corner:
Chart was selected and the was clicked the Chart Elements button that appears near the top right-hand corner
- From the menu that appears, check the Gridlines check box:
The chart open and a small pane open, Gridlines option was selected
- Major gridlines are now displayed on the chart:
The Chart open, major gridlines was displayed on the chart
- Finally, you might as well remove the legend as it is fairly self-evident what this data represents. Click Chart Design → Legend → None:
Excel workbook open, Chart Design option selected, a small pane open, Legend was selected and the None was chosen
- Now you need to adjust the color of this chart. Click the Chart Design contextual tab. Within the Chart Styles gallery, click any of the chart styles presented:
Excel workbook open, Chart Design tab selected, a Chart Styles gallery open, a random Chart Style was selected
- The new style is now applied to the selected chart:
The changes was applied in the chart
- Finally, with the chart selected, click and drag the handle of the highlighted data selection, at the bottom right of cell E13, and drag it down one row:
Excel workbook open, the chart was selected, the bottom right of the cell E13 was selected and dragged down in one row
- A column representing the weekly sales of George Jackson will be added to the chart:
Chart open and a new Column representation the weekly sales of George Jackson was added
- Save your current workbook as Activity 4-2 Complete and close Microsoft 365 Excel to complete this exercise.
练习:修改和格式化图表
让我们开始吧!
您创建了一个图表,显示了销售人员每周的销售情况。您希望改进图表的外观。此外,乔治·杰克逊的数据似乎被意外地遗漏在图表中。
点击下面的链接打开Microsoft Excel练习文档,您可以使用该文档完成本练习。
练习:修改和格式化图表
点击选择当前工作表上的图表。您将看到图表设计和格式化上下文选项卡出现在功能区中:
Excel工作簿打开,图表被选中,图表设计和格式化选项卡出现在功能区中。
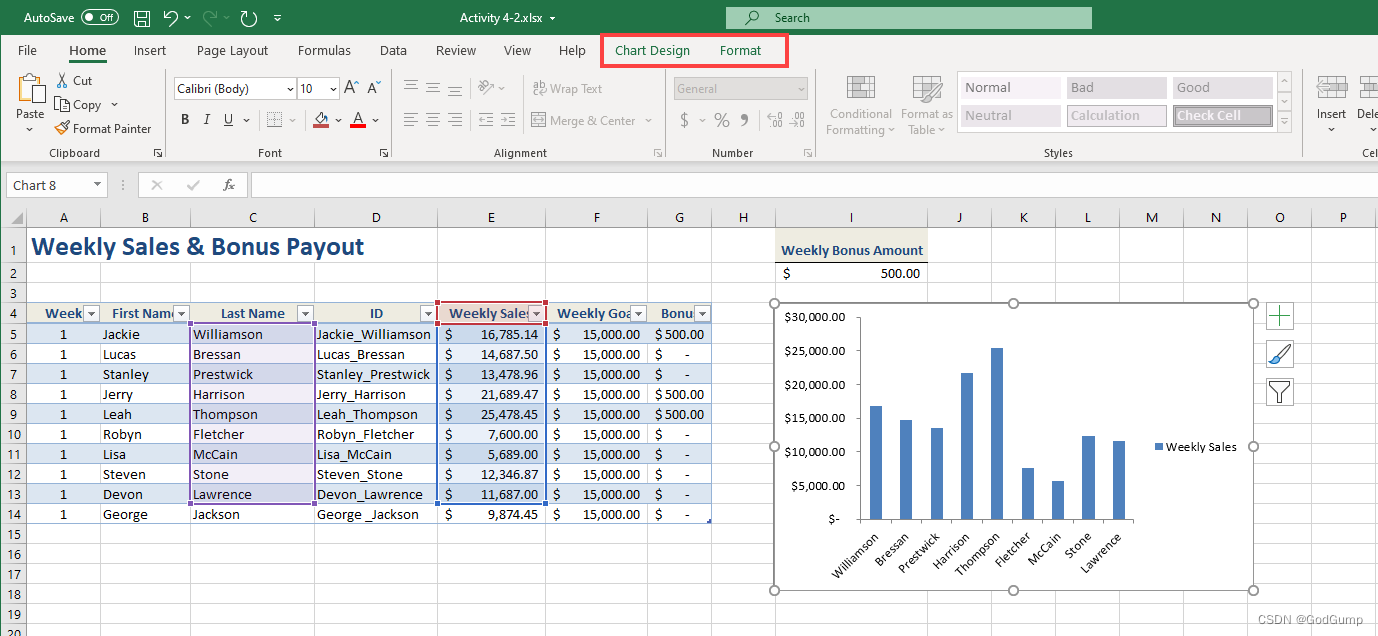
首先,您应该为这个图表添加一个标题。点击图表设计 -> 添加图表元素 -> 图表标题 -> 在图表之上:
Excel工作簿打开,选择了添加图表元素,打开了一个小窗格,选择了图表标题,并选择了在图表之上。
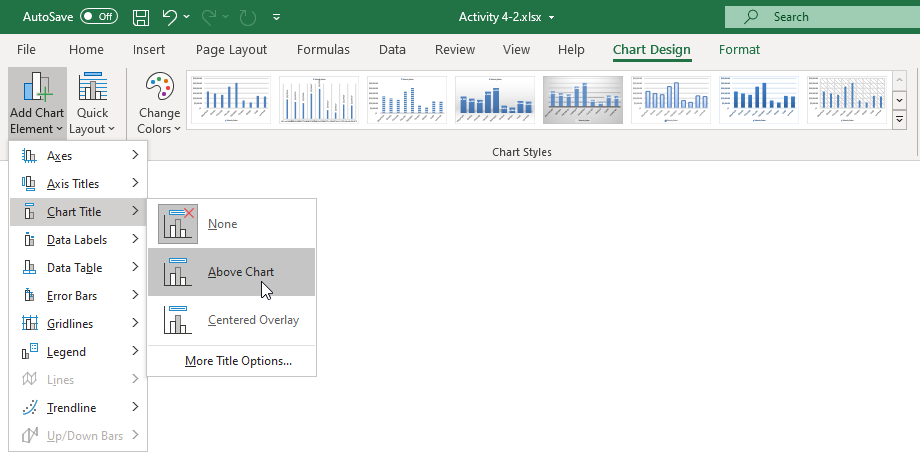
现在,图表标题显示在图表上的数据系列之上:
图表标题显示在图表上的数据系列之上。
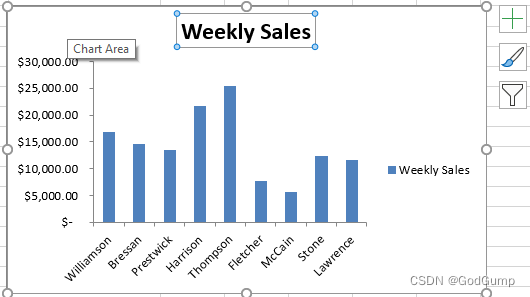
接下来,您应该添加网格线,以使这个图表更加易于阅读。点击选择图表,然后点击出现在右上角附近的图表元素按钮:
图表被选中,点击了出现在右上角附近的图表元素按钮。
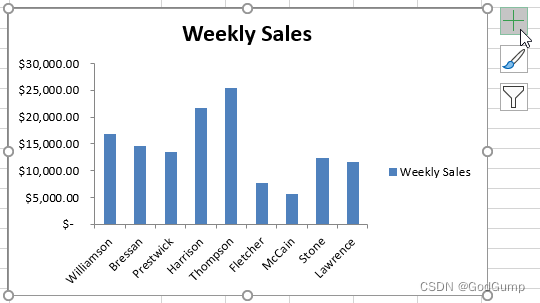
在出现的菜单中,勾选网格线复选框:
图表打开,一个小窗格打开,选择了网格线选项。
现在,主要网格线显示在图表上:
图表打开,主要网格线显示在图表上。
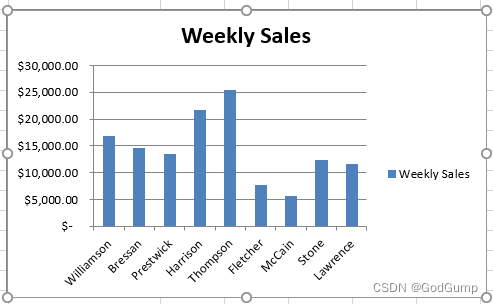
最后,您可以删除图例,因为这个数据代表的内容相当明显。点击图表设计 -> 图例 -> 无:
Excel工作簿打开,选择了图表设计选项,一个小窗格打开,选择了图例,并选择了无。
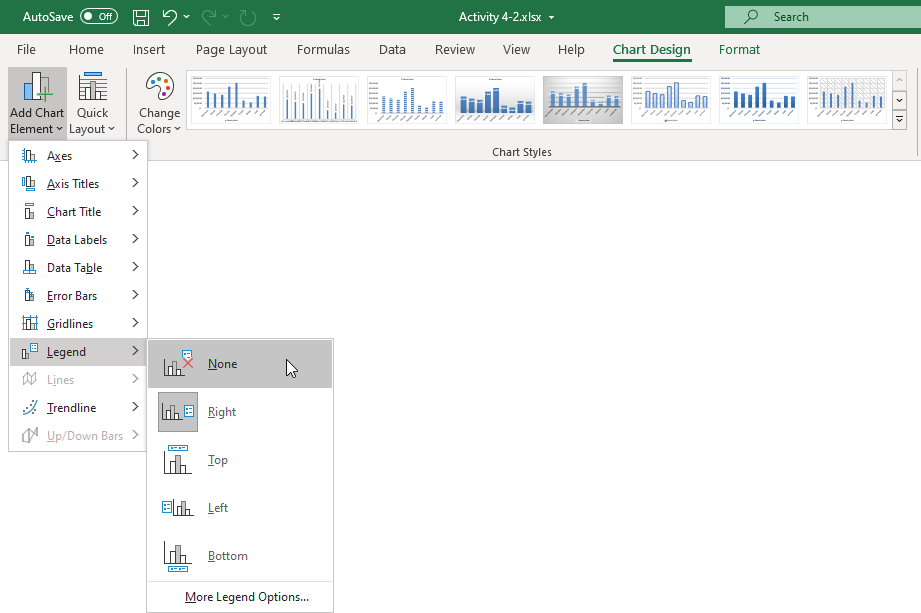
现在您需要调整图表的颜色。点击图表设计上下文选项卡。在图表样式库中,点击任何一个呈现的图表样式:
Excel工作簿打开,选择了图表设计选项卡,一个图表样式库打开,选择了一个随机的图表样式。
新的样式现在被应用到所选的图表上:
更改已应用到图表上。
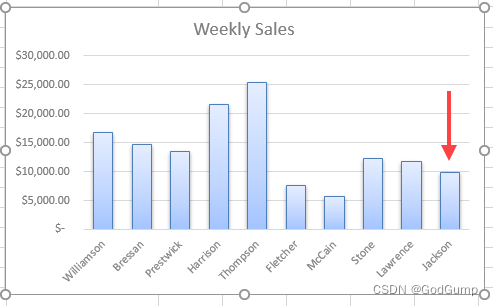
将当前工作簿保存为“Activity 4-2 Complete”,并关闭Microsoft 365 Excel,完成此练习。
Exercise: Apply conditional formatting
Let’s get started!
To help find outliers and trends within a weekly sales and bonus payout worksheet, you need to apply some conditional formatting.
- Click on the link below to open the Microsoft Excel exercise document you can use to complete this exercise.
Exercise: Apply Conditional Formatting
- To begin, open Exercise: Apply Conditional Formatting from your Exercise Files folder:
Excel workbook open, Activity 1-3
- You first want to use color scales to highlight the sales associates that made above average in sales and those that were below average. Use your cursor to select cells D5:D14:
Excel workbook open, Cells D5 until D14 selected
- Next, click Home → Conditional Formatting → Color Scales. From the Color Scales gallery, click the first option:
Excel workbook open, Conditional Formatting selected, small pane open Color scales was selected, First option clicked
- You will immediately see that those sales associates who have made more than average in sales will be highlighted in green, while those who made below are highlighted in red. Those that were close to the average are a yellow or orange shade:
Excel workbook open, colors applied in the document
- Next, you need to create a custom conditional formatting rule that will use an icon set to identify sales associates who met or exceeded their weekly goal, as well as those who met or exceeded the minimum sales goal requirement. Ensure that the D5:D14 range is selected:
Excel workbook open, Cells D5 until D14 selected
- Next, click Home → Conditional Formatting → New Rule:
Excel workbook open, home tab selected, Conditional Formatting selected, small pane open, New Rule selected
- The New Formatting Rule dialog box will now be displayed. Click to select the “Format all cells based on their values” rule type:
New Formatting Rule window open, “Format all cells based on their values” selected
- Within the Edit the Rule Description section, click the Format Style drop-down menu and then click the Icon Sets option:
New Formatting Rule window open, Format Style menu drop-down clicked, Icon Sets option selected
- The controls in the Edit the Rule Description section will change to incorporate controls that are relevant to icon sets. On the row that has the green icon, click the Type drop-down menu and then click the Number option:
New Formatting Rule window open, type drop-down menu clicked, Number option selected
- On the same row, inside the Value text box, type “15000” (the weekly goal):
New Formatting Rule window open, “1500” was typed inside the Value text box
(Note that you could also reference a cell that contains the value that you need.)
- On the row that has the yellow dot icon, click the Type drop-down menu and then click the Number option:
New Formatting Rule window open, Type drop-down menu clicked and the Number option was selected
- On the same row, type “10000” (the minimum weekly target) into the Value text box:
New Formatting Rule window open, “10000” value typed into the text box in the same row
- With the new custom conditional formatting rule configured, click OK:
New Formatting Rule window open, “OK” button selected
- The new rule will now be applied to the selected range of data. (You may need to resize the column so that there is room for the icon set.) In this case you will see sales associates who made or exceeded their goal, those who are slipping below the base goal, and those who have not met either goal type:
Excel workbook open, changes applied in the document
15. Save your work as Activity 1-3 Complete and then close Microsoft Excel 2016.
练习:应用条件格式化
让我们开始吧!
为了在每周销售和奖金支付工作表中找到异常值和趋势,您需要应用一些条件格式化。
点击下面的链接以打开可以用来完成这个练习的 Microsoft Excel 文档。
练习:应用条件格式化
首先,从您的练习文件夹中打开“练习:应用条件格式化”的 Excel 工作簿:
Excel 工作簿已打开,活动 1-3
您首先要使用颜色比例尺来突出显示销售业务员中超过平均销售额和低于平均销售额的人员。使用鼠标光标选择单元格 D5:D14:
Excel 工作簿已打开,单元格 D5 到 D14 已选择
接下来,点击首页 → 条件格式 → 颜色比例尺。从颜色比例尺图库中,点击第一个选项:
Excel 工作簿已打开,选择了条件格式,小窗口中选择了颜色比例尺,点击了第一个选项
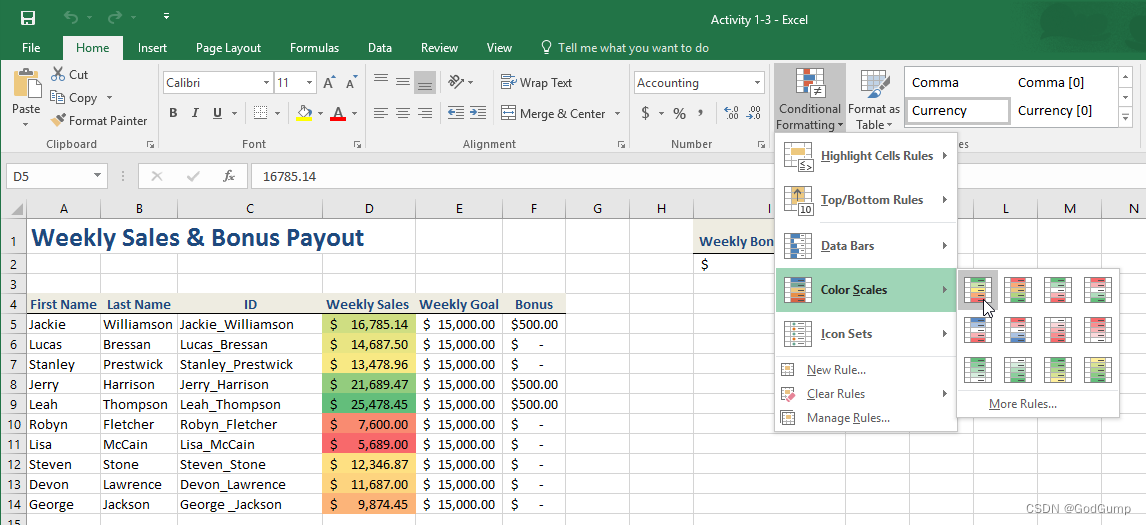
您会立即看到那些在销售额上超过平均值的销售业务员将被突出显示为绿色,而那些低于平均值的人将被突出显示为红色。接近平均值的人将会是黄色或橙色:
Excel 工作簿已打开,文档中应用了颜色
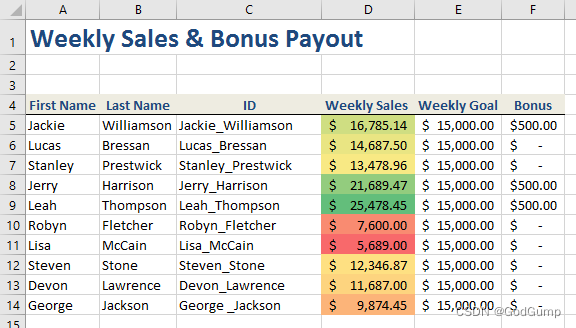
接下来,您需要创建一个自定义的条件格式化规则,以使用图标集来标识达到或超过每周目标的销售业务员,以及达到或超过最低销售目标要求的人员。确保选择了 D5:D14 范围的单元格:
Excel 工作簿已打开,单元格 D5 到 D14 已选择
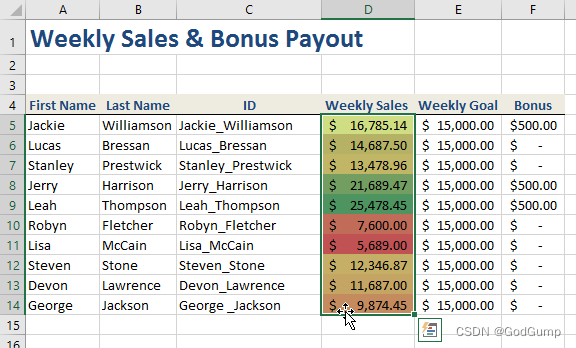
接下来,点击首页 → 条件格式 → 新建规则:
Excel 工作簿已打开,选择了首页标签,点击了条件格式,小窗口中选择了新建规则
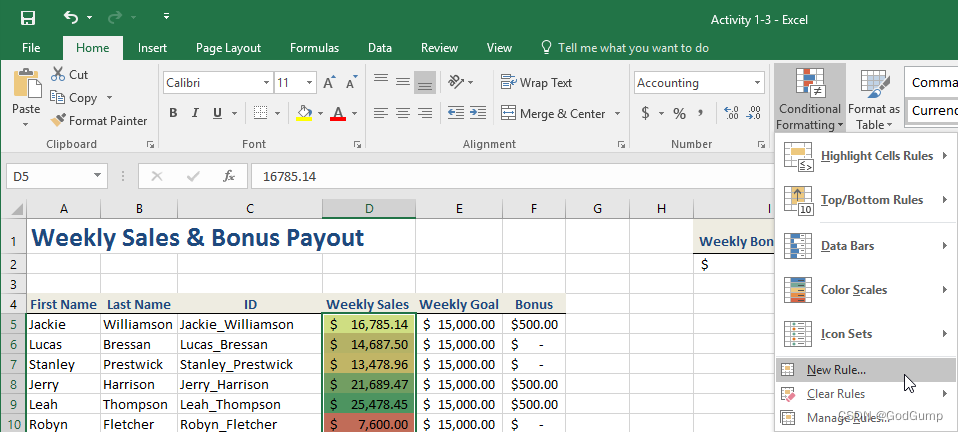
新建格式化规则对话框现在会显示出来。点击选择“根据单元格的值设置格式”的规则类型:
新建格式化规则窗口已打开,选择了“根据单元格的值设置格式”
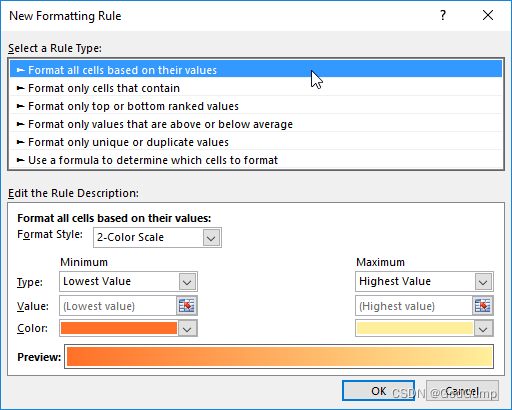
在“编辑规则说明”部分,点击格式样式下拉菜单,然后点击图标集选项:
新建格式化规则窗口已打开,点击格式样式下拉菜单,选择了图标集选项
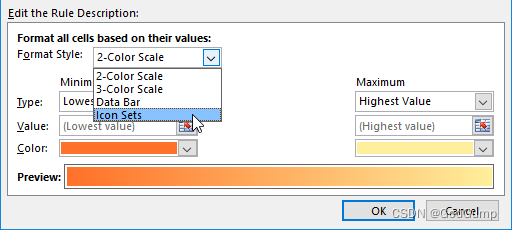
在同一行内,点击数值文本框,并输入 “15000”(即每周目标销售额):
Excel工作簿打开,新格式化规则窗口中,数值文本框输入 “15000”
(注意,你也可以引用包含所需数值的单元格。)
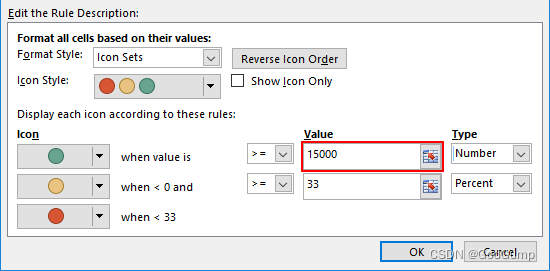
在带有黄色圆点图标的行,点击类型下拉菜单,并选择 “数字” 选项:
Excel工作簿打开,新格式化规则窗口中,点击类型下拉菜单,并选择 “数字” 选项
在同一行内,输入 “10000”(即每周最低销售目标)到数值文本框:
Excel工作簿打开,新格式化规则窗口中,数值文本框输入 “10000”
配置完成新的自定义条件格式规则后,点击 “确定”:
Excel工作簿打开,新格式化规则窗口中,点击 “确定” 按钮
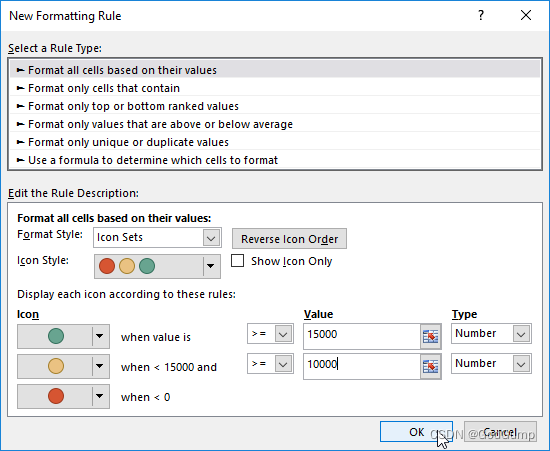
新的规则现在将应用于选定的数据范围。(你可能需要调整列宽以便为图标集留出空间。)在这种情况下,你将看到达到或超过目标销售额的销售人员、低于基本目标的销售人员以及未达到任何目标的销售人员:
Excel工作簿打开,文档中应用了更改
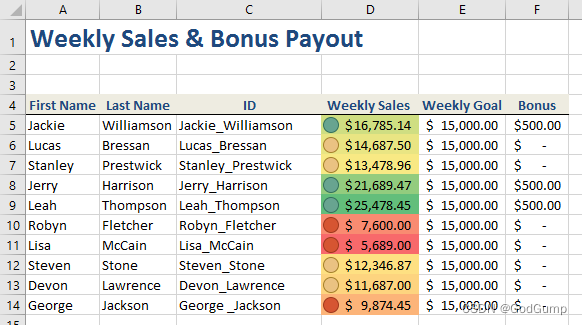
将你的工作保存为 “Activity 1-3 Complete”,然后关闭Microsoft Excel 2016。
Exercise: Using data sources
Let’s get started!
You have been asked to create a price list, in Canadian dollars, for some of your company’s products. You will need to update it regularly using the current exchange rate. You first need to import your price list, then create a web query to load and maintain the current exchange rate.
Note: The will need the following activities to complete this exercise:
Exercise: Using Data Sources
Exercise: Using Data Sources_text
- Click on the link below to open the Microsoft Excel exercise document you can use to complete this exercise.
Exercise: Using Data Sources
- Click Data → From Text/CSV:
Workbook Excel open, Data tab selected, From Textt/CSV selected
- The Import Data dialog box will open. Navigate to your activity files and select Exercise: Using Data Sources_text, then click the Import button:
Import Data window open, Activity 6-2.txt file selected, Import button selected
- The Get & Transform Data dialog box will open, displaying the data in the source file. If the selection in the Delimiter drop-down list reads --Custom–, and there is an extra header, click to select the Tab option in the Delimiter drop-down list:
Get & Transform Data dialog box open, Delimiter drop-down selected, Tab option selected from the list
- With your data properly aligned in the list box, click the Load button:
Get & Transform Data dialog box open, Load button selected
- A new worksheet is created and the data from your text file is loaded as a table. The Queries & Connections task pane opens on the right of the screen:
New worksheet created, data from the text file was loaded as a table, The Queries & Connections pane opened on the right.
- Click on the Sheet1 tab to make it the active worksheet. Click to select cell A1, then press Ctrl + C to copy the URL of the exchange rate site:
Excel workbook open, Data tab selected, From Web option selected
- Now click Data → From Web:
Excel workbook open, Data tab selected, From Web option selected
- The From Web dialog box will open. Click to select the URL field, then press Ctrl + V, to paste the URL. Click OK:
From Web window open, The URL field selected, and copied, “OK” button selected
- The Navigator dialog box will open. Click to select Table 0 in the list box on the left, confirm the data is present in the Table View window on the right, then click the Load button:
Navigator dialog box open, Table 0 selected from the list, and appears in the Table View on the right, Load button selected
- A new worksheet is created and the data from the website is loaded as a table. The query appears under the Exercise: Using Data Sources
Worksheet was created and the data from the website was loaded a a table
- Hover your cursor over the web query in the Queries & Connections task pane, then click Edit in the table dialog box that appears:
The cursor hovered the web query in the Queries & Connections pane, a table dialog box appears Edit option selected
- The Power Query Editor will launch. Click the filter button to the right of the header of the Country-Currency column, then click to select the Text Filters field and begin typing “Canada”. When Canada-Dollar is the only selected item, click OK:
The Power Query Editor launched, Filter button selected, Text Filters field selected, Canada typed, Canada-Dollar selected
- Click the Close and Load command in the Close group of the Home tab:
Excel workbook open, Home table selected, Close and Load selected
- You will see that the Web Query table now only displays the Canada-Dollar row of data from the data set:
Excel workbook open, Web Query table displayed Canada-Dollar row from the data set
- Click the Sheet2 tab to make it the active sheet, then click to select cell C2. Type the formula “=[@[US Dollars]]*VLOOKUP(“Canada-Dollar”,Sheet3!A:B,2,FALSE)”, then press the Enter key:
Excel workbook open, Sheet 2 tab selected, C2 selected and typed the formula, “Enter” button selected
- The table containing the price list will auto complete the formula for every row in the column:
Excel workbook open, table containing the price list that completed the formula for every row in the column
- To refresh the data from the website, right-click on the query in the Queries and Connections task pane, then select Refresh:
Queries and Connections pane open, right click, pane opens and Refresh option selected
- You can now save your changes as Activity 6-2 Complete and close Microsoft Excel 365 to complete the activity.
练习使用数据源
让我们开始吧!
您被要求创建一个加拿大元的价格表,以显示公司部分产品的价格,并需要根据当前汇率定期更新。首先,您需要导入您的价格表,然后创建一个网页查询以加载和维护当前的汇率。
注意:完成这个练习需要以下步骤:
点击下面的链接打开 Microsoft Excel 练习文档,用于完成这个练习。
练习:使用数据源
点击数据(Data)→ 从文本/CSV(From Text/CSV):
Excel 工作簿打开,选择数据选项卡,选择从文本/CSV选项
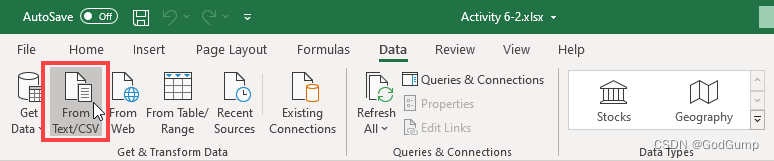
导入数据对话框会打开。导航到您的活动文件夹,选择“练习:使用数据源_文本”文件,然后点击“导入”按钮:
打开导入数据窗口,选择活动6-2.txt文件,点击导入按钮
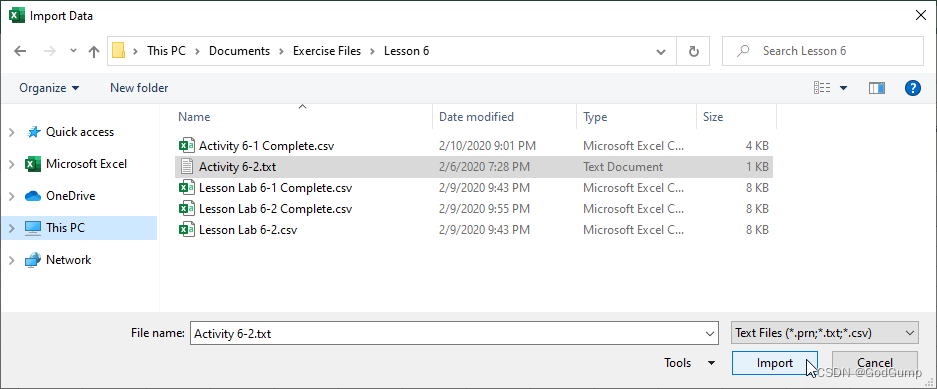
获取和转换数据对话框会打开,显示源文件中的数据。如果分隔符下拉列表中的选择是“–自定义–”,并且有额外的标题,点击下拉列表中选择“Tab”选项:
打开获取和转换数据对话框,选择分隔符下拉列表,选择列表中的“Tab”选项
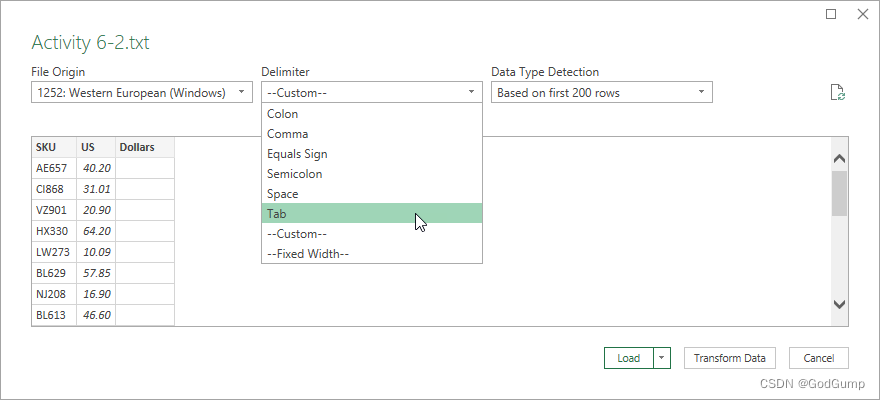
确保您的数据在列表框中正确对齐后,点击“加载”按钮:
打开获取和转换数据对话框,点击加载按钮
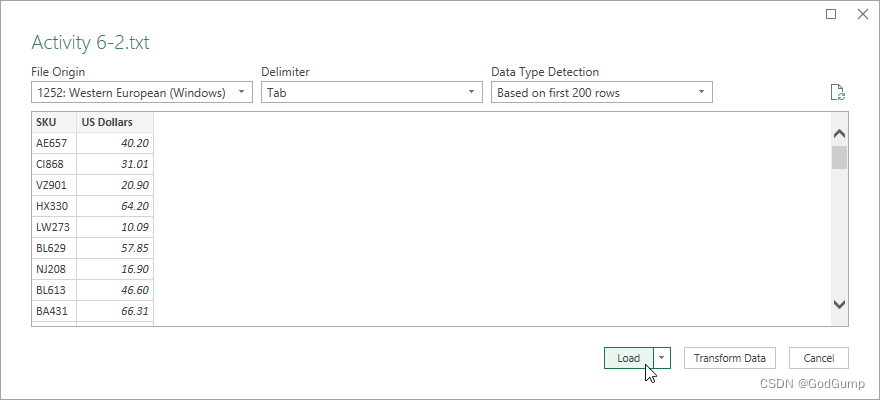
会创建一个新的工作表,并将文本文件中的数据加载为表格。右侧会打开“查询和连接”任务窗格:
创建新的工作表,将文本文件中的数据加载为表格,右侧打开“查询和连接”窗格。
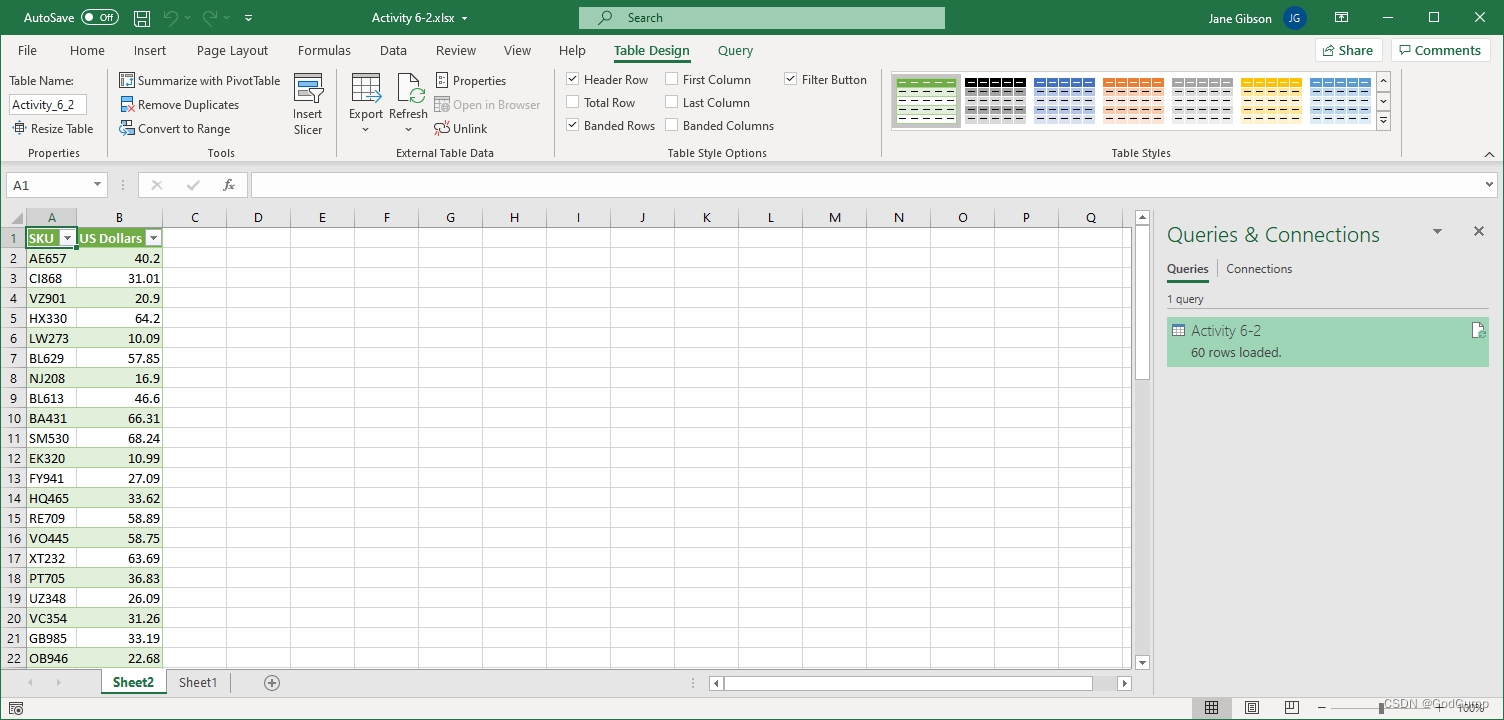
点击“Sheet1”选项卡,使其成为活动工作表。点击选择单元格A1,然后按Ctrl + C复制汇率网站的URL:
Excel 工作簿打开,选择数据选项卡,选择从Web选项
现在点击数据(Data)→ 从Web:
Excel 工作簿打开,选择数据选项卡,选择从Web选项
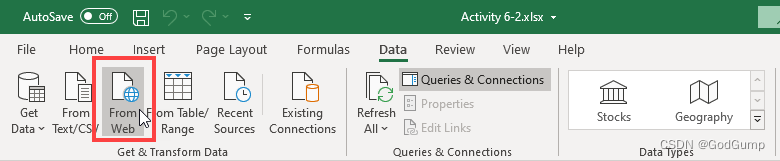
“从Web”对话框会打开。点击选择URL字段,然后按Ctrl + V,将URL粘贴到字段中。点击“确定”:
打开“从Web”窗口,选择URL字段,粘贴复制的URL,点击确定
“导航器”对话框会打开。点击左侧列表框中的Table 0选项,确认数据在右侧的表格视图窗口中显示,然后点击“加载”按钮:
打开导航器对话框,选择列表中的Table 0选项,数据在右侧的表格视图窗口中显示,点击加载按钮
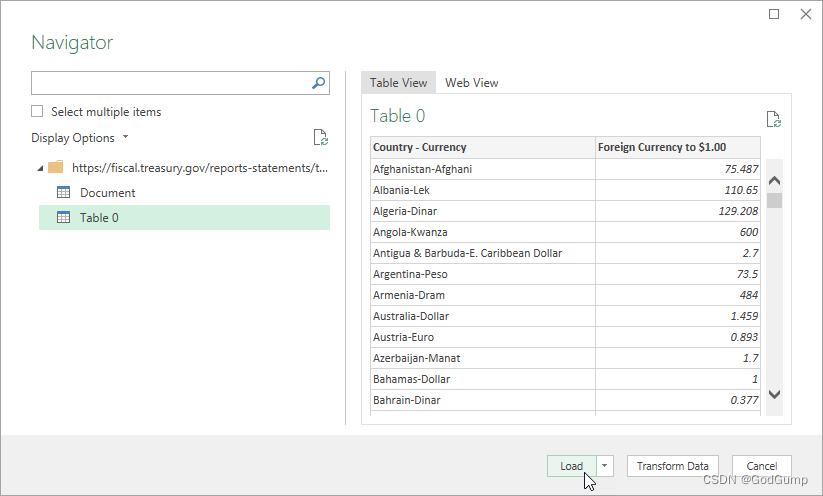
新建一个工作表,并将从网站加载的数据加载为表格。
将光标悬停在“查询和连接”任务窗格中的网页查询上,然后点击出现的表格对话框中的“编辑”选项。
Power Query 编辑器将启动。点击“Country-Currency”列标题右侧的筛选按钮,然后点击选择“文本筛选”字段并开始输入“Canada”。当只有“Canada-Dollar”被选中时,点击“确定”。
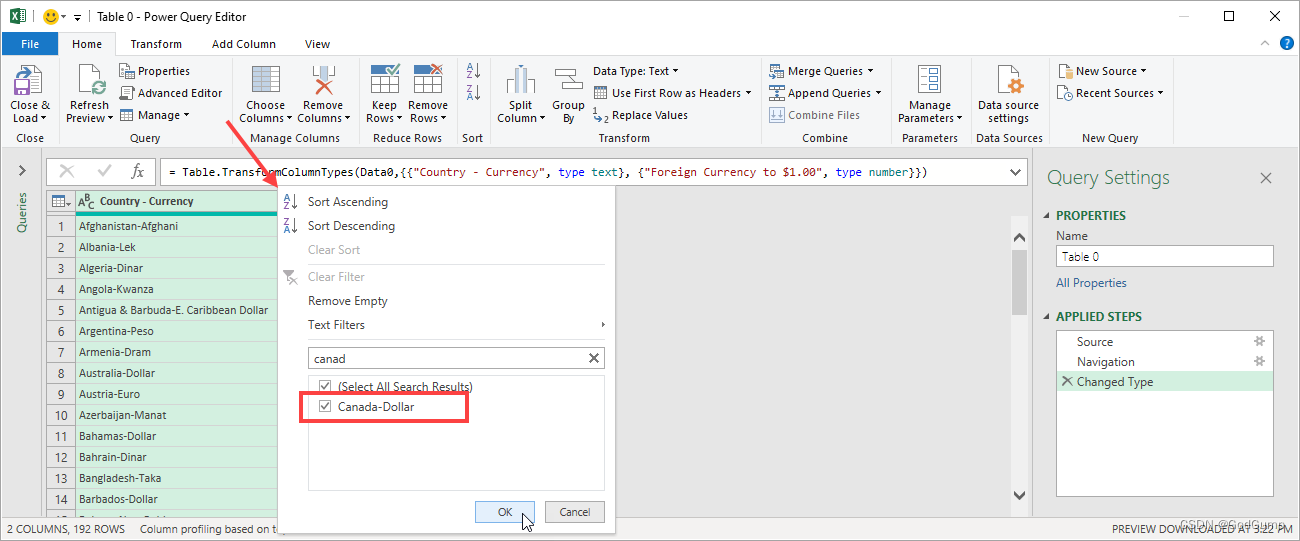
在“主页”选项卡的“关闭”组中,点击“关闭并加载”命令。
现在你会看到 Web 查询表格中只显示了数据集中的“Canada-Dollar”行数据。
点击“Sheet2”选项卡使其成为活动工作表,然后点击选择单元格 C2。输入公式“=[@[US Dollars]]*VLOOKUP(“Canada-Dollar”,Sheet3!A:B,2,FALSE)”,然后按回车键。
包含价格列表的表格将自动为列中的每一行完成公式。
要刷新网站上的数据,右键点击“查询和连接”任务窗格中的查询,然后选择“刷新”。
现在可以保存更改为“Activity 6-2 Complete”,并关闭 Microsoft Excel 365,完成该活动。
PPT
Exercise: Building a presentation
Let’s get started!
In this exercise, you will begin building the framework for your annual report presentation.
- Click on the link below to open the Microsoft PowerPoint exercise document you can use to complete this exercise.
Exercise: Building a presentation
Exercise: Building a presentation_Outlines
Exercise: Building a presentation_slides
- First, you need to add slides from a Microsoft Word outline. Click Home → New Slide drop-down arrow → Slides from Outline:
PowerPoint window open, Home tab selected, New Slide drop-down arrow selected, Slides from Outline selected
- Browse to your Exercise Files folder. Locate and select the Activity 2-2 Outline file. Click Insert:
Insert Outline window open, Activity 2-2 Outline file selected, Insert button selected
- The slides will be inserted. However, we have inserted an extra slide that we do not need; the marketing report will be presented separately. Right-click this slide (Slide 6) in the Slides pane and click Delete Slide:
PowerPoint window open, Slides were inserted, right-clicked in Slide-6 the small dialog box open, Delete slide selected
- Now, select the Detailed Sales Summary slide (Slide 5). Press Ctrl + D three times to create three copies of it:
PowerPoint window open, Detailed Sale Summary slide (Slide 5) selected for create the slide three times
- Replace Q1 in the first sales summary slide with “Quarter 1”
PowerPoint window open, in the slide text box selected in the slide, Q1 was replaced to “Quarter 1”
- Repeat this step for the next three slides to create slides for Quarters 2, 3, and 4:
PowerPoint window open, Quarters 2, 3 and 4 created
- Finally, we need to add boilerplate information to the end of the presentation. Click to select the last slide (Slide 9). Then, click Home → Reuse Slides:
PowerPoint window open, slide 9 selected, Home tab selected, Reuse Slides option selected
- In the Reuse Slides pane, Click Browse to locate your Exercise Files folder:
Reuse Slides pane open, Browse option selected
- Select the Activity 2-2 Slides file. Click Choose Slides:
Choose Slide window open, Activity 2-2 slides file selected, Choose Slides button selected
- Click Insert Slide on the first slide in the Reuse Slides pane:
Reuse slides pane open, Insert slide option selected
(If you want to keep the original formatting, check the Use Source formatting box.)
- The slides will be inserted using the presentation’s theme:
PowerPoint window open, the slides were inserted using the presentation’s theme
Repeat this step for the second slide.
- Close the Reuse Slides pane:
Reuse slides pane open, X option selected to close the pane
- To ensure that the formatting is correct, ensure that any slide in the Slides pane is selected. Then, click Home → Select → Select All:
A random slide was selected, Home tab selected, select clicked, and Select All option chosen
- With all slides now selected, click the Reset command on the Home tab:
PowerPoint window open, all slides were selected, Home tab selected, Reset option selected
- Review the formatting changes:
PowerPoint window open, the changes were applied in the document
- Save your presentation as Activity 2-2 Complete. Close Microsoft 365 PowerPoint to complete this activity.
练习:构建演示文稿
让我们开始吧!
在这个练习中,您将开始构建年度报告演示文稿的框架。
点击下面的链接,打开Microsoft PowerPoint练习文档,您可以使用它来完成这个练习。
练习:构建演示文稿
首先,您需要从Microsoft Word的大纲中添加幻灯片。点击首页 → 新建幻灯片下拉箭头 → 从大纲添加幻灯片:
PowerPoint窗口打开,首页选中,新建幻灯片下拉箭头选中,从大纲添加幻灯片被选中
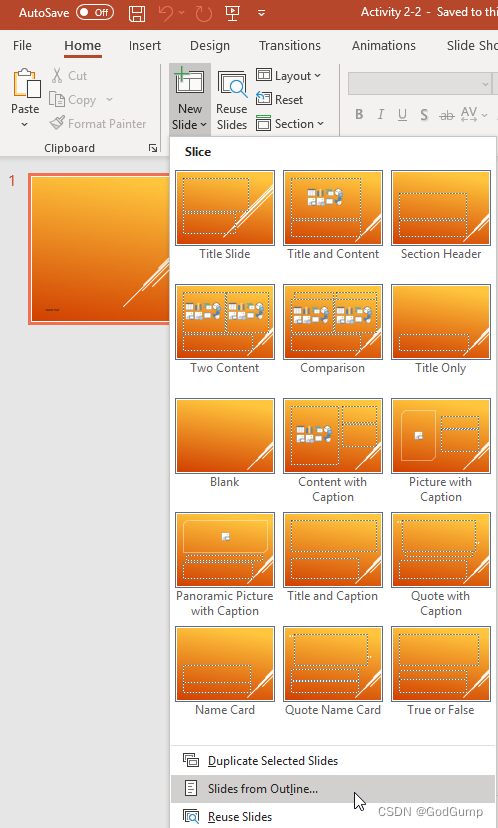
浏览到您的练习文件夹。找到并选择Activity 2-2 Outline文件。点击插入:
插入大纲窗口打开,选择了Activity 2-2 Outline文件,点击插入按钮
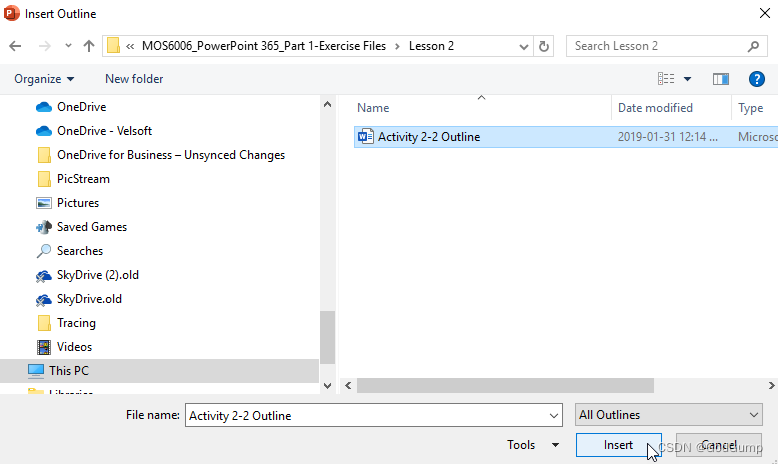
幻灯片将被插入。然而,我们插入了一个多余的幻灯片,我们不需要它;市场报告将会单独呈现。在幻灯片窗格中右键点击这个幻灯片(幻灯片6)并点击删除幻灯片:
PowerPoint窗口打开,幻灯片被插入,右键点击了幻灯片6,小对话框中选择了删除幻灯片
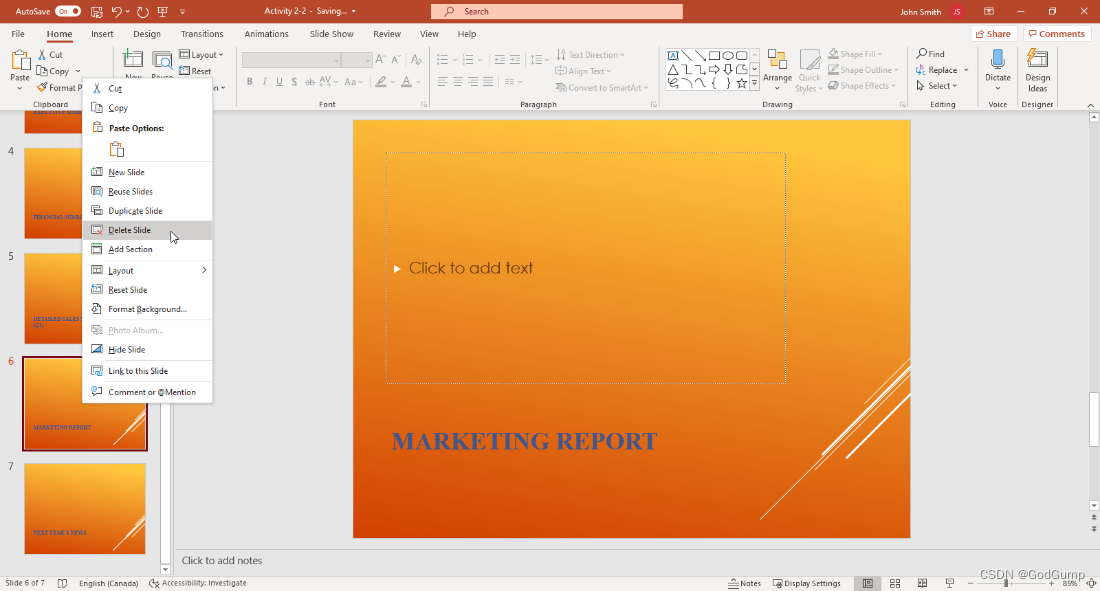
现在,选择详细的销售摘要幻灯片(幻灯片5)。按Ctrl + D三次,创建三个副本:
PowerPoint窗口打开,选择了详细的销售摘要幻灯片(幻灯片5),按Ctrl + D三次创建了三个副本
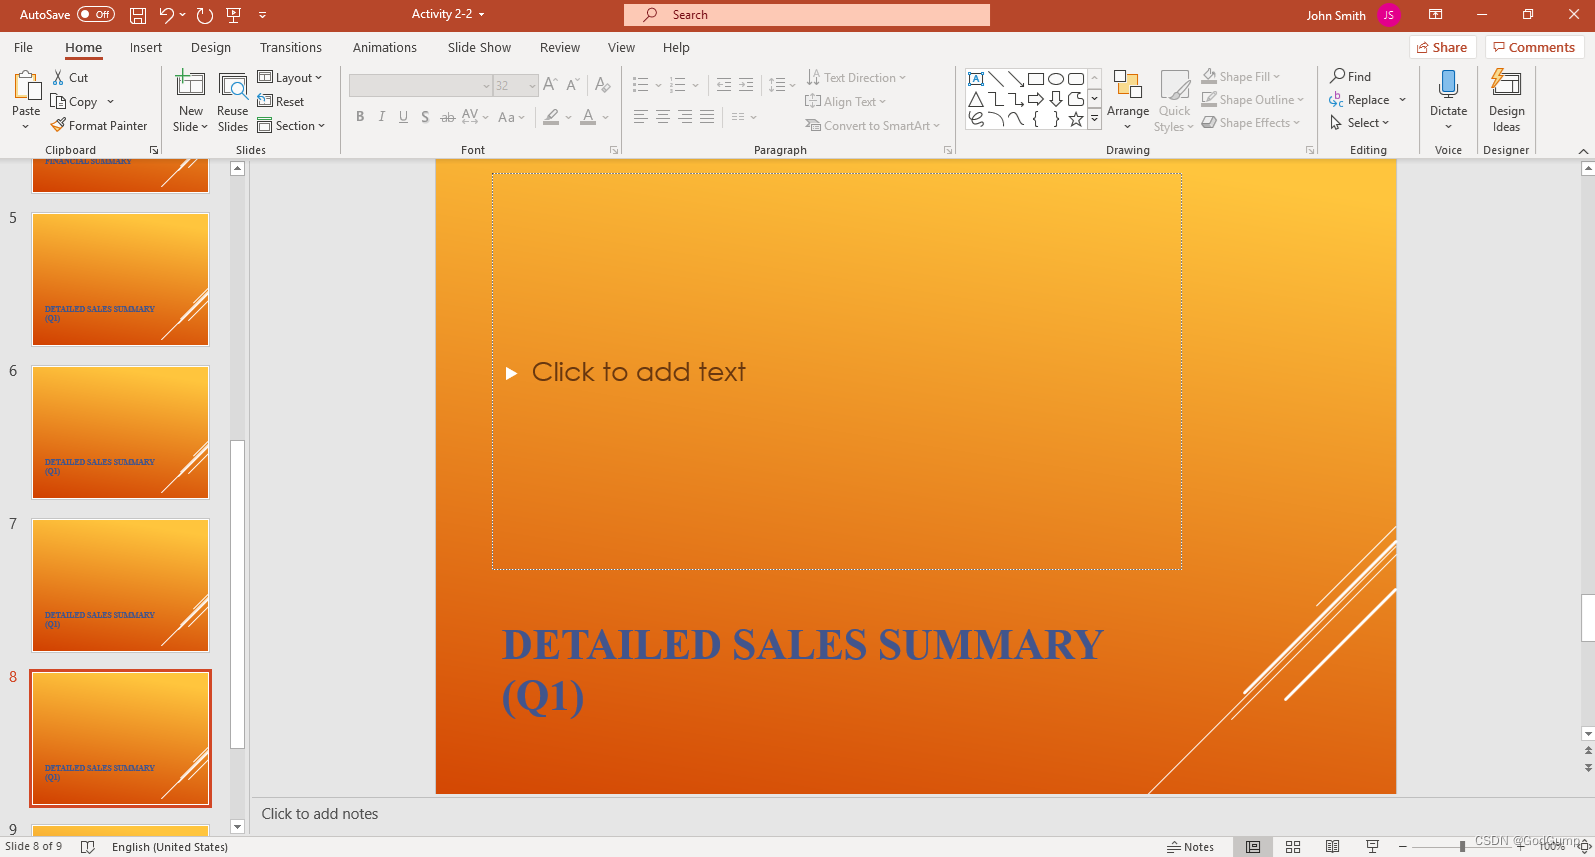
在第一个销售摘要幻灯片中将Q1替换为“Quarter 1”:
PowerPoint窗口打开,在幻灯片的文本框中选择了Q1,并将其替换为"Quarter 1"
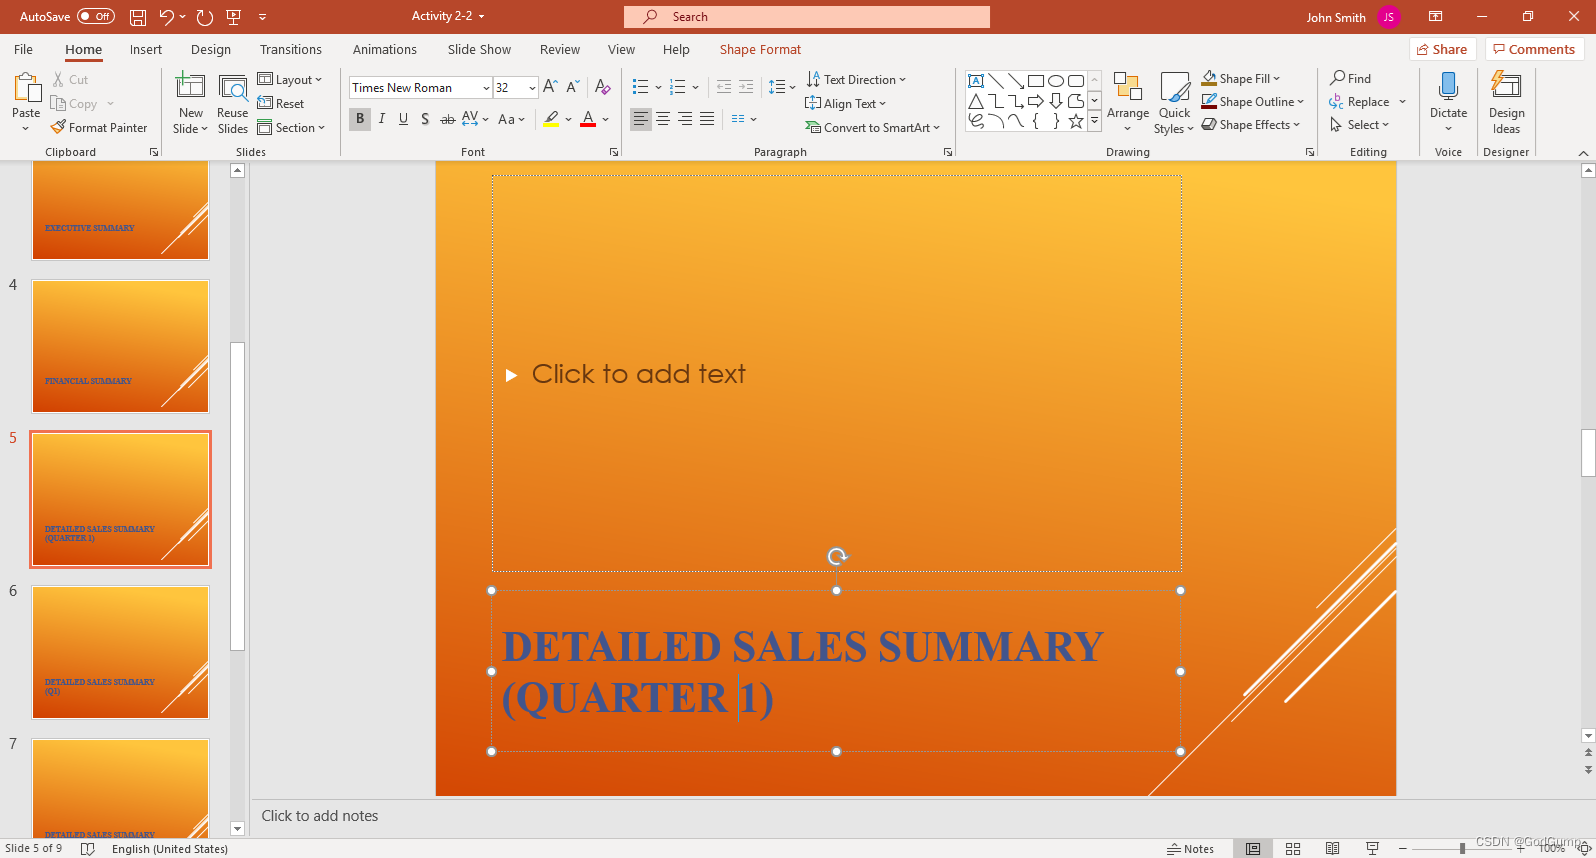
重复这一步骤,为接下来的三个幻灯片创建第二、三、四季度的幻灯片:
PowerPoint窗口打开,创建了第二、第三和第四季度的幻灯片
最后,我们需要在演示文稿末尾添加模板信息。点击选择最后一张幻灯片(幻灯片9)。然后,点击首页 → 重复使用幻灯片:
PowerPoint窗口打开,选择了幻灯片9,首页选中,重复使用幻灯片选项被选中
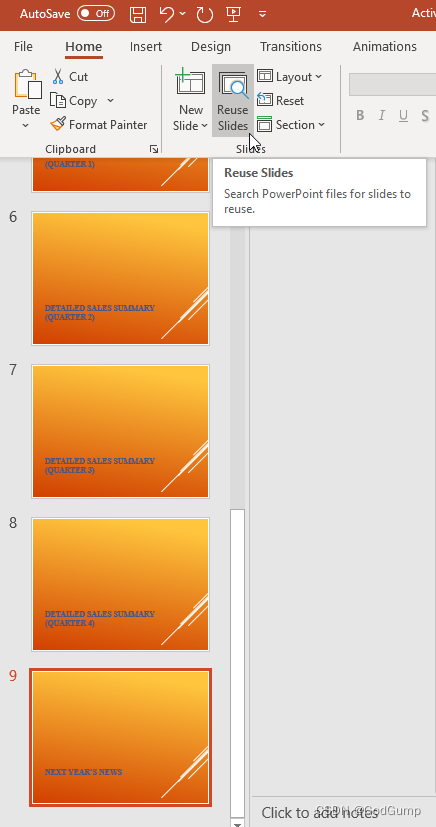
在"重复使用幻灯片"窗格中,点击"浏览"按钮,定位到你的"练习文件"文件夹:
"重复使用幻灯片"窗格打开,选择"浏览"按钮
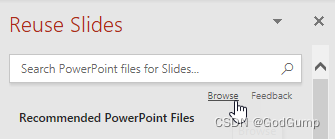
选择"Activity 2-2 Slides"文件,点击"选择幻灯片":
"选择幻灯片"窗口打开,选择"Activity 2-2 Slides"文件,点击"选择幻灯片"按钮
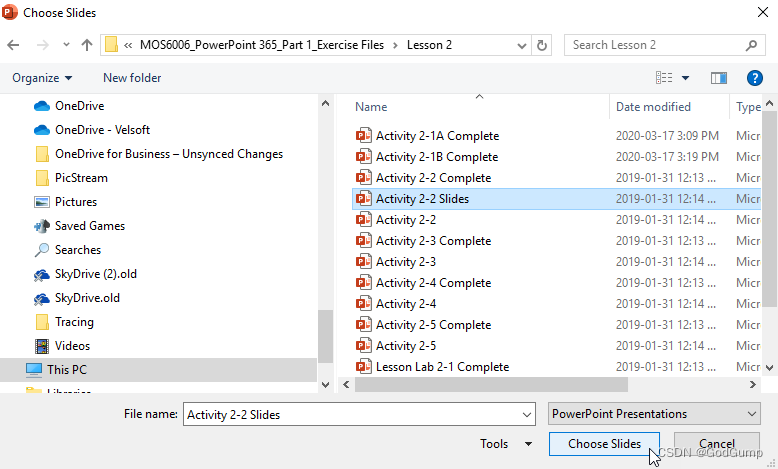
在"重复使用幻灯片"窗格的第一张幻灯片上点击"插入幻灯片":
"重复使用幻灯片"窗格打开,选择第一张幻灯片,点击"插入幻灯片"选项
(如果想保留原始格式,请勾选"使用源格式"框。)
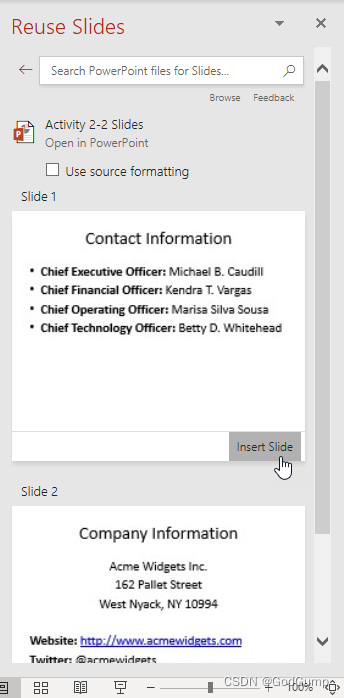
幻灯片将使用演示文稿的主题进行插入:
PowerPoint窗口打开,幻灯片使用演示文稿的主题进行插入
重复这一步骤来插入第二张幻灯片。
关闭"重复使用幻灯片"窗格:
"重复使用幻灯片"窗格打开,点击"X"选项来关闭窗格
为了确保格式正确,确保在幻灯片窗格中选择任意一张幻灯片。然后,点击"主页"→"选择"→"全选":
随机选择一张幻灯片,选择"主页"选项卡,点击"选择",选择"全选"选项
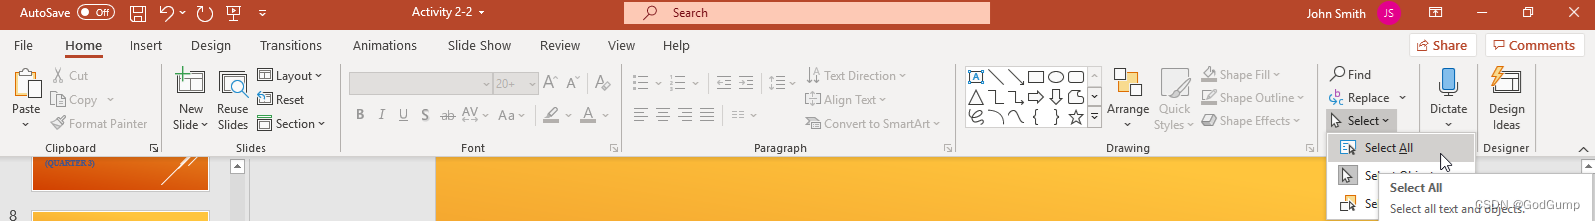
当所有幻灯片都被选中时,点击主页选项卡上的"重置"命令:
PowerPoint窗口打开,所有幻灯片被选中,选择"主页"选项卡,点击"重置"选项
检查格式变化:
PowerPoint窗口打开,对文档的格式变化进行检查
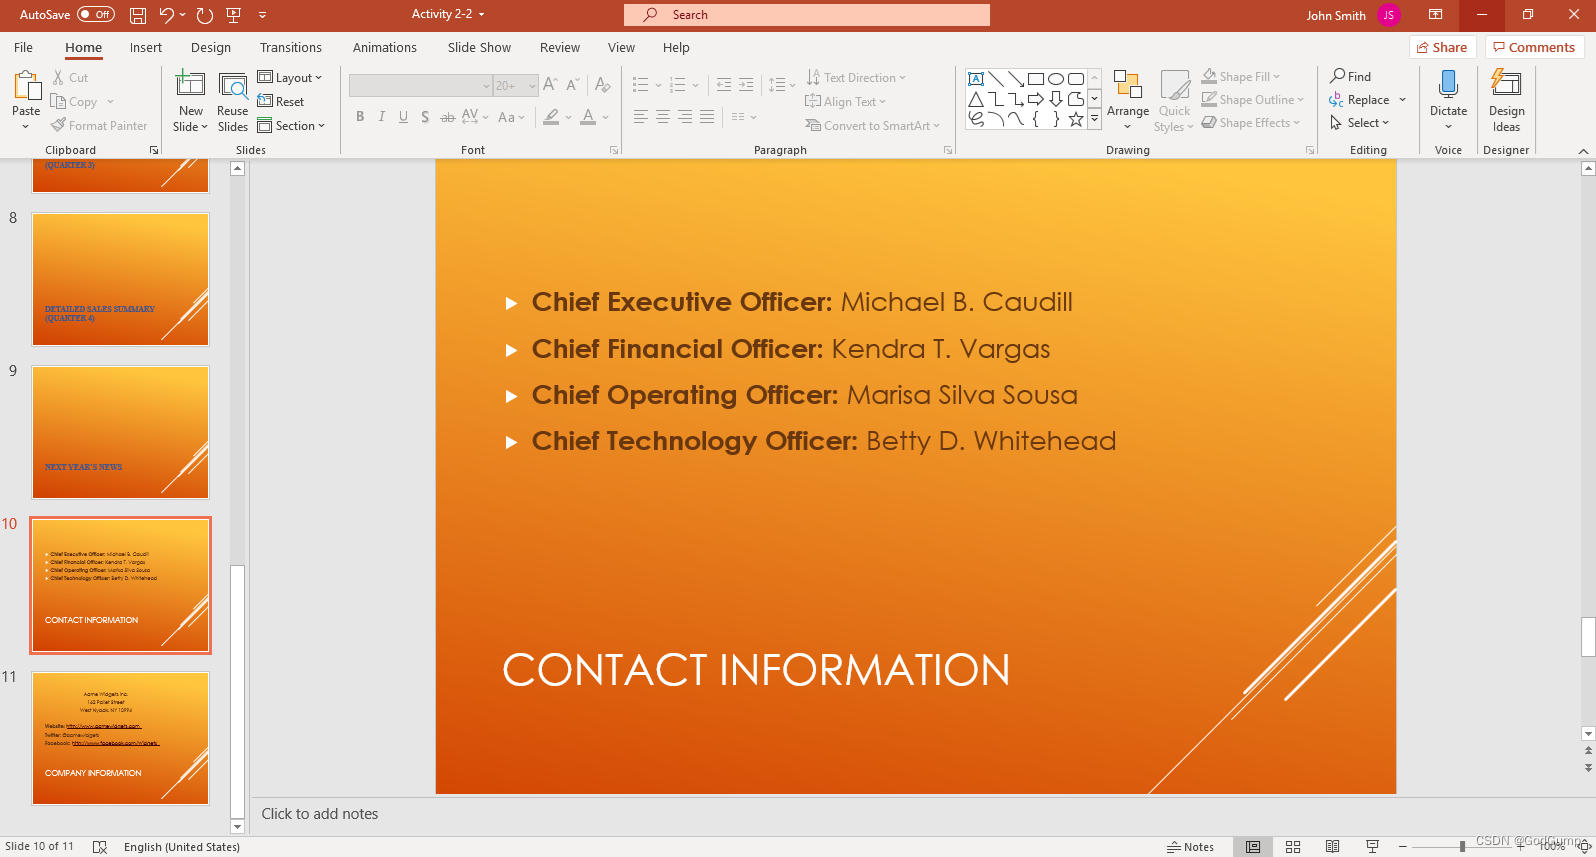
将你的演示文稿保存为"Activity 2-2 Complete"。关闭Microsoft 365 PowerPoint以完成这个任务。
Exercise: Laying out a presentation
Let’s get started!
In this exercise, you will modify the layout and appearance of your annual report presentation.
- Click on the link below to open the Microsoft PowerPoint exercise document you can use to complete this exercise.
Exercise: Laying out a presentation
- First, let’s change the layout of a few of the slides. Click to select Slide 5 in the Slides pane. Hold down the Shift key and click Slide 8. (You may need to scroll down in the Slides pane to see this slide.) This will select all four slides:
PowerPoint window open, Slide 5 until slide 8 selected
- Now, click Home → Layout → Title and Content:
PowerPoint window open, Home tab clicked, Layout option selected, Title and Content option chosen
- This will change the layout of all four slides to include a content placeholder instead of a text placeholder. This is perfect as each slide will include a chart in the future:
PowerPoint window open, the layout was applied in the four slides
- Now let’s change the theme. Click anywhere in the PowerPoint window to de-select the sales summary slides. Select any slide and click the Design tab:
PowerPoint window open, the slides was deselected, a random slide was selected, Design tab selected
- Click the More arrow in the Themes gallery:
Design tab open, More arrow selected in Themes gallery
- Move the mouse over some of the thumbnails in the gallery. As you do this you will see a preview applied to the current slide:
PowerPoint window open, the thumbnails gallery open with the preview layout view
- Click the Frame theme to apply it:
Theme gallery open, Frame option was selected
- Preview some of the variants for this theme by moving your mouse over the thumbnails in the Variants gallery:
PowerPoint window open, theme was applied, gallery Variants open in the top of the window
- Finally, let’s create a background style for the title slide. Click to select Slide 1 in the Slides pane. Then, click the More arrow in the Variants group on the Design tab:
Design tab open, slide 1 selected, the More arrow in the Variants group clicked
- Click Background Styles from the expanded gallery:
Gallery open, Background Styles clicked
- Right-click Style 11 and click Apply to Selected Slides:
Variants gallery open, right-clicked in the style 11, Apply to Selected Slides option selected
- Let’s check out the settings for this style. Click Design → Format Background:
Design tab selected, Format Background option chosen
- The Format Background task pane will open and show the details for the gradient fill that is applied. Click the Type menu and click Shade from title:
Background task pane open, with the details of the gradient fill, Type menu clicked, Shade from title selected
- Observe your changes:
PowerPoint window open, changes applied
- Save your presentation as Activity 2-3 Complete. Close Microsoft 365 PowerPoint to complete this activity.
练习:演示文稿的布局
让我们开始吧!
在这个练习中,您将修改年度报告演示文稿的布局和外观。
点击下面的链接,打开Microsoft PowerPoint练习文档,您可以使用它来完成这个练习。
练习:演示文稿的布局
首先,让我们修改几个幻灯片的布局。在幻灯片窗格中点击选择第5张幻灯片。按住Shift键点击第8张幻灯片。(您可能需要在幻灯片窗格中向下滚动才能看到这张幻灯片。)这将选择这四张幻灯片:
PowerPoint窗口打开,选择了从第5张幻灯片到第8张幻灯片。
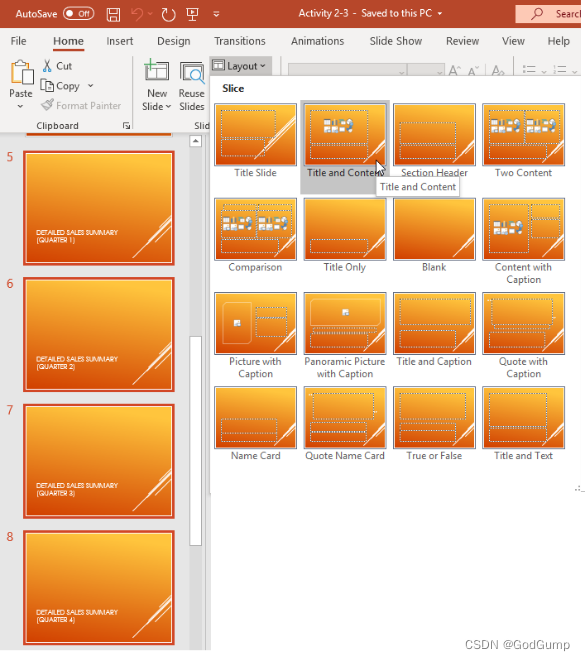
然后,点击首页→布局→标题和内容:
PowerPoint窗口打开,点击了首页标签,选择了布局选项,选择了标题和内容选项。

这将把这四张幻灯片的布局更改为包含内容占位符而不是文本占位符。这非常适合,因为每张幻灯片将来都会包含一个图表:
PowerPoint窗口打开,布局在这四张幻灯片上被应用。
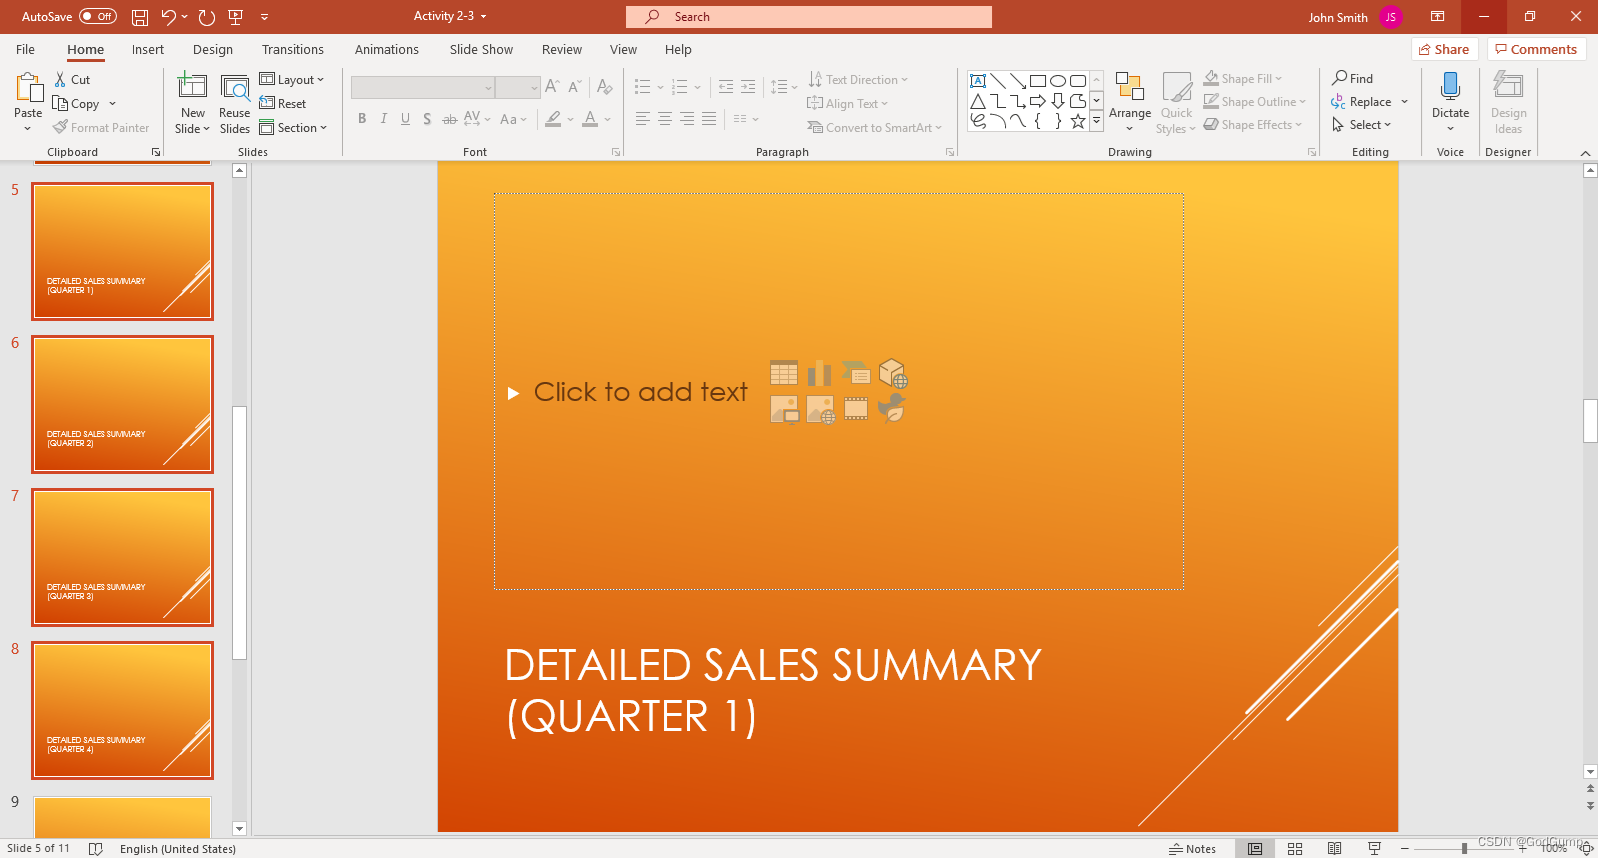
现在让我们更改主题。在PowerPoint窗口的任何地方点击以取消选择销售总结幻灯片。选择任何一张幻灯片,并点击设计标签:
PowerPoint窗口打开,幻灯片被取消选择,随机选择了一张幻灯片,选择了设计标签。

点击主题库中的更多箭头:
设计标签打开,主题库中选择了更多箭头。
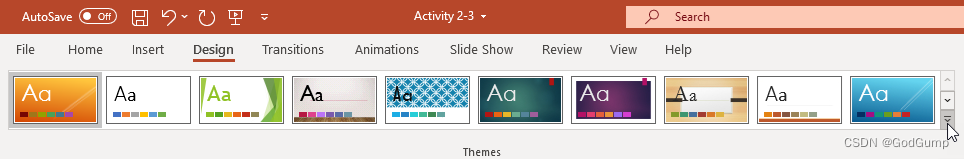
将鼠标移到主题库中的一些缩略图上。在这样做时,您将看到当前幻灯片上应用的预览:
PowerPoint窗口打开,缩略图库中显示了预览布局。
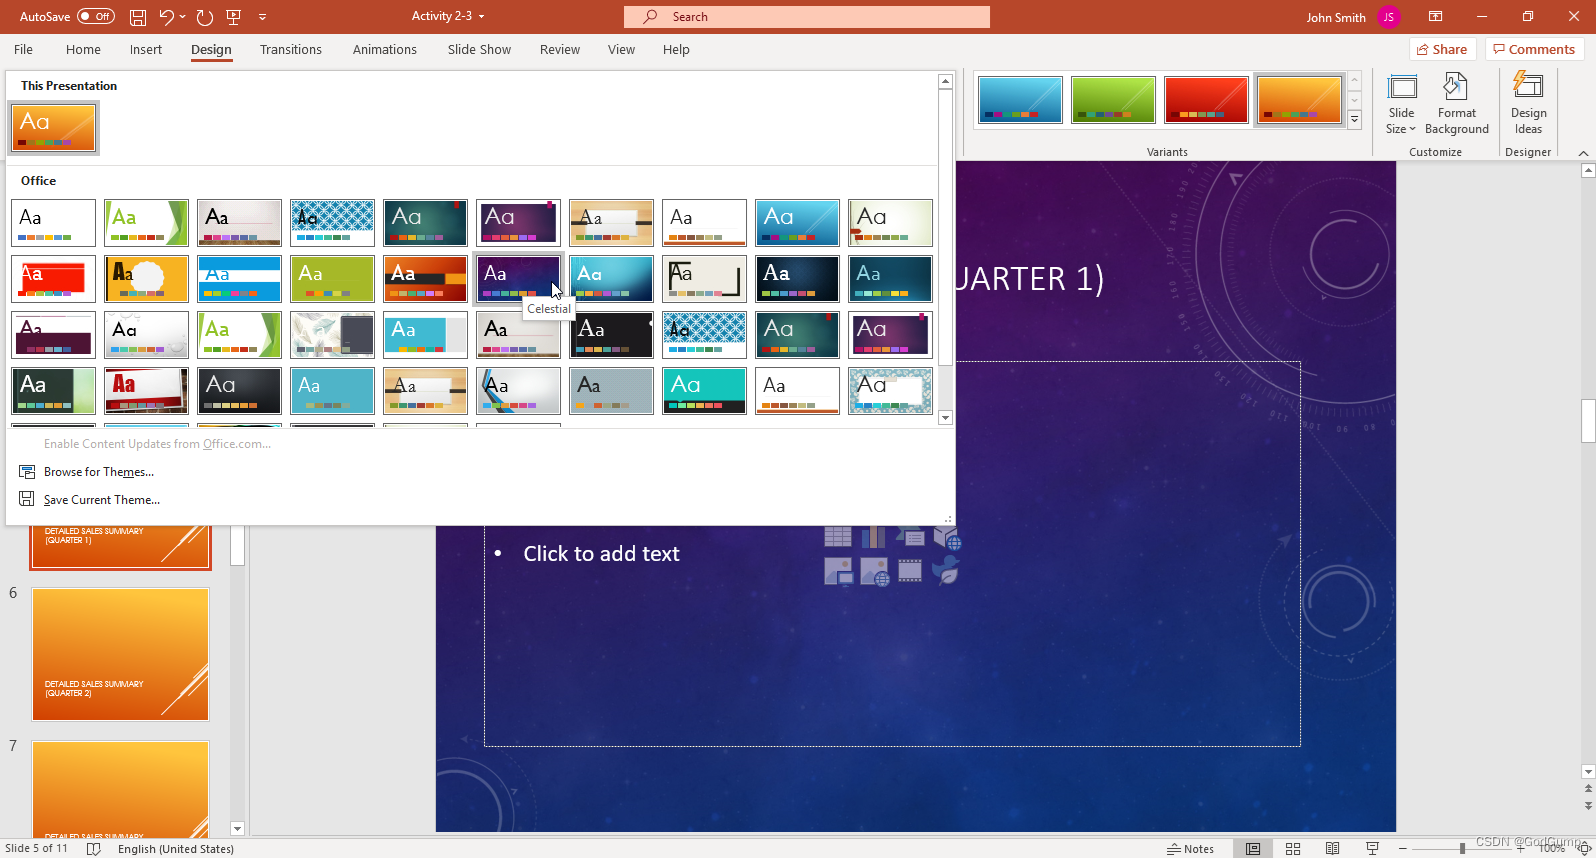
点击“Frame”主题以应用它:
主题库打开,选择了“Frame”选项。
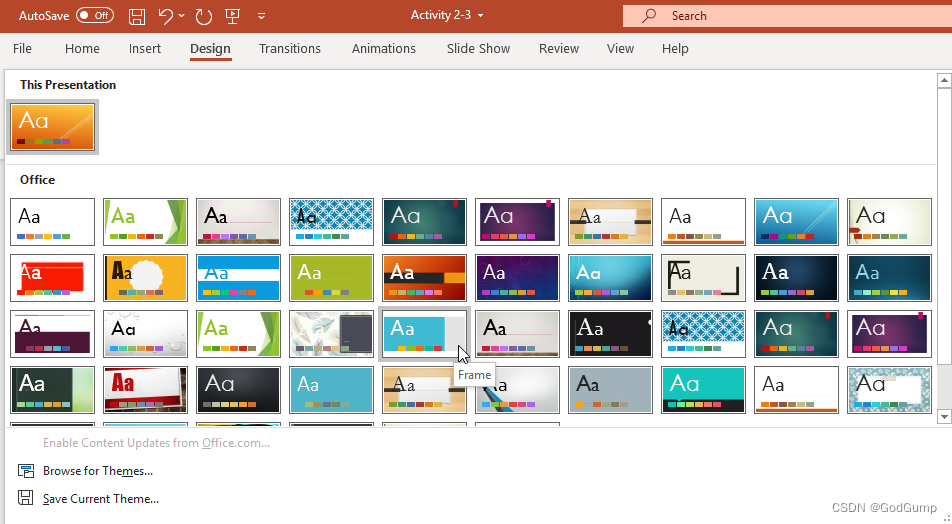
通过将鼠标移到变体库中的缩略图上,预览一些该主题的变体:
PowerPoint窗口打开,主题已应用,顶部打开了变体库。
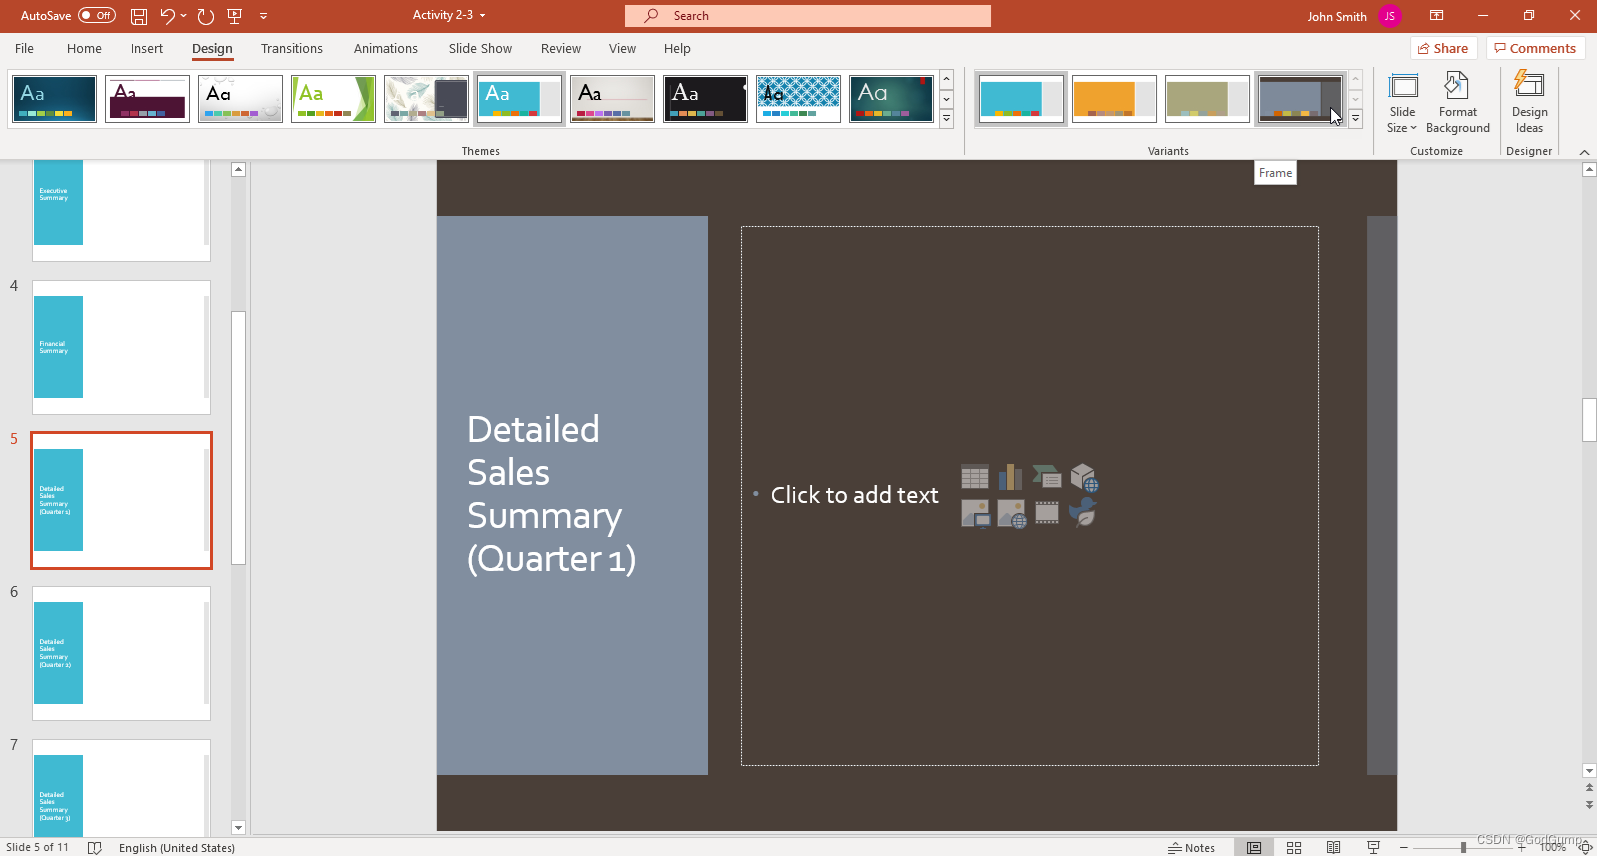
最后,让我们为标题幻灯片创建一个背景样式。在幻灯片窗格中点击选择第1张幻灯片。然后,在设计标签的变体组中点击更多箭头:
设计标签打开,选择了幻灯片1,点击了变体组中的更多箭头。

从展开的库中点击“背景样式”:
库打开,点击了“背景样式”。
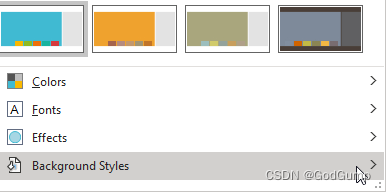
右键点击样式11,选择“应用于选定幻灯片”:
打开变体画廊,右键点击样式11,在选项中选择“应用于选定幻灯片”
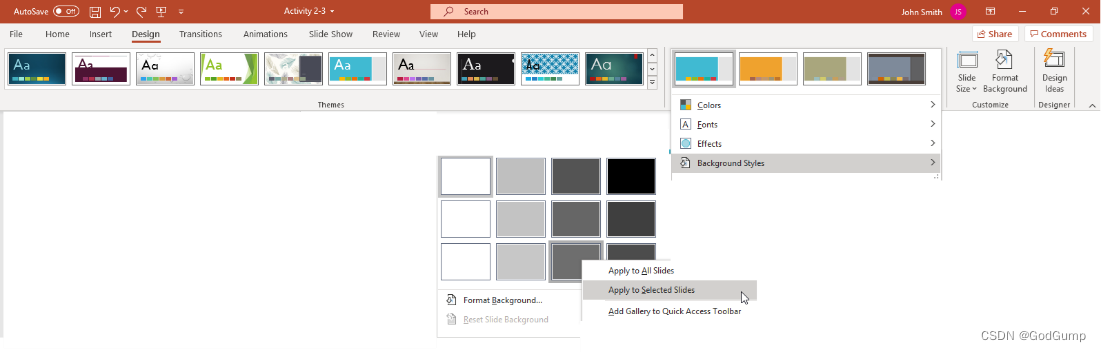
让我们查看此样式的设置。点击“设计”→“格式背景”:
选择“设计”选项卡,点击“格式背景”选项

格式背景任务窗格将打开,并显示应用的渐变填充的详细信息。点击“类型”菜单,选择“从标题渐变”:
打开背景任务窗格,显示渐变填充的详细信息,点击“类型”菜单,选择“从标题渐变”
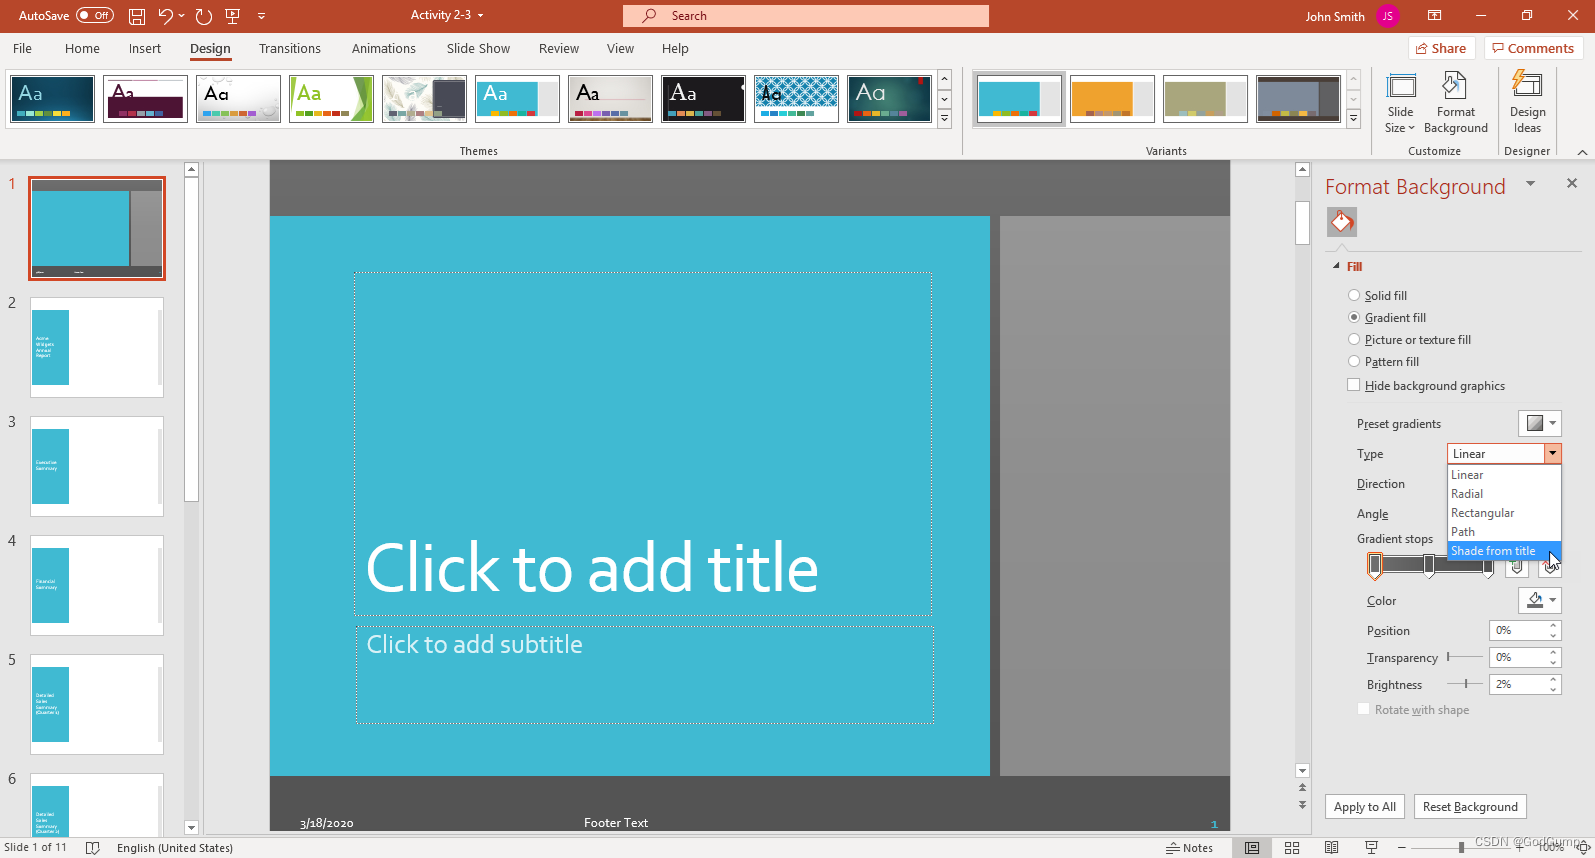
观察您的更改:
PowerPoint窗口中显示应用的更改
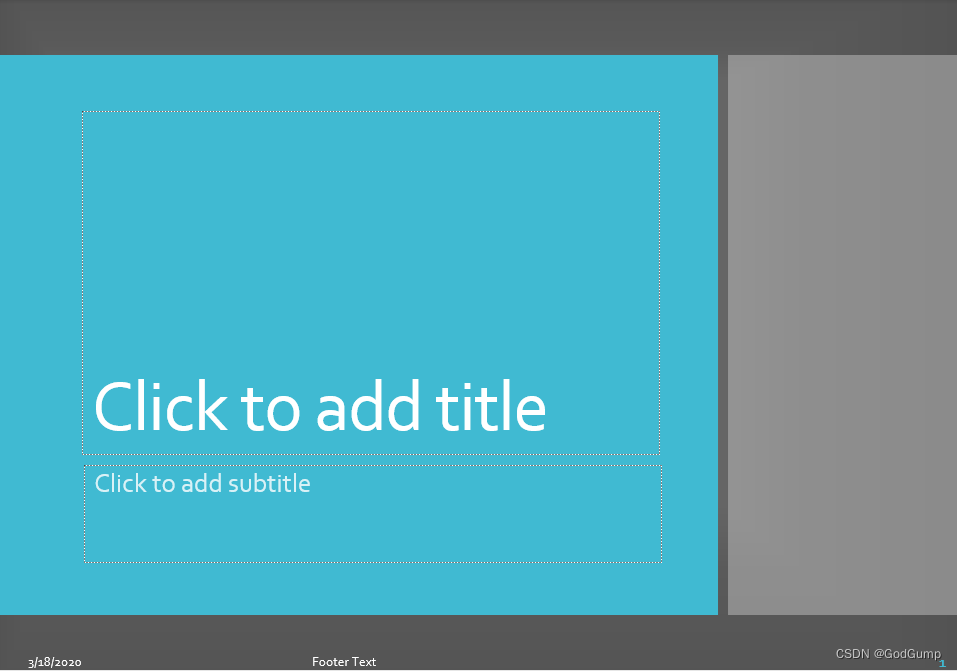
将您的演示文稿保存为“活动2-3完成”。关闭Microsoft 365 PowerPoint以完成此活动。
Exercise: Creating SmartArt
Let’s get started!
A presentation that you are working on needs some SmartArt to help explain your company’s organizational structure.
- Click on the link below to open the Microsoft PowerPoint exercise document you can use to complete this exercise.
Exercise: Creating SmartArt
- Display slide four. Click the Insert SmartArt Graphic placeholder in the center of this slide:
PowerPoint window open, Slide 4 was displayed, Insert SmartArt Graphic selected
- The Choose a SmartArt Graphic dialog box will now be displayed. Select the Hierarchy category and then click the Organization Chart option. Click OK:
SmartArt Graphic dialog box open, Hierarchy was selected, Organization Chart option clicked, Ok button selected
- A SmartArt graphic will now appear on the current slide using the type that you selected:
Slide 4 open, the SmartArt graphic appears in the slide using the type that was selected
- Inside the Text pane, type “President” beside the first bullet point. You will see this text appear inside the associated shape in the graphic:
PowerPoint window open, “President” word was typed inside the Text pane
(If the Text pane is not visible, click SmartArt Design → Text Pane.)
- Complete the graphic to match the image below:
PowerPoint window open, the graphic was completed
- Now you would like to change the color of this graphic. With the SmartArt graphic still selected, click SmartArt Design → Change Colors → Transparent Gradient Range – Accent 3:
PowerPoint open, SmartArt Design tab selected, Change Colors selected, Transparent Gradient Range - Accent3 option chosen
- The SmartArt graphic should now look like this:
Slide 4 open, the changes was applied in the slide
- Save the current presentation as Activity 3-1 Complete. Close Microsoft 365 PowerPoint.
练习:创建智能图形
让我们开始!
你正在编辑的演示文稿需要一些智能图形来帮助解释你公司的组织结构。
点击下面的链接,打开Microsoft PowerPoint的练习文档,用于完成这个练习。
练习:创建智能图形
显示第四张幻灯片。点击中央的“插入智能图形”占位符:
打开PowerPoint窗口,显示第四张幻灯片,选择插入智能图形占位符
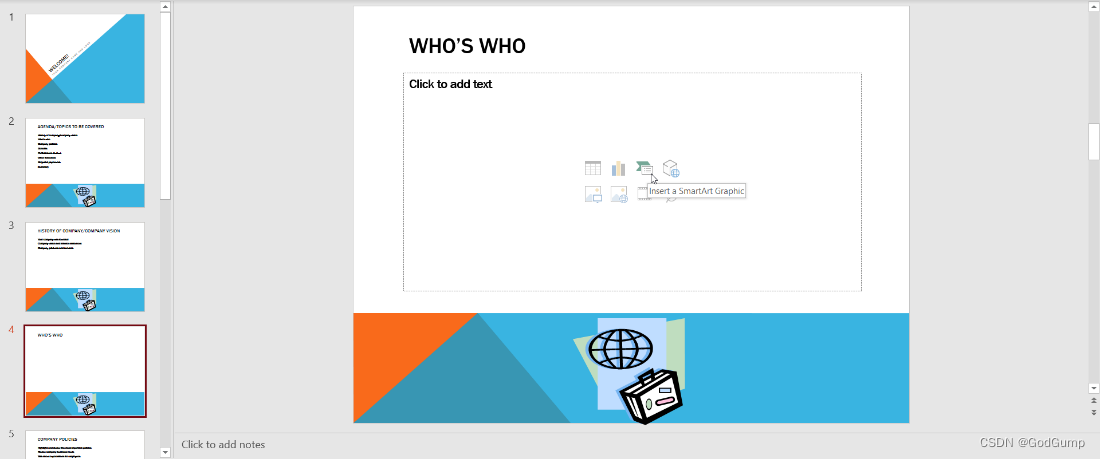
现在会显示“选择智能图形”对话框。选择“层次结构”类别,然后点击“组织图”选项。点击“确定”:
打开智能图形对话框,选择层次结构,点击组织图选项,点击确定按钮
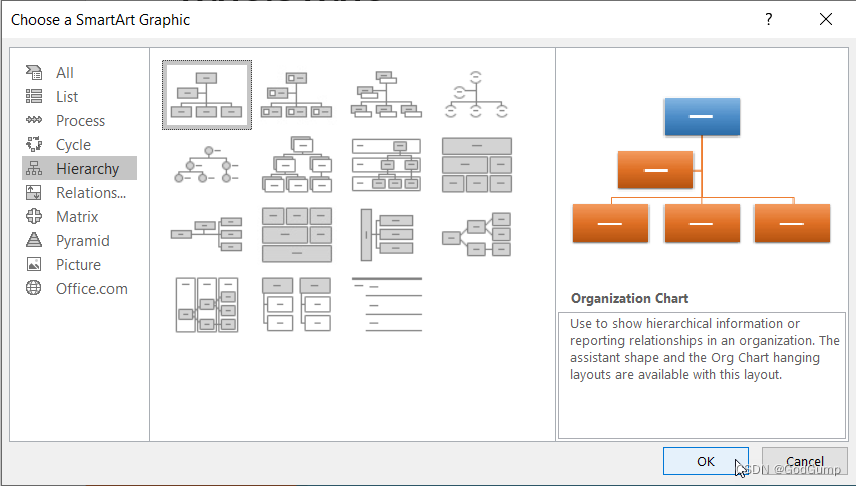
现在在当前幻灯片上会出现一个智能图形,使用你选择的类型:
打开第四张幻灯片,智能图形在幻灯片上显示,使用之前选择的类型
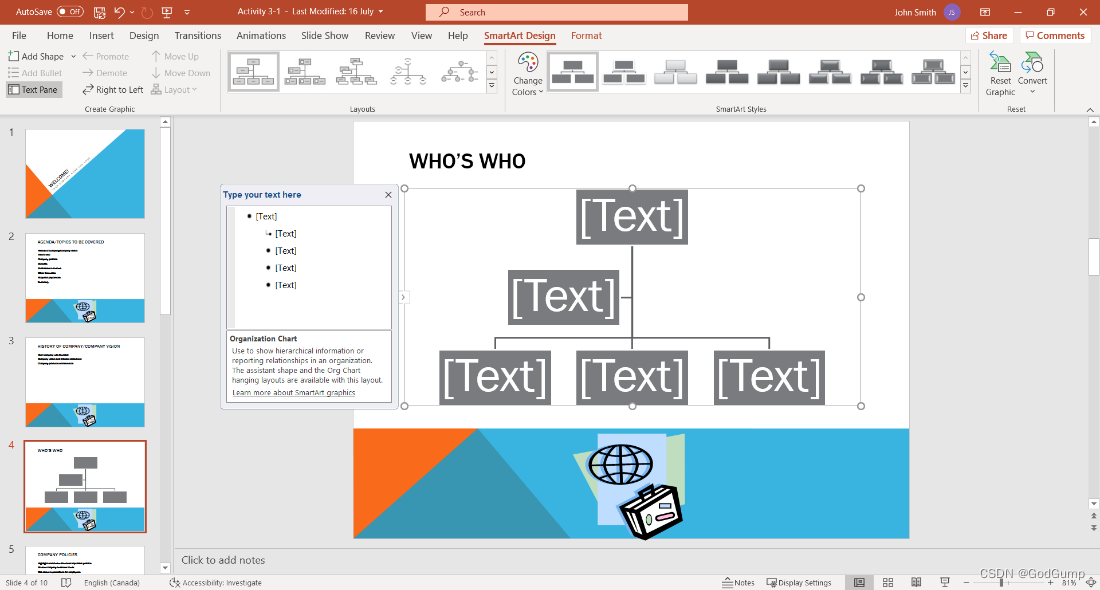
在文本窗格中,输入“President”在第一个项目符号旁边。你会看到这个文本出现在图形中相应的形状内:
打开PowerPoint窗口,文本窗格中输入“President”
(如果文本窗格不可见,点击智能图形设计 → 文本窗格。)
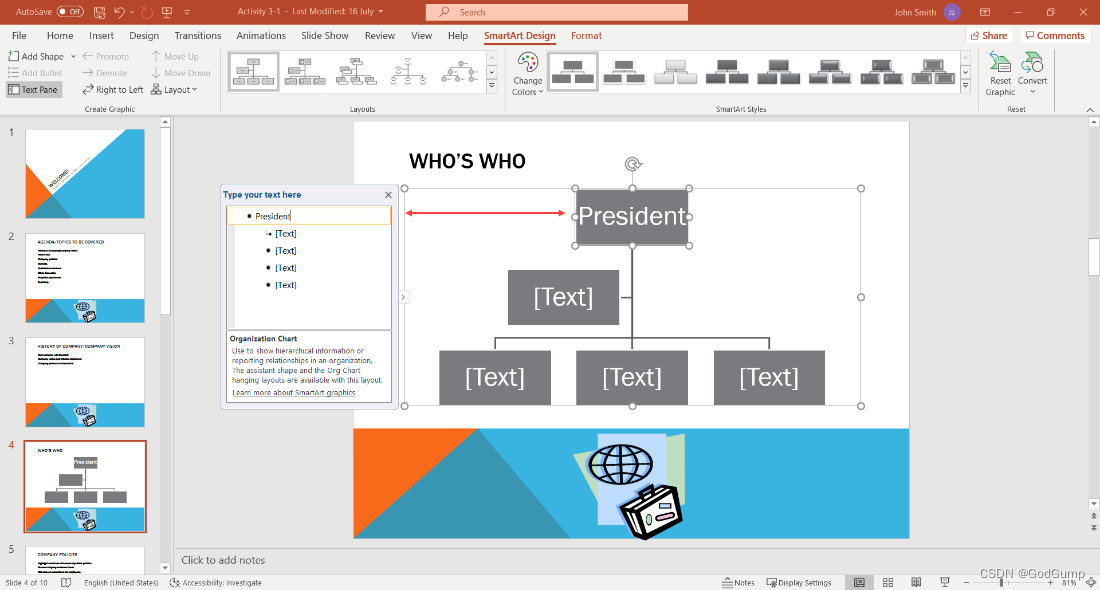
完成图形,使其与下面的图像匹配:
打开PowerPoint窗口,图形已完成
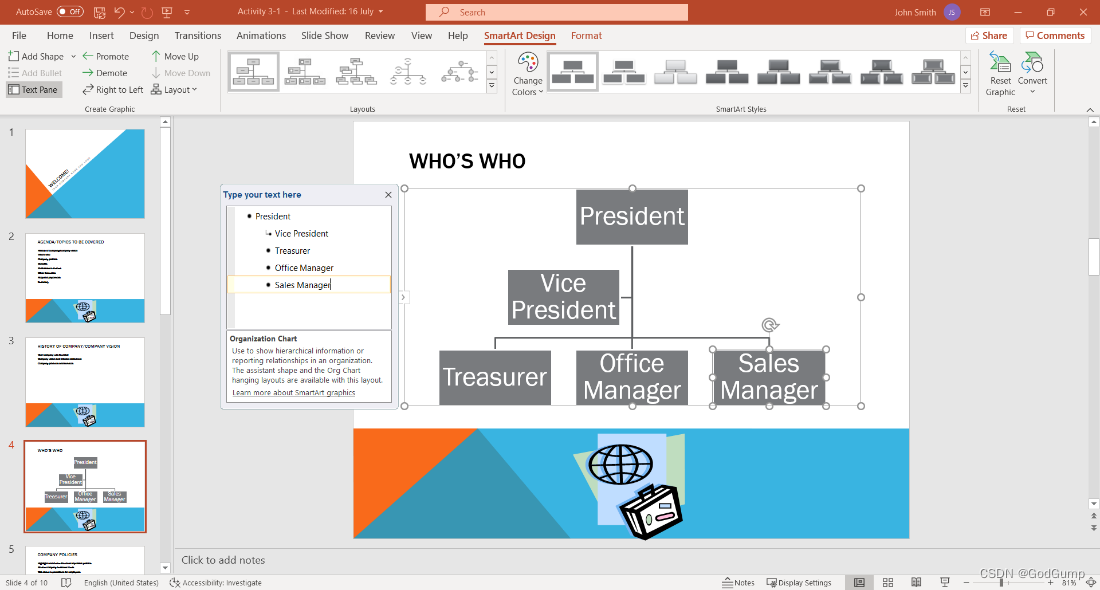
现在你想要更改这个图形的颜色。仍然选择智能图形,点击智能图形设计 → 更改颜色 → 透明渐变范围 - 强调3:
打开PowerPoint窗口,选择智能图形设计选项卡,选择更改颜色,选择透明渐变范围 - 强调3选项
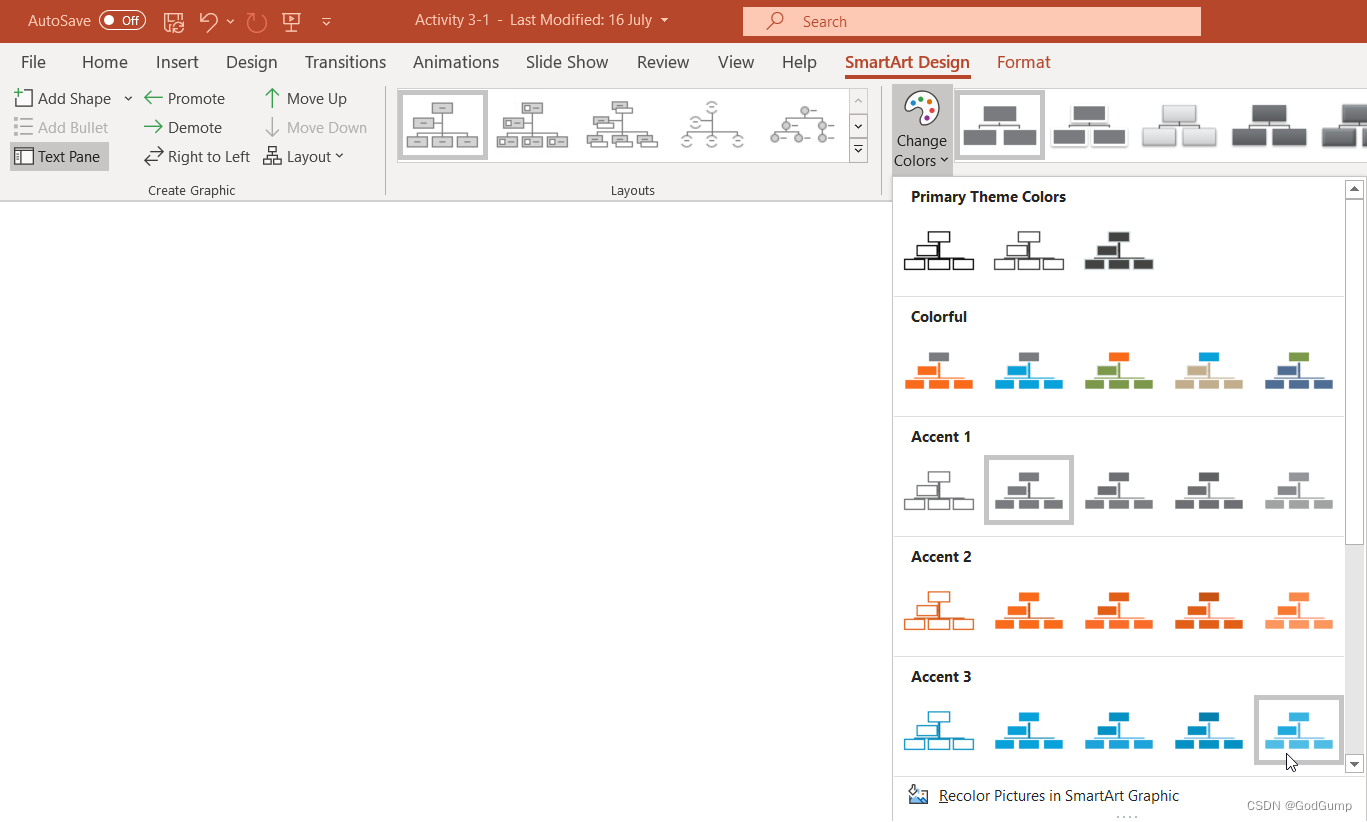
现在智能图形应该看起来像这样:
打开第四张幻灯片,已应用更改
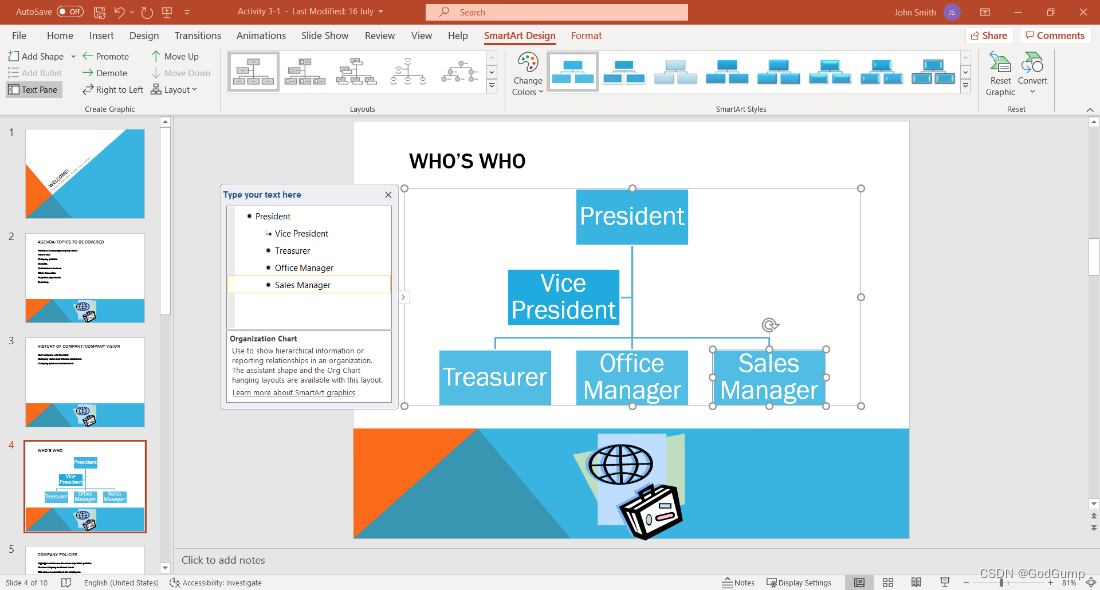
将当前演示文稿保存为“Activity 3-1 Complete”。关闭Microsoft 365 PowerPoint。
Exercise: Grouping objects
Let’s get started!
In this activity, you will improve the layout of the images in our product overview slide.
- Click on the link below to open the Microsoft PowerPoint exercise document you can use to complete this exercise.
Exercise: Grouping objects
- Click slide 3:
PowerPoint window open, Slide 3 selected
- Hold down the Ctrl key and click both of the images on the left-hand side of the slide to select them:
Slide 3 open, both images on the left-hand side was selected
- Right-click the selection and click Group → Group:
Right-clicked , a small pane open, Group option selected, group selected
- Click and drag to move the new group upwards and to the left so that both images are on the slide:
Slide 3 open, the images was grouped
- With the group still selected, click Home → Arrange → Ungroup:
The images group was selected, Home tab selected, Arrange selected, a small pane opens, Ungroup option selected
- Now the images will appear as two separate objects:
The images were separated
- With either object (or both objects) selected, click Picture Format → Group → Regroup to restore the group:
The both images was selected, Picture Format selected, group option selected, Regroup was chosen
- Save your presentation as Activity 5-3 Complete. Close Microsoft 365 PowerPoint to complete this activity.
练习:对象分组
让我们开始吧!
在这个活动中,您将改进产品概述幻灯片中图片的布局。
点击下面的链接以打开包含 Microsoft PowerPoint 练习的文档。
练习:对象分组
点击幻灯片 3:
打开了 PowerPoint 窗口,选中了幻灯片 3。
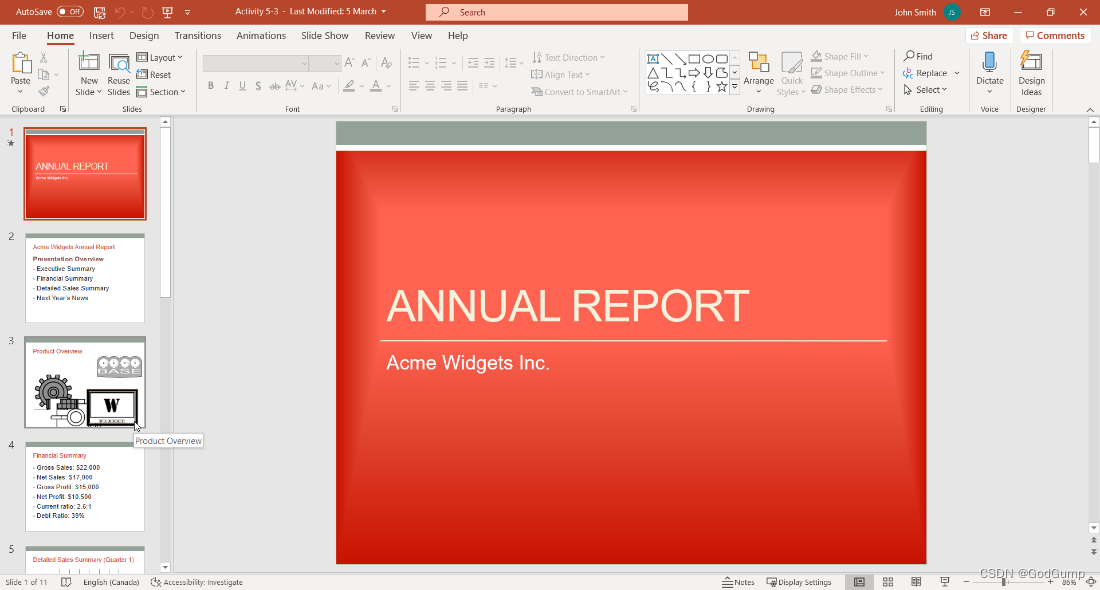
按住 Ctrl 键,并点击幻灯片左侧的两个图片以选择它们:
在幻灯片 3 上,通过按住 Ctrl 键点击左侧的两个图片,将其选中。

右键点击选中的图片,选择“组合”→“组合”:
右键点击选中的图片,在弹出的菜单中选择“组合”→“组合”。
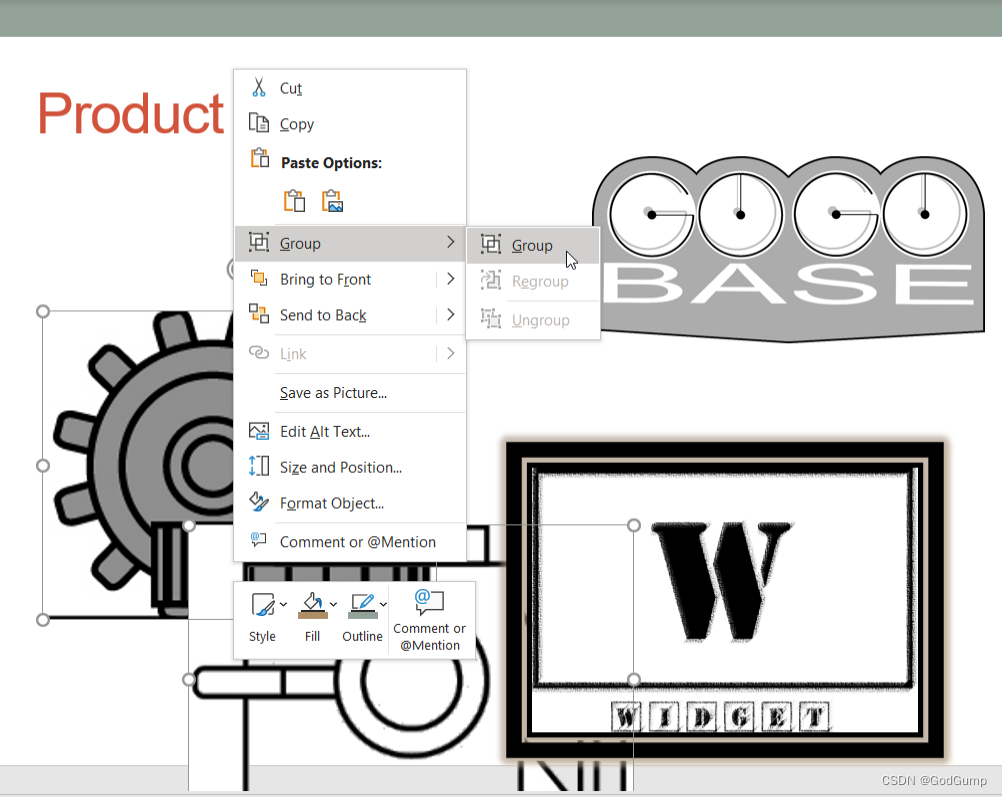
点击并拖动新的组合向上和向左移动,使两个图片都在幻灯片上:
通过点击并拖动新的组合对象,将其向上和向左移动,使两个图片都放置在幻灯片上。

仍然选中组合对象,点击“首页”→“排列”→“取消组合”:
仍然选中组合对象,点击“首页”选项卡,选择“排列”选项,然后选择“取消组合”。
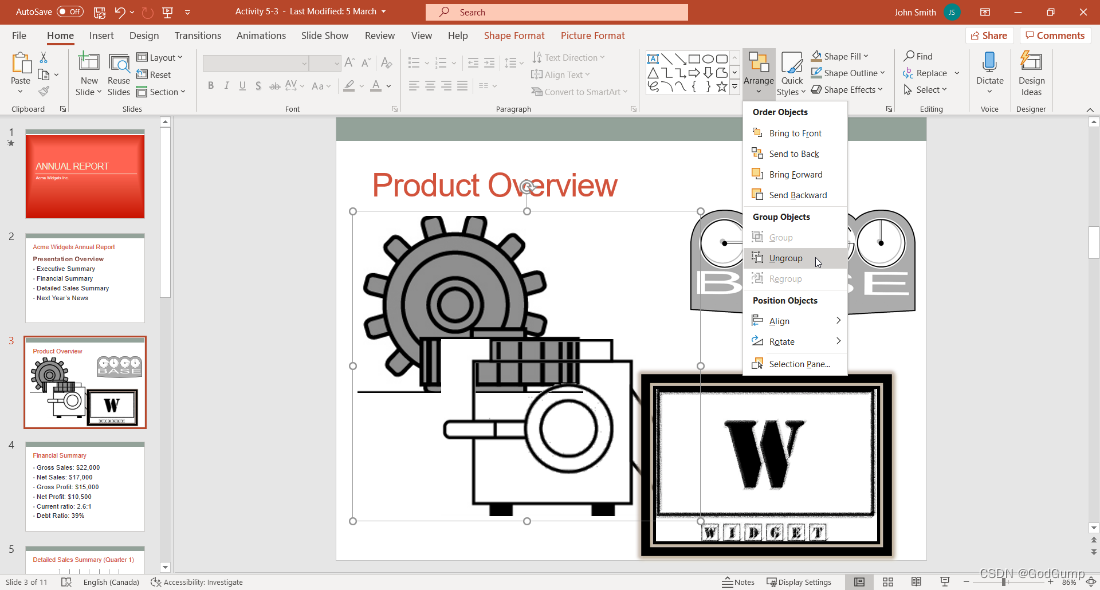
现在,图片将作为两个单独的对象显示:
现在,两个图片将作为两个单独的对象显示。
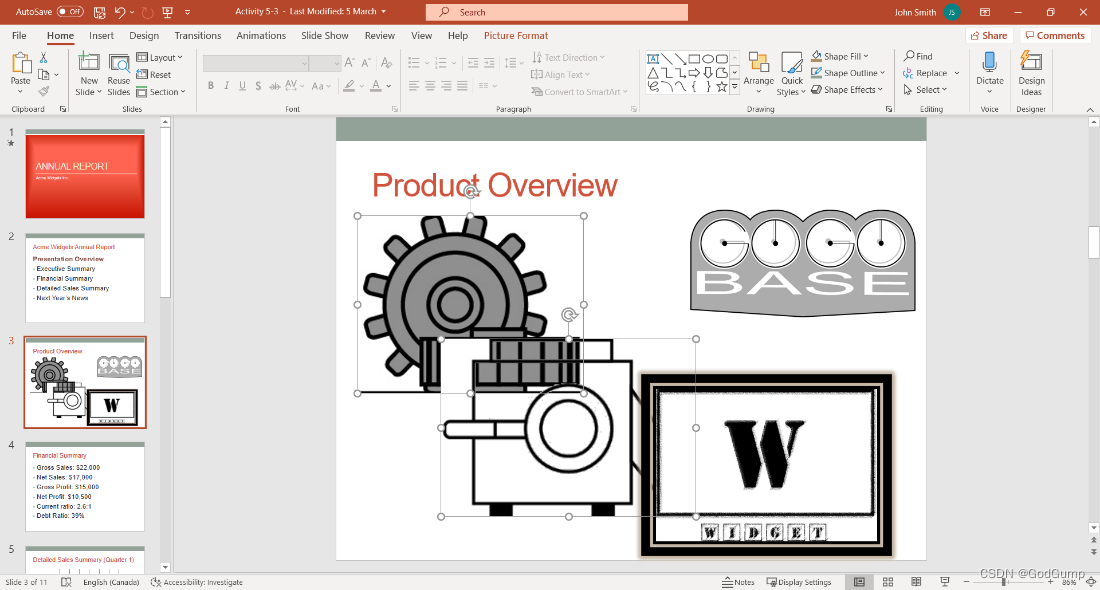
选中任何一个对象(或两个对象都选中),点击“图片格式”→“组合”→“重新组合”以恢复组合:
选中任何一个对象(或两个对象都选中),点击“图片格式”选项卡,选择“组合”选项,然后选择“重新组合”。
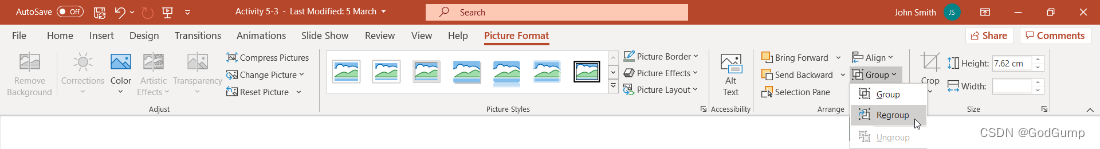
将您的演示文稿保存为“Activity 5-3 Complete”。关闭 Microsoft 365 PowerPoint 以完成这个活动。
Exercise: Arranging objects
Let’s get started!
In this activity, you will finalize the layout of the images on the product overview slide.
- Click on the link below to open the Microsoft PowerPoint exercise document you can use to complete this exercise.
Exercise: Arranging objects
- First, let’s set up the grid to help us arrange the images. Click the View tab and click the option button in the Show group:
PowerPoint window open, View tab selected, the option button in the Show group was selected
- The Grid and Guides dialog box will open. Ensure that the checkbox in the Snap to section is checked. As well, check the Display grid on screen option. Click OK:
Grid and Guides window open, Snap to section was checked, and Display grid on screen too, “OK” button selected
- The grid will now be displayed. Click slide 3:
Grid was displayed, Slide 3 selected
- Click the gray gear image. Click Picture Format → Bring Forward:
Grey gear image selected, Picture Format selected, Bring Forward command selected
- This image will now be displayed on top of the transparent image:
The mage was displayed on top of the transparent image
- Click and drag down the transparent image (in the lower left-hand corner) until it is aligned with the grid. (Ensure that the right-hand guide stays in position.) Release your mouse button when the image is in position:
The transparent image was aligned with the grid
- Now, we can turn off the grid. Click the View tab:
PowerPoint window open, View tab selected
- Uncheck the Gridlines box in the Show group:
The Gridlines box was uncheck in the Show group
- This activity is now complete. Save your presentation as Activity 5-4 Complete and close Microsoft 365 PowerPoint.
练习:排列对象
让我们开始吧!
在这个活动中,您将完成产品概览幻灯片上图像的布局。
点击下面的链接以打开包含练习的 Microsoft PowerPoint 文档,您可以使用它来完成这个练习。
练习:排列对象
首先,让我们设置网格,以帮助我们排列图像。点击“查看”选项卡,然后点击“显示”组中的选项按钮:
PowerPoint 窗口打开,选择“查看”选项卡,然后选择“显示”组中的选项按钮。
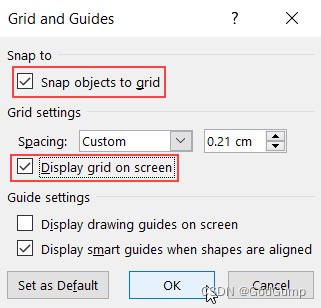
网格和参考线对话框将打开。确保“捕捉到”部分的复选框已被选中。同时,选中“在屏幕上显示网格”选项。点击“确定”:
网格和参考线对话框打开,确认“捕捉到”部分被选中,同时选中“在屏幕上显示网格”选项,点击“确定”。
网格现在将显示出来。点击幻灯片 3:
网格显示出来,选择幻灯片 3。
点击灰色的齿轮图像。点击“图片格式”→“上移一层”:
选择灰色的齿轮图像,点击“图片格式”,选择“上移一层”命令。
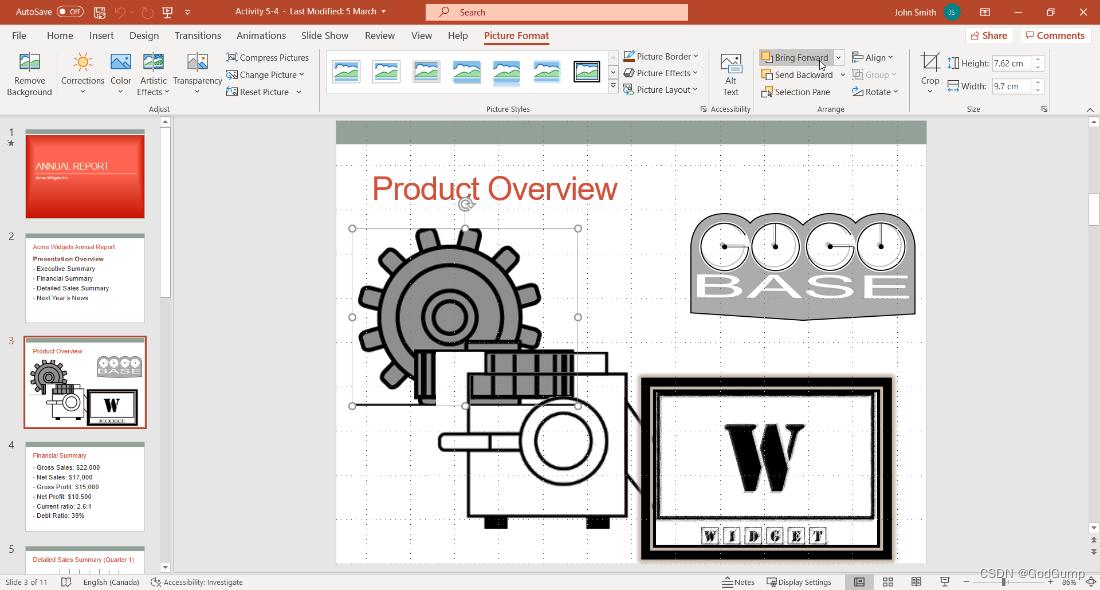
现在,这个图像将显示在透明图像的上面:
图像显示在透明图像的上面。

点击并拖动透明图像(位于左下角),直到与网格对齐。(确保右侧的参考线保持不动。)当图像对齐时释放鼠标按钮:
透明图像与网格对齐。
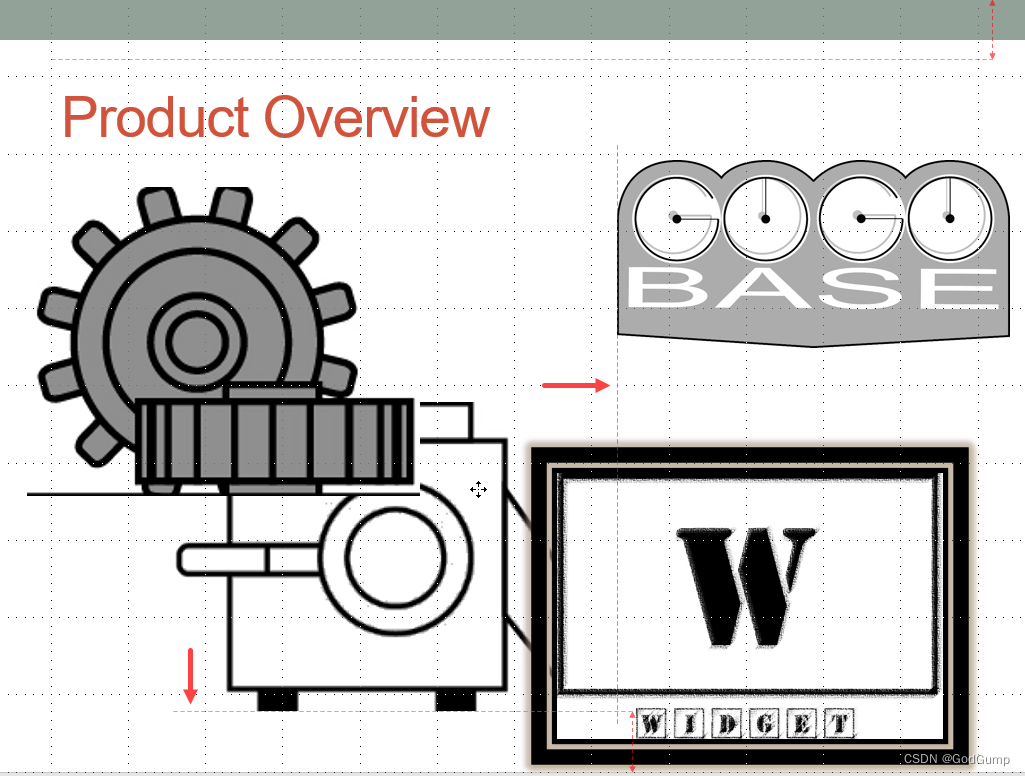
现在,我们可以关闭网格。点击“查看”选项卡:
PowerPoint 窗口打开,选择“查看”选项卡。
在“显示”组中取消选中“网格线”复选框:
在“显示”组中取消选中“网格线”复选框。
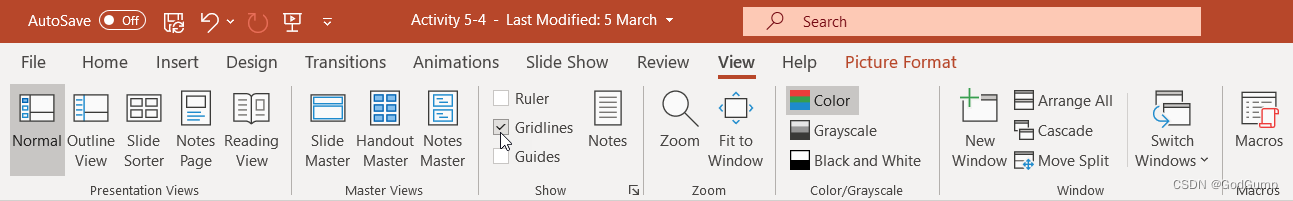
这个活动现在已经完成。将您的演示文稿保存为“Activity 5-4 Complete”,然后关闭 Microsoft 365 PowerPoint。
Exercise: Animating objects
Let’s get started!
In this activity, you will finalize the layout of the images on the product overview slide.
- Click on the link below to open the Microsoft PowerPoint exercise document you can use to complete this exercise.
Exercise: Animating objects
- Click slide 2:
PowerPoint window open, Slide 2 selected
- Select the bullet list:
The bullet list was selected in the slide
- Click the Animations tab and click the Fade animation:
Animations tab selected, Fade animation selected
- Click Animations → Animation Pane:
Animations selected, Animation Pane option clicked
- We will use this task pane to customize our animation. Click the listing for the second bullet:
The second bullet selected in the animation pane
- Click the drop-down arrow next to this item:
The animation pane open, drop-down arrow next to the second item was selected
- Click Start After Previous:
Animation Pane open, a small pane opens, Start After Previous selected
- You will see the small box representing the effect move slightly to the right, to indicate it will appear after the first bullet. Repeat steps six, seven, and eight for the next two bullets so that they are all in sequence:
Animation Pane open, The small box representing the effect moved slightly to the right, the step was repeated in 6, 7, and 8
- Click the first animation to select it. Click Play From to test the animation:
Animation Pane open, first animation selected, Play From selected
- When the preview is complete, close the Animation Pane:
The animation Pane was closed
- Select the bullet list. Click Animations → Animation Painter:
Slide 2 open, bullet list selected, Animations selected, Animation Painter option selected
- Click slide 4. Click the text box containing the bullet list:
Slide 4 selected, The text box containing the bullet list was clicked
- The custom animation will immediately be applied and previewed:
The custom animation was applied and previewed
- Save your presentation as Activity 5-5 Complete. Close Microsoft 365 PowerPoint to complete this activity.
练习:为对象添加动画效果
让我们开始吧!
在这个活动中,你将完成产品概述幻灯片上图片的布局。
点击下面的链接,打开 Microsoft PowerPoint 练习文档,用于完成这个练习。
练习:为对象添加动画效果
点击幻灯片2:
打开 PowerPoint 窗口,选择幻灯片2
选择项目符号列表:
项目符号列表在幻灯片中被选中
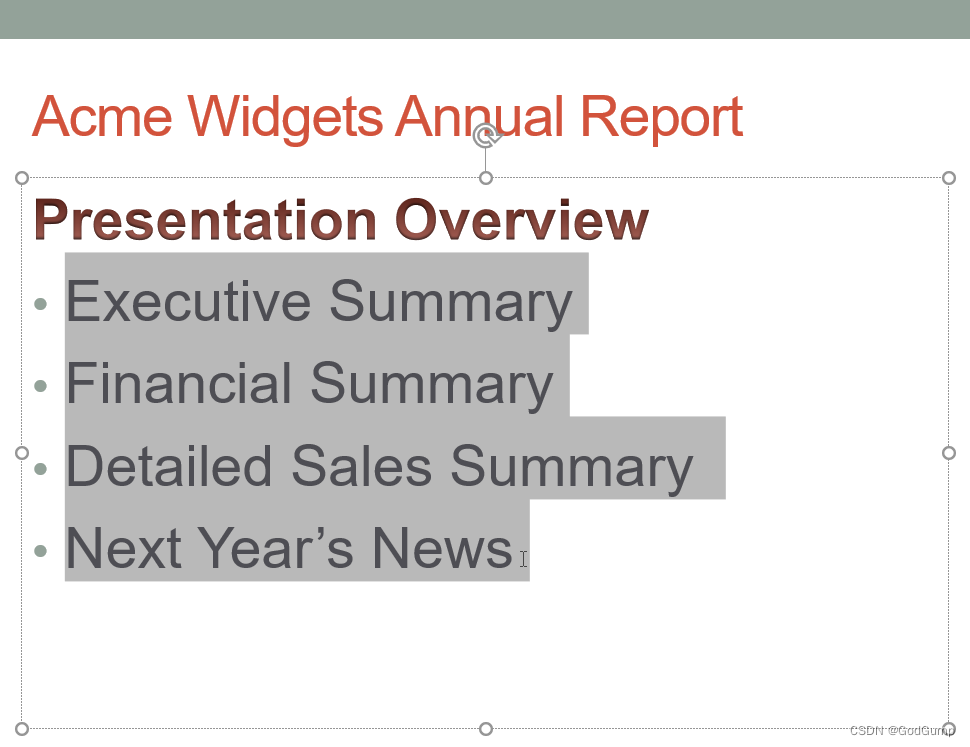
点击动画选项卡,然后点击淡入动画:
选择动画选项卡,选择淡入动画
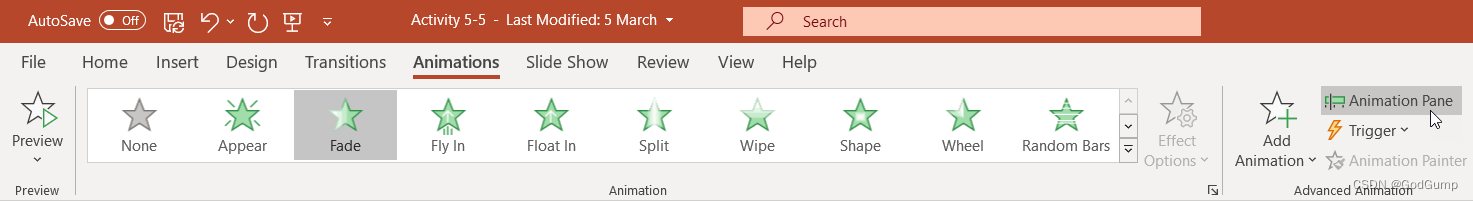
点击动画 → 动画窗格:
选择动画,点击动画窗格选项
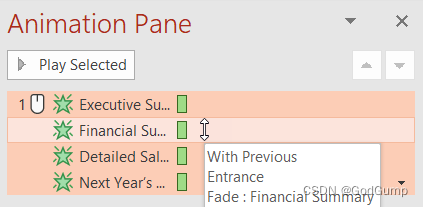
我们将使用这个任务窗格来自定义我们的动画。点击第二个项目符号的列表项:
点击第二个项目符号的列表项

点击这个项旁边的下拉箭头:
动画窗格打开,点击第二个项目符号的下拉箭头
点击在之前开始:
动画窗格打开,一个小窗口打开,选择在之前开始
你会看到表示动画效果的小方框稍微向右移动,表示它将在第一个项目符号之后出现。重复步骤六、七和八,将下面两个项目符号的动画效果都设置成顺序出现:
动画窗格打开,小方框稍微向右移动,步骤在6、7、8中重复
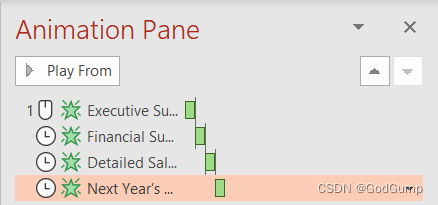
点击第一个动画效果来选择它。点击从此处开始播放来测试动画效果:
动画窗格打开,选择第一个动画效果,点击从此处开始播放
当预览完成后,关闭动画窗格:
动画窗格被关闭
选择项目符号列表。点击动画 → 动画复制工具:
打开幻灯片2,选择项目符号列表,点击动画,选择动画复制工具
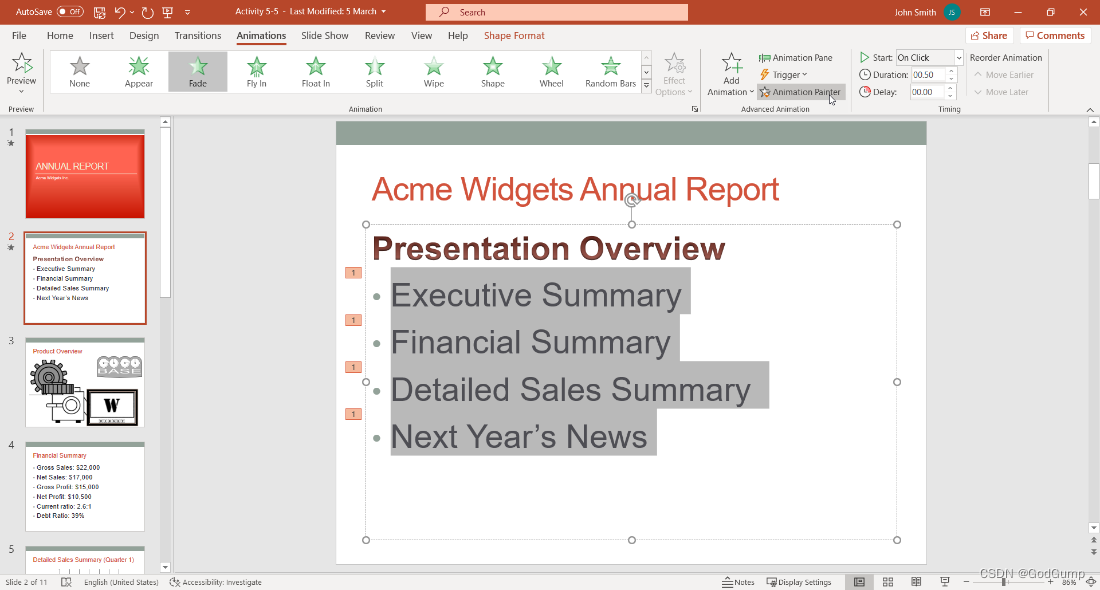
点击幻灯片4。点击包含项目符号列表的文本框:
选择幻灯片4,点击包含项目符号列表的文本框
自定义动画将立即应用并预览:
自定义动画被应用并预览
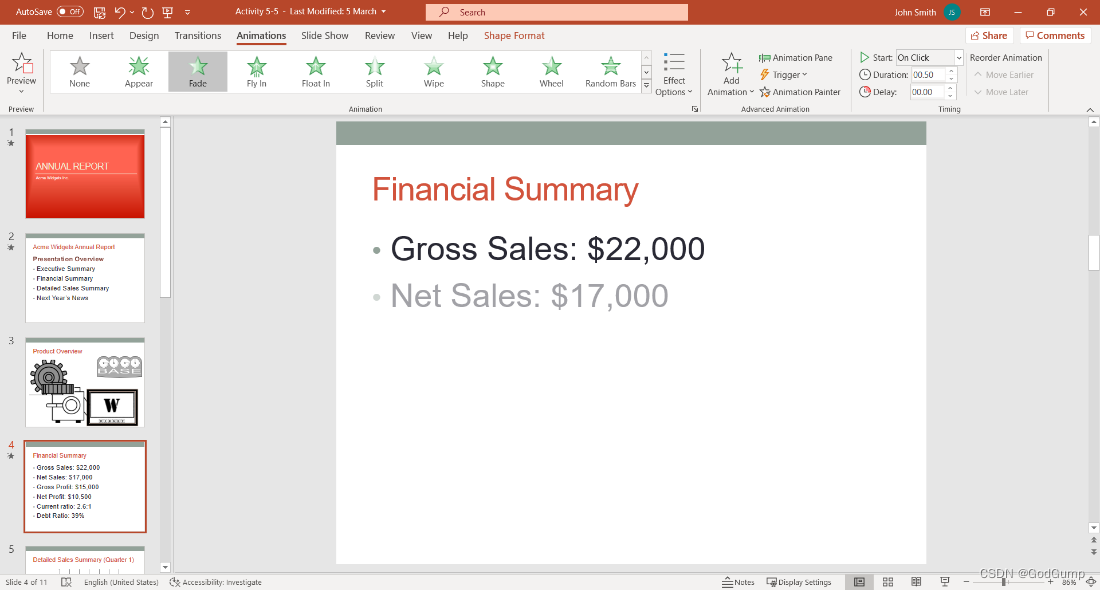
将你的演示文稿保存为“Activity 5-5 Complete”。关闭 Microsoft 365 PowerPoint,完成这个活动。
Exercise: Inserting a table from Microsoft Excel
Let’s get started!
In this activity, you will add a table from Microsoft Excel to your presentation.
- Click on the link below to open the Microsoft PowerPoint exercise document you can use to complete this exercise.
Exercise: Inserting a table from Microsoft Excel
Exercise: Inserting a table from Microsoft Excel_Excel sheet
- Click slide 4:
PowerPoint window open, slide 4 selected
- Click Insert → Object:
PowerPoint window open, Insert tab selected, Object option selected
- The Insert Object dialog box will open. Click the Create from file radio button:
Insert Object window open, Create from file radio button selected
- Now, click the Browse button to choose the file:
Insert Object window open, Browse button selected
- In the Browse dialog box, navigate to Lesson 6 of your Exercise Files. Locate and select the Activity 6-3 Excel workbook file. Click OK:
Browse window open, Activity 6-3 Excel workbook file selected, “OK” button selected
- Click OK in the Insert Object dialog box:
Insert Object window open, “OK” button selected
- The Excel worksheet will be added to the slide:
PowerPoint window open, Excel worksheet was added to the slide
- Click the bottom left-hand corner of the object and drag it outwards to increase the size as shown below:
PowerPoint window open, the worksheet was increased the size
(Notice that the red guideline will help you position the table.)
- Click the outer border of the worksheet and drag it down to the bottom of the slide to move it below the “Future Projections” title:
PowerPoint window open, the worksheet was moved below to the “Future Projections” title
- With the object still selected, click Shape Format → Align → Align Center:
PowerPoint window open, the object selected, Shape Format selected, Align selected and Align Center
- Save your presentation as Activity 6-3 Complete. Close Microsoft 365 PowerPoint to complete this activity.
练习:从Microsoft Excel插入表格
让我们开始吧!
在这个活动中,您将在演示文稿中添加来自Microsoft Excel的表格。
点击下面的链接以打开Microsoft PowerPoint练习文档,您可以在其中完成这个练习。
练习:从Microsoft Excel插入表格
练习:从Microsoft Excel插入表格_Excel工作表
点击幻灯片4:
PowerPoint窗口打开,幻灯片4被选中
点击插入 → 对象:
PowerPoint窗口打开,选择插入选项卡,选择对象选项
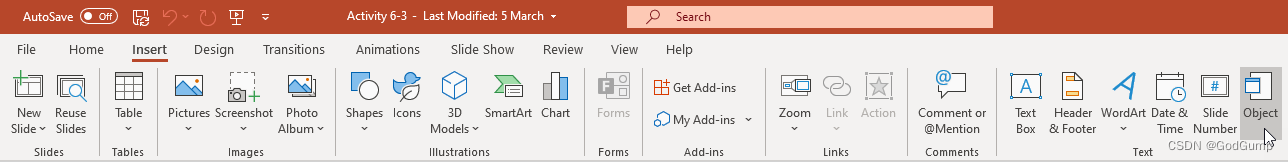
“插入对象”对话框将打开。点击“从文件创建”单选按钮:
插入对象窗口打开,选择从文件创建单选按钮
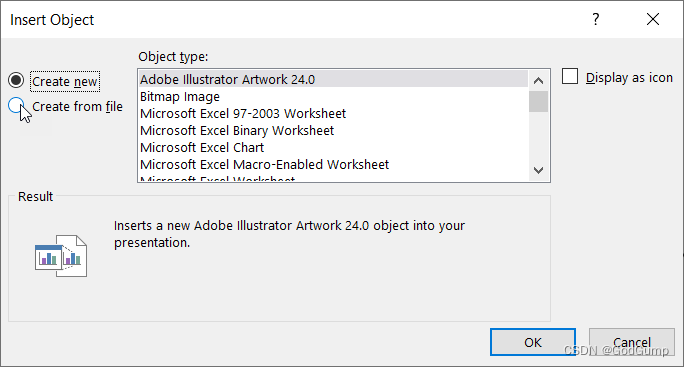
现在,点击“浏览”按钮以选择文件:
插入对象窗口打开,选择浏览按钮
在浏览对话框中,导航到您的练习文件中的第6课。找到并选择Activity 6-3 Excel工作簿文件。点击“确定”:
浏览窗口打开,选择Activity 6-3 Excel工作簿文件,点击“确定”按钮
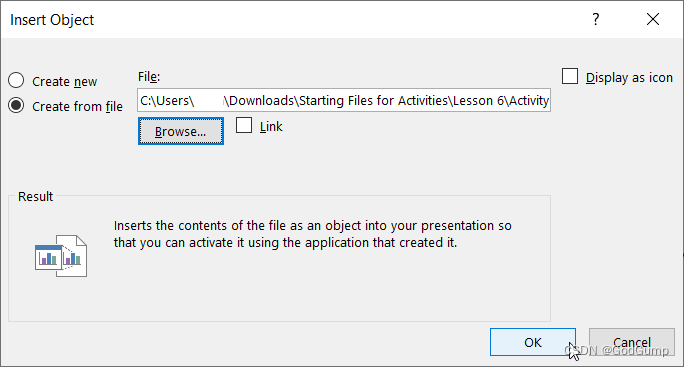
在“插入对象”对话框中点击“确定”:
插入对象窗口打开,点击“确定”按钮
Excel工作表将被添加到幻灯片上:
PowerPoint窗口打开,Excel工作表被添加到幻灯片上
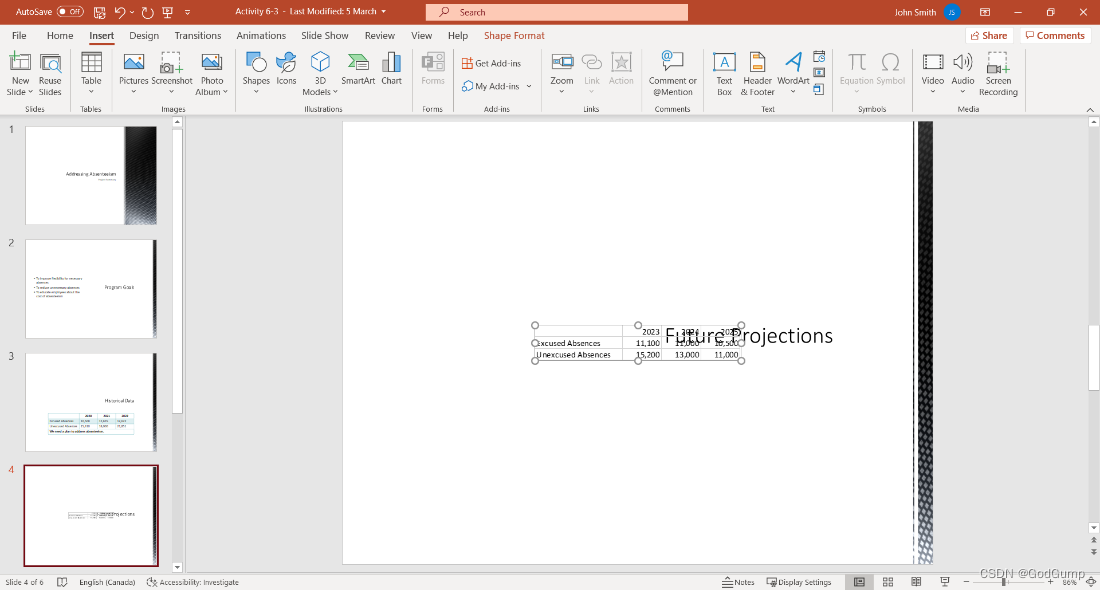
点击工作表的左下角并向外拖拽以增加其大小,如下图所示:
PowerPoint窗口打开,工作表被增大大小
(注意,红色指导线将帮助您定位表格。)
点击工作表的外边框并将其向下拖动到幻灯片的底部,放置在“未来预测”标题下方:
PowerPoint窗口打开,工作表被移动到“未来预测”标题下方
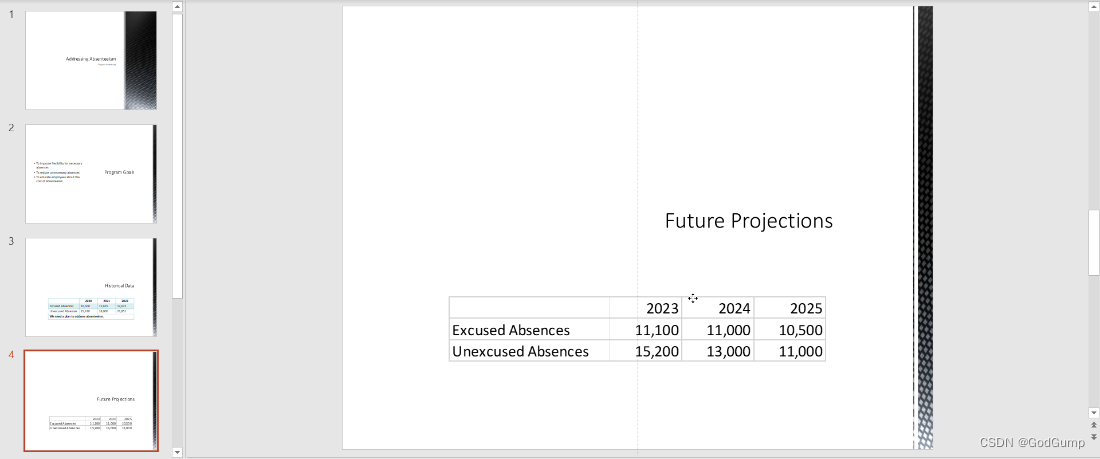
仍然选中对象,点击“形状格式” → “对齐” → “居中对齐”:
PowerPoint窗口打开,对象被选中,选择“形状格式”,选择“对齐”,选择“居中对齐”
将您的演示文稿另存为“Activity 6-3 Complete”。关闭Microsoft 365 PowerPoint以完成这个活动。
Exercise: Adding hyperlinks and action buttons
Let’s get started!
To add more interactivity to a presentation that you have been working on, you would like to add a hyperlink as well as an action button. Microsoft Word is required to complete this activity.
- Click on the link below to open the Microsoft PowerPoint exercise document you can use to complete this exercise.
Exercise: Adding Hyperlinks and Action Buttons
Exercise: Add Hyperlinks and Action Buttons_Agenda
- First, you would like to add to the first slide a hyperlink that will lead to your organization’s website. With the first slide displayed, use your cursor to select the company name:
PowerPoint window open, the slides was displayed, Company name was selected
- Click Insert → Link Insert Link:
PowerPoint window open, Insert tab selected, Insert option selected, Link and Insert Link too
- The Insert Hyperlink dialog box will now be displayed. In the Address text box, type the website address of your organization. Click OK:
Insert Hyperlink window open, the Website address was typed in the Address text box, “OK” button selected
- The selected text will now be converted into a hyperlink:
PowerPoint window open, the first slide is in the view area the text was converted into a hyperlink
- Now display slide two. Click to select the star shape that appears in the top right-hand corner:
PowerPoint window open, the slide two is displayed. A star shape was selected in the top right-hand corner of the slide
- Click Insert → Action:
PowerPoint window open, Insert tab selected, Action option selected
- The Action Settings dialog box is now displayed with the Mouse Click tab open. Click the Hyperlink to radio button:
Action Settings window open, Hyperlink to radio button was selected
- This will enable the associated drop-down menu. Click on this drop-down menu and select Other File:
Action Settings window open, the drop-down menu selected, Other File option chosen
- The Hyperlink to Other File dialog box will now be open. Use its controls to find and locate the Agenda document within your Exercise Files folder. Click to select this file and then click OK:
Hyperlink to Other File window open, Agenda document selected, “OK” button selected
- Back at the Action Settings dialog box, you will now see the full file address for the selected file inside the Hyperlink to text box. Click OK:
Action Settings window open, the full file address appears inside the Hyperlink text box “OK” button selected
- Now you should test the hyperlink and action button to make sure that they work properly. Start the slide show from the beginning. On the first slide, click the hyperlink that you added:
PowerPoint window open, the hyperlink was selected from the first slide
- Your default browser will then open to display the website destination that was directed by the hyperlink:
The Default browser opened the website destination that was directed by the hyperlink
- Close the browser to return to the slide show. Advance to slide two and click the star shape that is near the upper right-hand corner of the slide:
The PowerPoint window open, slide two was selected and the star shape was selected
- The Agenda file will now be open in Microsoft Word:
The agenda file opened the Microsoft Word window
- Close the Microsoft Word window and exit the slide show. Save the current presentation as Activity 6-4 Complete.
练习:添加超链接和操作按钮
让我们开始吧!
为了在您正在工作的演示文稿中添加更多的互动性,您希望添加一个超链接和一个操作按钮。完成这个任务需要使用 Microsoft Word。
点击下面的链接,打开 Microsoft PowerPoint 练习文档,您可以用它来完成这个练习。
练习:添加超链接和操作按钮
首先,在第一张幻灯片上,您想添加一个超链接,将其链接到您的组织网站。在第一张幻灯片上显示时,使用鼠标光标选择公司名称:
打开 PowerPoint 窗口,幻灯片显示,公司名称被选择。
点击“插入”→“链接”→“插入链接”:
打开 PowerPoint 窗口,选择“插入”选项卡,选择“插入”选项,点击“链接”和“插入链接”。
现在将显示“插入超链接”对话框。在地址文本框中输入您组织的网站地址。点击“确定”:
打开“插入超链接”窗口,输入网站地址到地址文本框,点击“确定”按钮。
选择的文本现在将转换为超链接:
打开 PowerPoint 窗口,第一张幻灯片在视图区域内,文本被转换为超链接。
现在显示第二张幻灯片。点击选择位于右上角的星形图案:
打开 PowerPoint 窗口,显示第二张幻灯片,选择位于幻灯片右上角的星形图案。
点击“插入”→“操作”:
打开 PowerPoint 窗口,选择“插入”选项卡,选择“操作”选项。
现在将显示“操作设置”对话框,并且鼠标单击选项卡处于打开状态。点击“超链接到”单选按钮:
打开“操作设置”窗口,选择“超链接到”单选按钮。
这将启用关联的下拉菜单。点击此下拉菜单,并选择“其他文件”:
打开“操作设置”窗口,选择下拉菜单,选择“其他文件”选项。
现在将显示“超链接到其他文件”对话框。使用其控件在您的练习文件夹中找到并定位议程文档。点击选择此文件,然后点击“确定”:
打开“超链接到其他文件”窗口,选择议程文档,点击“确定”按钮。
现在在“操作设置”对话框中,您会看到所选文件的完整文件地址显示在“超链接到”文本框内。点击“确定”:
PowerPoint窗口打开,“操作设置”对话框显示,完整文件地址显示在“超链接到”文本框内,点击“确定”按钮。
现在您应该测试一下超链接和动作按钮,确保它们正常工作。从第一张幻灯片开始播放幻灯片演示。在第一张幻灯片上,点击您添加的超链接:
PowerPoint窗口打开,从第一张幻灯片上选择了超链接。

然后,您的默认浏览器将打开显示由超链接指向的网站目标:
默认浏览器打开了由超链接指向的网站目标。
关闭浏览器以返回到幻灯片演示。前往第二张幻灯片,并点击位于幻灯片右上角附近的星形图标:
PowerPoint窗口打开,选择了第二张幻灯片,并点击了星形图标。
现在,Agenda文件将在Microsoft Word中打开:
Agenda文件在Microsoft Word中打开。
关闭Microsoft Word窗口并退出幻灯片演示。将当前演示保存为“Activity 6-4 Complete”。