Wireshark Lab: TCP v7.0
1
- What is the IP address and TCP port number used by the client computer (source) that is transferring the file to gaia.cs.umass.edu?
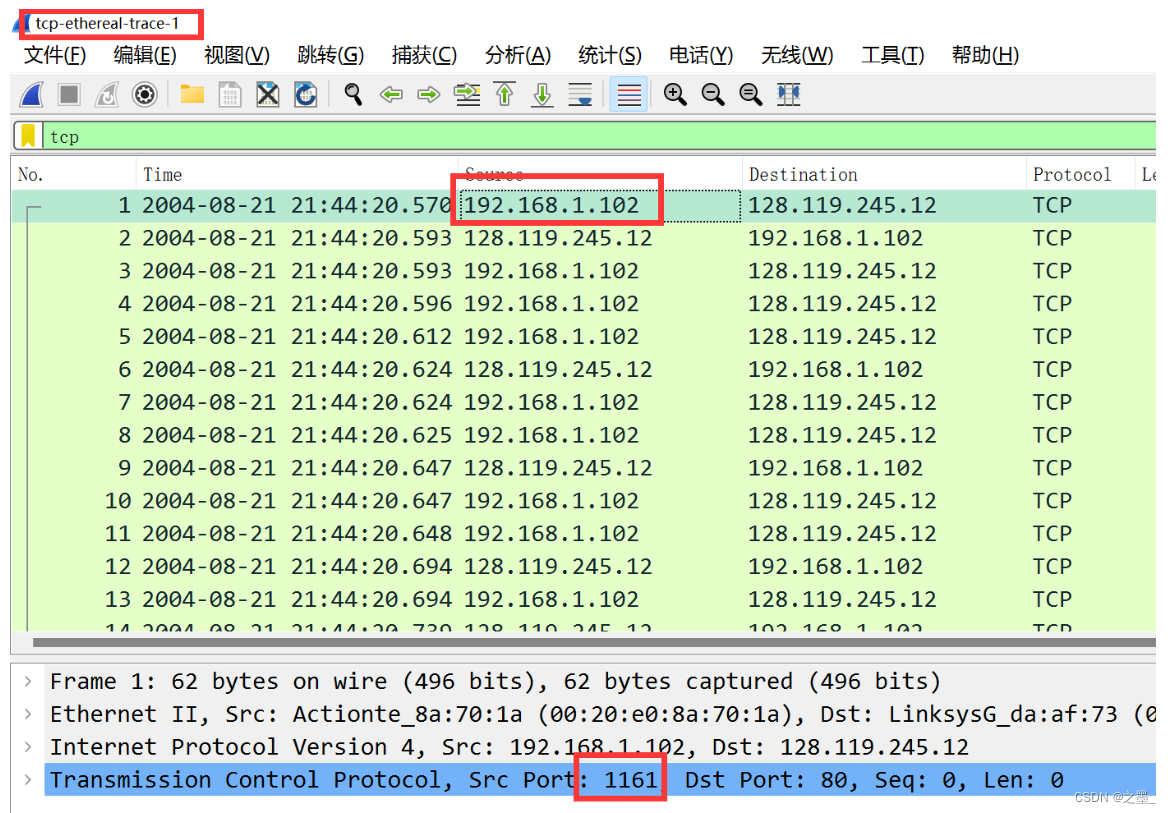
根据数据包中的tcp-ethereal-trace-1,其源IP地址为 192.168.1.102 192.168.1.102 192.168.1.102,端口号为 1162 1162 1162。
2
- What is the IP address of gaia.cs.umass.edu? On what port number is it sending and receiving TCP segments for this connection?
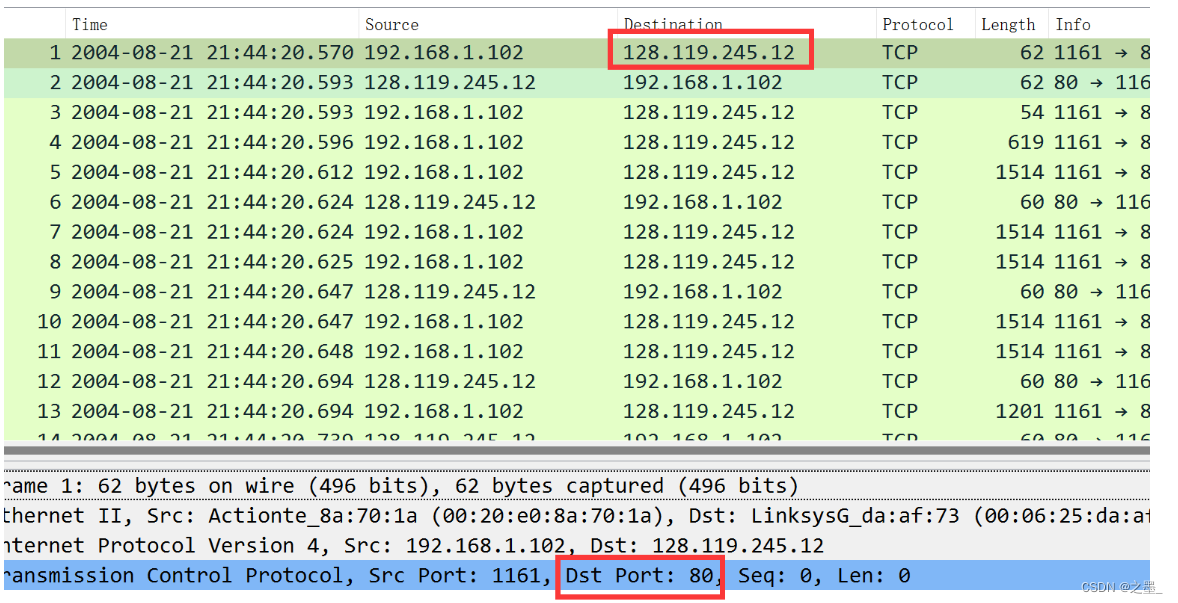
gaia.cs.umass.edu的IP地址为 128.119.245.12 128.119.245.12 128.119.245.12,端口号为 80 80 80。
3
-
What is the IP address and TCP port number used by your client computer (source) to transfer the file to gaia.cs.umass.edu?
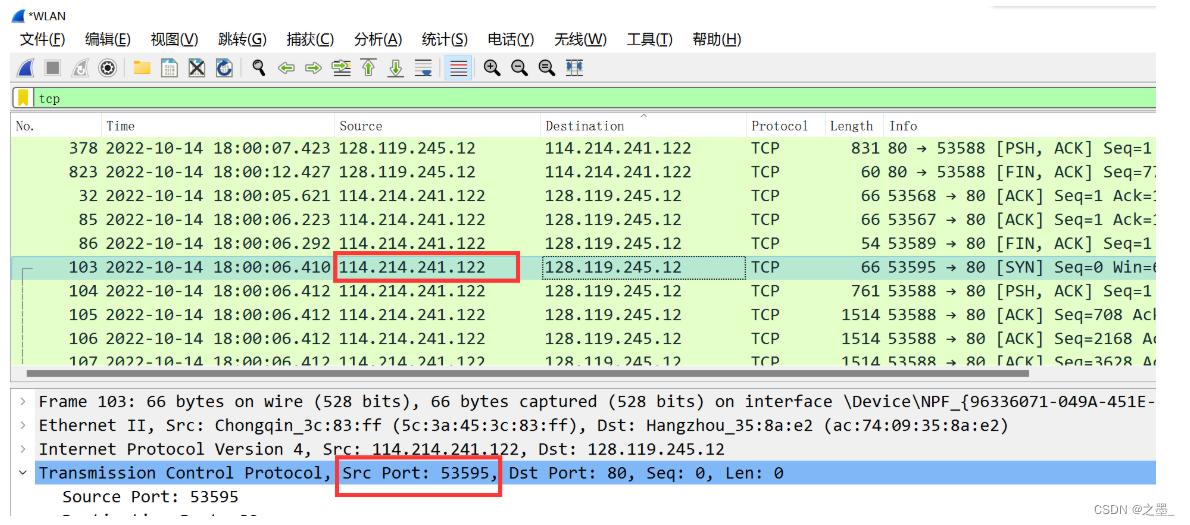
我的客户端IP地址为 114.214.241.122 114.214.241.122 114.214.241.122,端口号为 53595 53595 53595。
4
- What is the sequence number of the TCP SYN segment that is used to initiate the TCP connection between the client computer and gaia.cs.umass.edu? What is it in the segment that identifies the segment as a SYN segment?
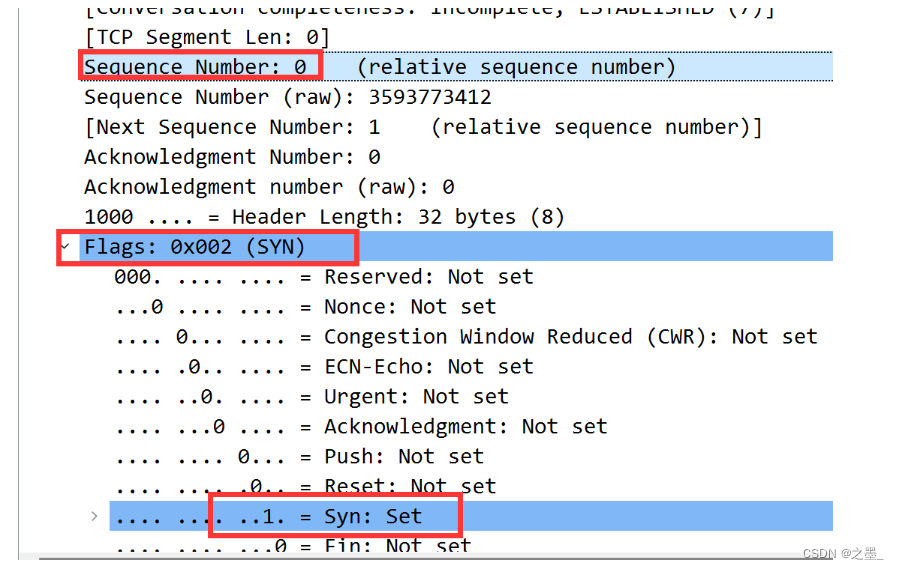
sequence number为 0 0 0,通过设置Flags为 0 0 0x 002 002 002,即Syn位设为 1 1 1。
5
- What is the sequence number of the SYNACK segment sent by gaia.cs.umass.edu to the client computer in reply to the SYN? What is the value of the Acknowledgement field in the SYNACK segment? How did gaia.cs.umass.edu determine that value? What is it in the segment that identifies the segment as a SYNACK segment?
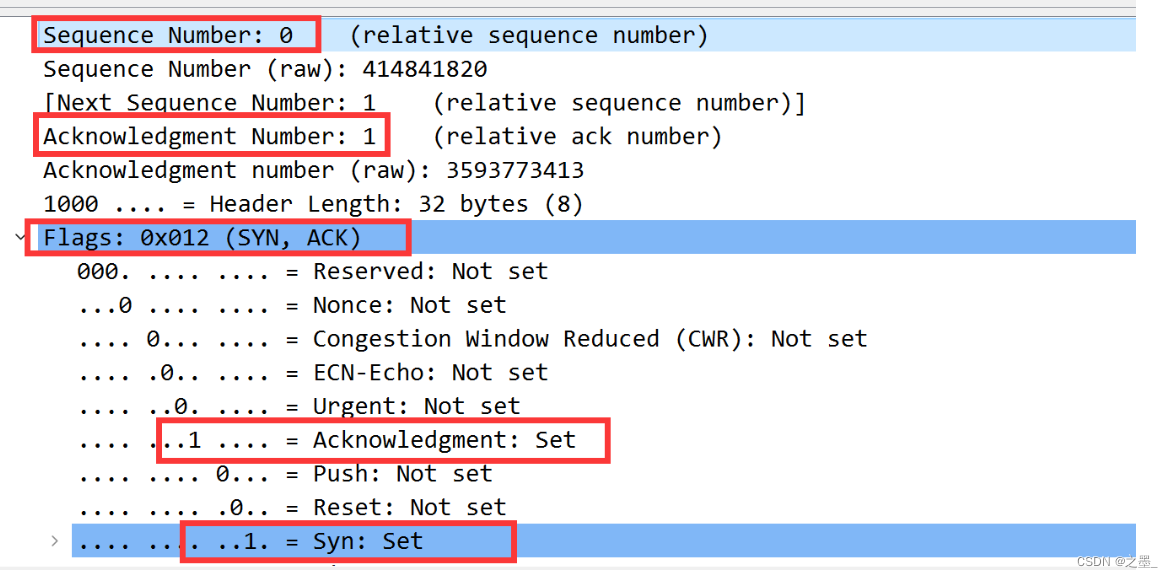
sequence number为 0 0 0,Acknowledgement number为 1 1 1,通过设置Flags为 0 0 0x 012 012 012,即Syn及Acknowledgment位均设为 1 1 1。
6
- What is the sequence number of the TCP segment containing the HTTP POST command? Note that in order to find the POS command, you’ll need to dig into the packet content field at the bottom of the Wireshark window, looking for a segment with a “POST” within its DATA field.
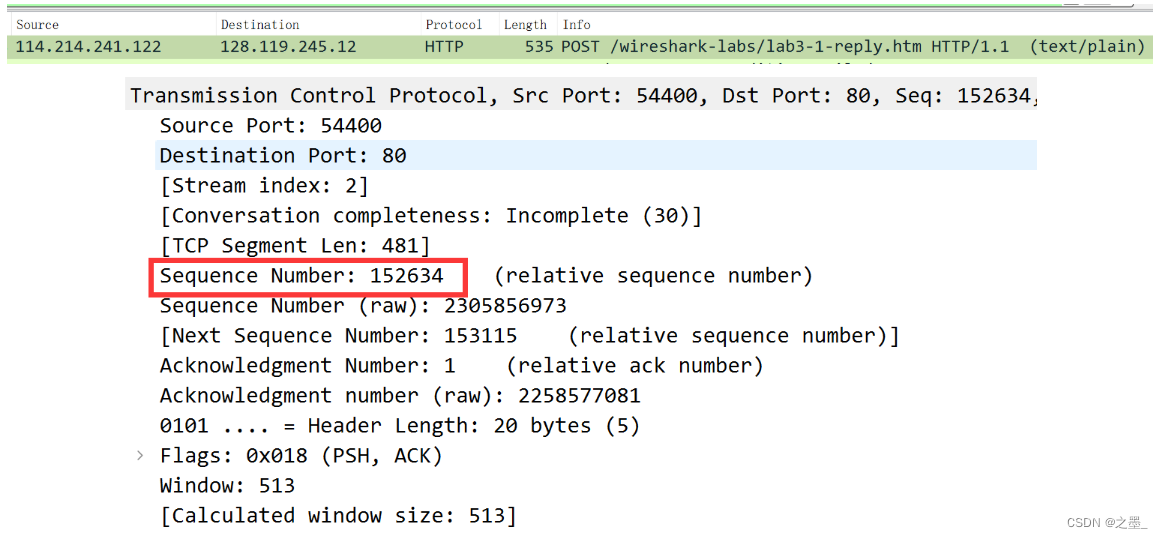
sequence number为 152634 152634 152634。
7
-
Consider the TCP segment containing the HTTP POST as the first segment in the TCP connection.
What are the sequence numbers of the first six segments in the TCP connection (including the segment containing the HTTP POST)?

序号分别为 1 、 566 、 2026 、 3486 、 4946 、 6406 1、566、2026、3486、4946、6406 1、566、2026、3486、4946、6406。
At what time was each segment sent?

发送时间分别是 0.596858 、 0.612118 、 0.624407 、 0.625071 、 0.647786 、 0.648538 0.596858、0.612118、0.624407、0.625071、0.647786、0.648538 0.596858、0.612118、0.624407、0.625071、0.647786、0.648538.
When was the ACK for each segment received?

接收时间分别是 0.624318 、 0.647675 、 0.694466 、 0.739499 、 0.787680 、 0.838183 0.624318、0.647675、0.694466、0.739499、0.787680、0.838183 0.624318、0.647675、0.694466、0.739499、0.787680、0.838183.
Given the difference between when each TCP segment was sent, and when its acknowledgement was received, what is the RTT value for each of the six segments?
RTT分别为 0.027460 、 0.035557 、 0.070059 、 0.114428 、 0.139894 、 0.189645 0.027460、0.035557 、0.070059、0.114428、0.1 39894、0.1 89645 0.027460、0.035557、0.070059、0.114428、0.139894、0.189645。
What is the EstimatedRTT value (see Section 3.5.3, page 242 in text) after the receipt of each ACK?
根据公式 E s t i m a t e d R T T = ( 1 − a ) × E s t i m a t e d R T T + a × S a m p l e R T T , a = 0.125 EstimatedRTT = (1 - a) × EstimatedRTT + a × SampleRTT,a=0.125 EstimatedRTT=(1−a)×EstimatedRTT+a×SampleRTT,a=0.125
EstimatedRTT分别为
0.027460 0.028472125 = 0.875 ∗ 0.027460 + 0.125 ∗ 0.035557 0.033670484 = 0.875 ∗ 0.028472125 + 0.125 ∗ 0.070059 0.043765174 = 0.875 ∗ 0.033670484 + 0.125 ∗ 0.114428 0.055781277 = 0.875 ∗ 0.043765174 + 0.125 ∗ 0.139894 0.072514242 = 0.875 ∗ 0.055781277 + 0.125 ∗ 0.189645 \begin{aligned} &0.027460\\ &0.028472125=0.875 * 0.027460 + 0.125 * 0.035557\\ &0.033670484=0.875 * 0.028472125 + 0.125 * 0.070059 \\ &0.043765174=0.875 * 0.033670484 + 0.125 * 0.114428\\ &0.055781277=0.875 * 0.043765174 + 0.125 * 0.139894\\ &0.072514242=0.875 * 0.055781277 + 0.125 * 0.189645 \end{aligned} 0.0274600.028472125=0.875∗0.027460+0.125∗0.0355570.033670484=0.875∗0.028472125+0.125∗0.0700590.043765174=0.875∗0.033670484+0.125∗0.1144280.055781277=0.875∗0.043765174+0.125∗0.1398940.072514242=0.875∗0.055781277+0.125∗0.189645
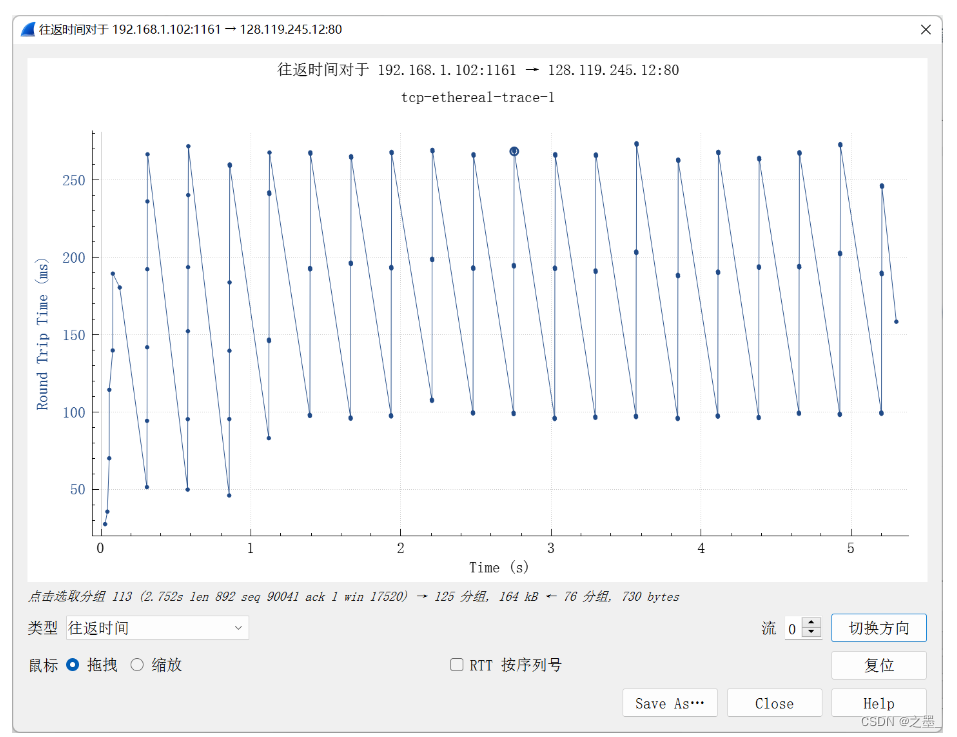
Assume that the value of the EstimatedRTT is equal to the measured RTT for the first segment, and then is computed using the EstimatedRTT equation on page 242 for all subsequent segments.
Note: Wireshark has a nice feature that allows you to plot the RTT for each of the TCP segments sent. Select a TCP segment in the “listing of captured packets” window that is being sent from the client to the gaia.cs.umass.edu server. Then select: Statistics->TCP Stream Graph->Round Trip Time Graph.
8
- What is the length of each of the first six TCP segments?

长度分别为 565 、 1460 、 1460 、 1460 、 1460 、 1460 565、1460、1460、1460、1460、1460 565、1460、1460、1460、1460、1460。
9
- What is the minimum amount of available buffer space advertised at the received for the entire trace? Does the lack of receiver buffer space ever throttle the sender?
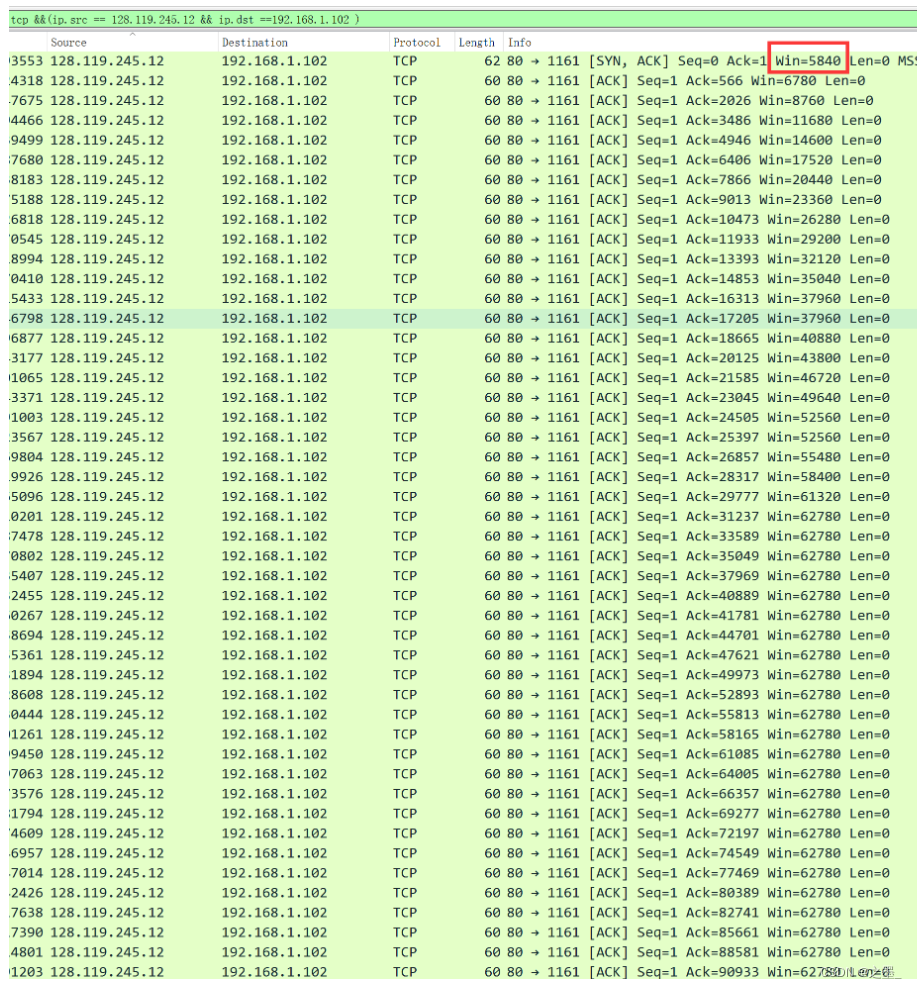
最小为 5840 5840 5840,后随时间呈增大趋势,缓存空间充足,不会使发送方受限制。
10
- Are there any retransmitted segments in the trace file? What did you check for (in the trace) in order to answer this question?
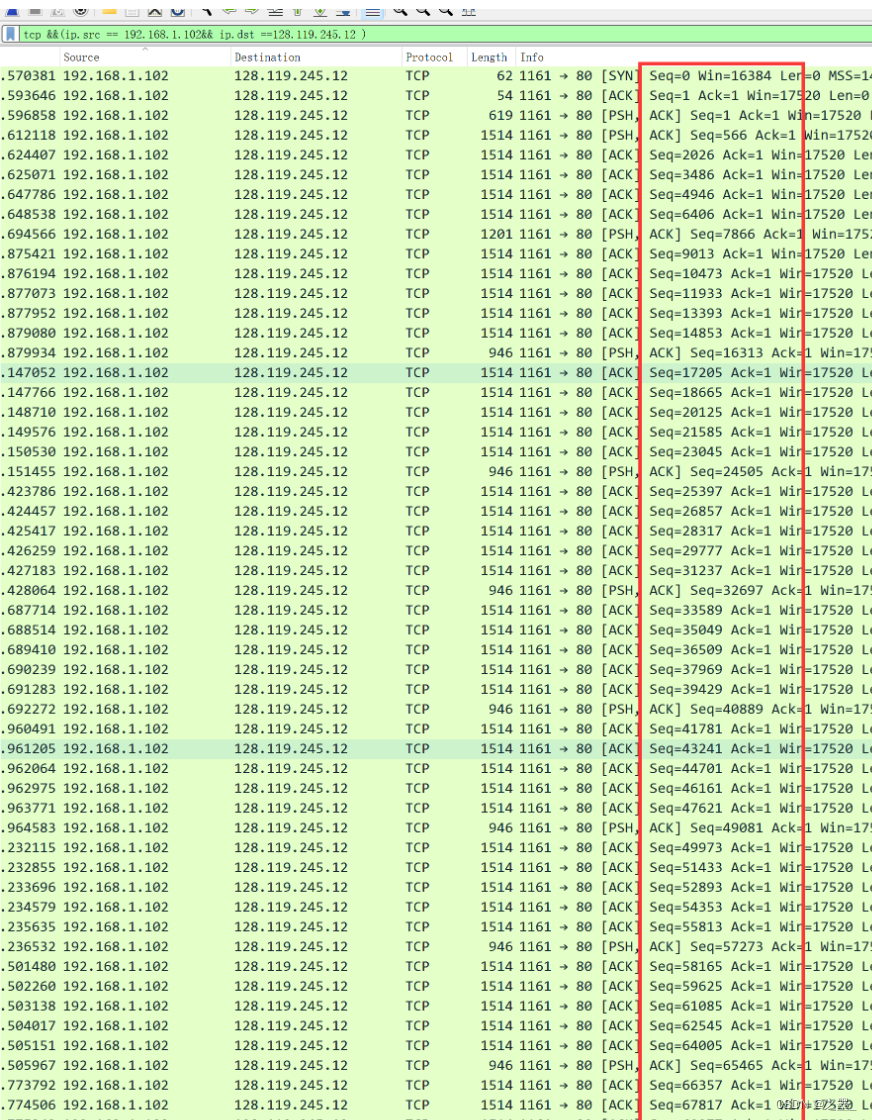
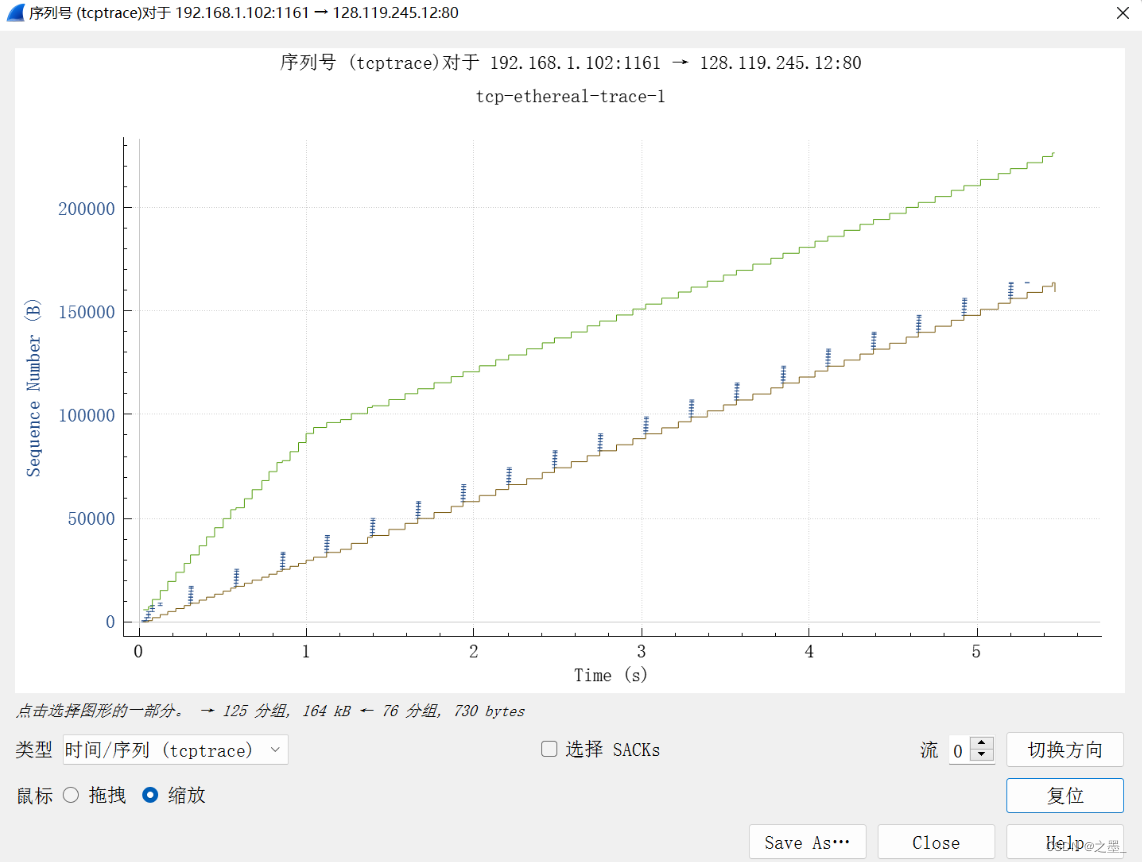
没有出现重传的分组,因为序列号一直是增大的,并且没有出现重复的序列号。
11
- How much data does the receiver typically acknowledge in an ACK? Can you identify cases where the receiver is ACKing every other received segment (see Table 3.2 on page 250 in the text).
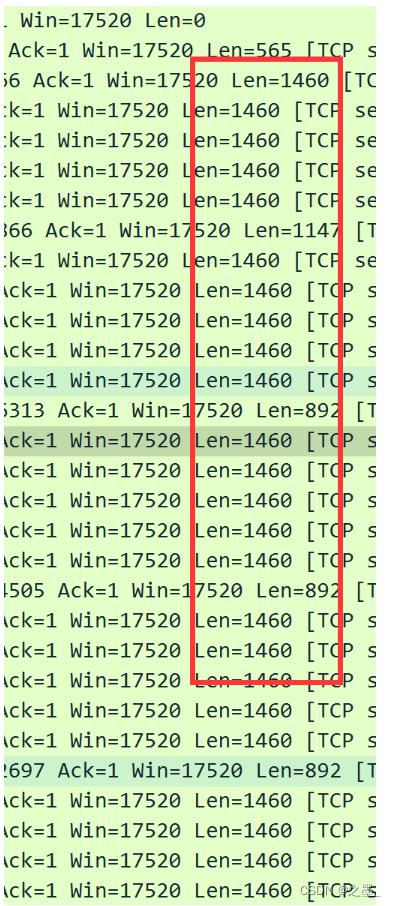
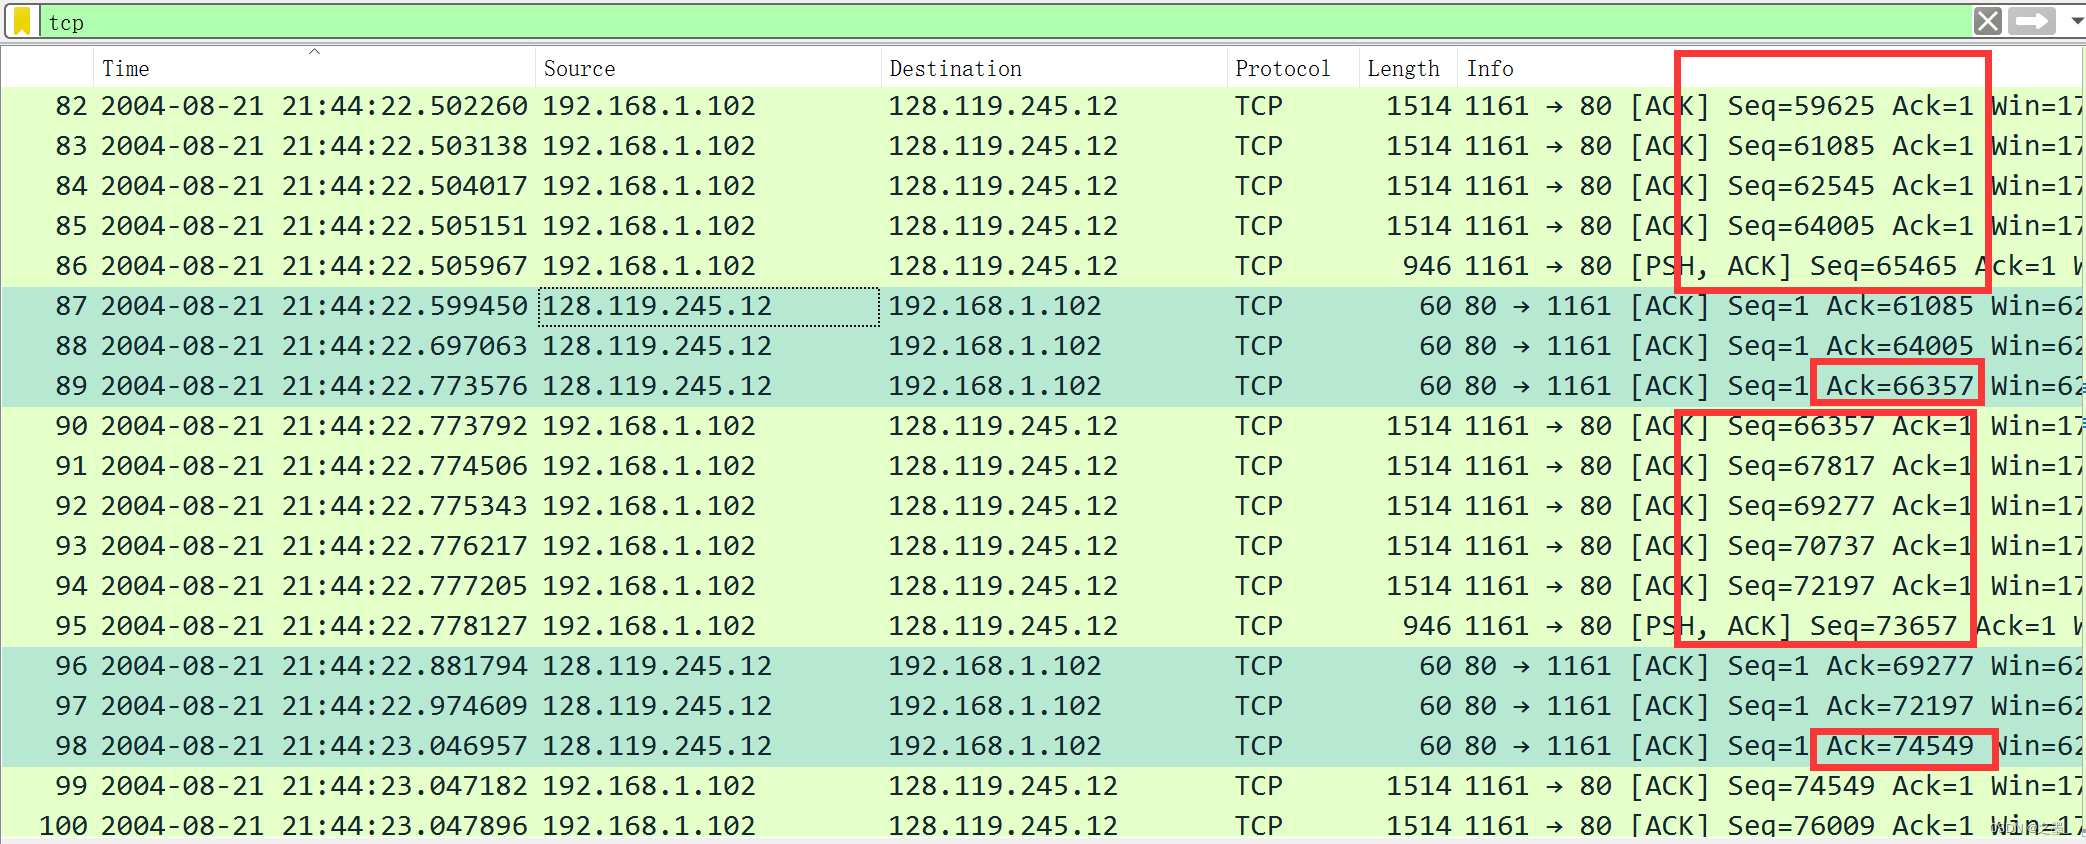
大部分都是 1460 1460 1460bytes,比如:第 89 89 89个报文是对第 86 86 86个报文之前的累积确认,第 98 98 98个报文是对第 95 95 95个报文及以前的累积确认。
12
- What is the throughput (bytes transferred per unit time) for the TCP connection? Explain how you calculated this value.


总耗时为最后一个数据包发送时间减去第一个数据包发送时间
吞吐量大约为 164091 ∗ 8 26.221522 − 20.596858 ≈ 233387.81 b p s \cfrac{164091*8}{26.221522-20.596858}≈233387.81bps 26.221522−20.596858164091∗8≈233387.81bps
13
-
Use the Time-Sequence-Graph(Stevens) plotting tool to view the sequence number versus time plot of segments being sent from the client to the gaia.cs.umass.edu server. Can you identify where TCP’s slowstart phase begins and ends, and where congestion avoidance takes over? Comment on ways in which the measured data differs from the idealized behavior of TCP that we’ve studied in the text.
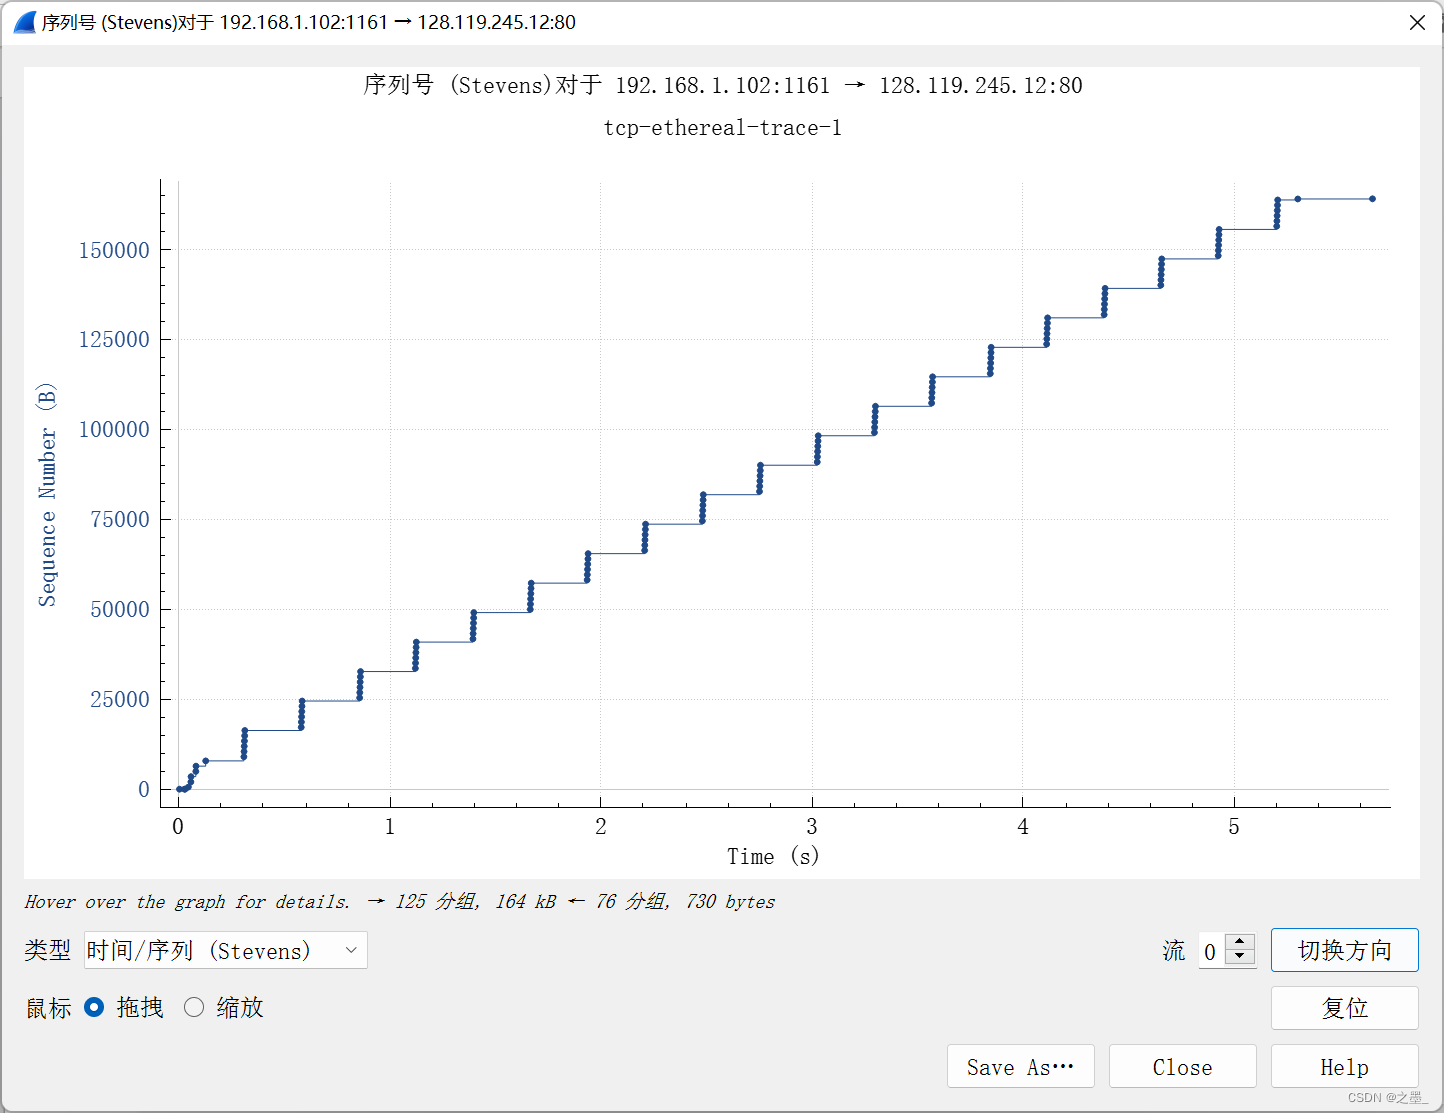
慢启动从发出了HTTP POST报文段后开始,但从图中并不能看出慢启动什么时候结束,拥塞避免是什么时候开始的TCP 采用慢启动的目的是进行拥塞控制,但是在实际的网络通信中,对于一些数据量较小的小文件,在网络畅通的情况下发送非常快,甚至可能在慢启动结束之前就已经发送完毕。而这种情况下,采用慢启动方式反而来制约了文件的快速发送,从而影响通信的效率。
14
- Answer each of two questions above for the trace that you have gathered when you transferred a file from your computer to gaia.cs.umass.edu.


吞吐量大约为 153029 ∗ 8 3.541317 − 2.495695 ≈ 1.171 M b p s \cfrac{153029*8}{3.541317-2.495695}≈1.171Mbps 3.541317−2.495695153029∗8≈1.171Mbps
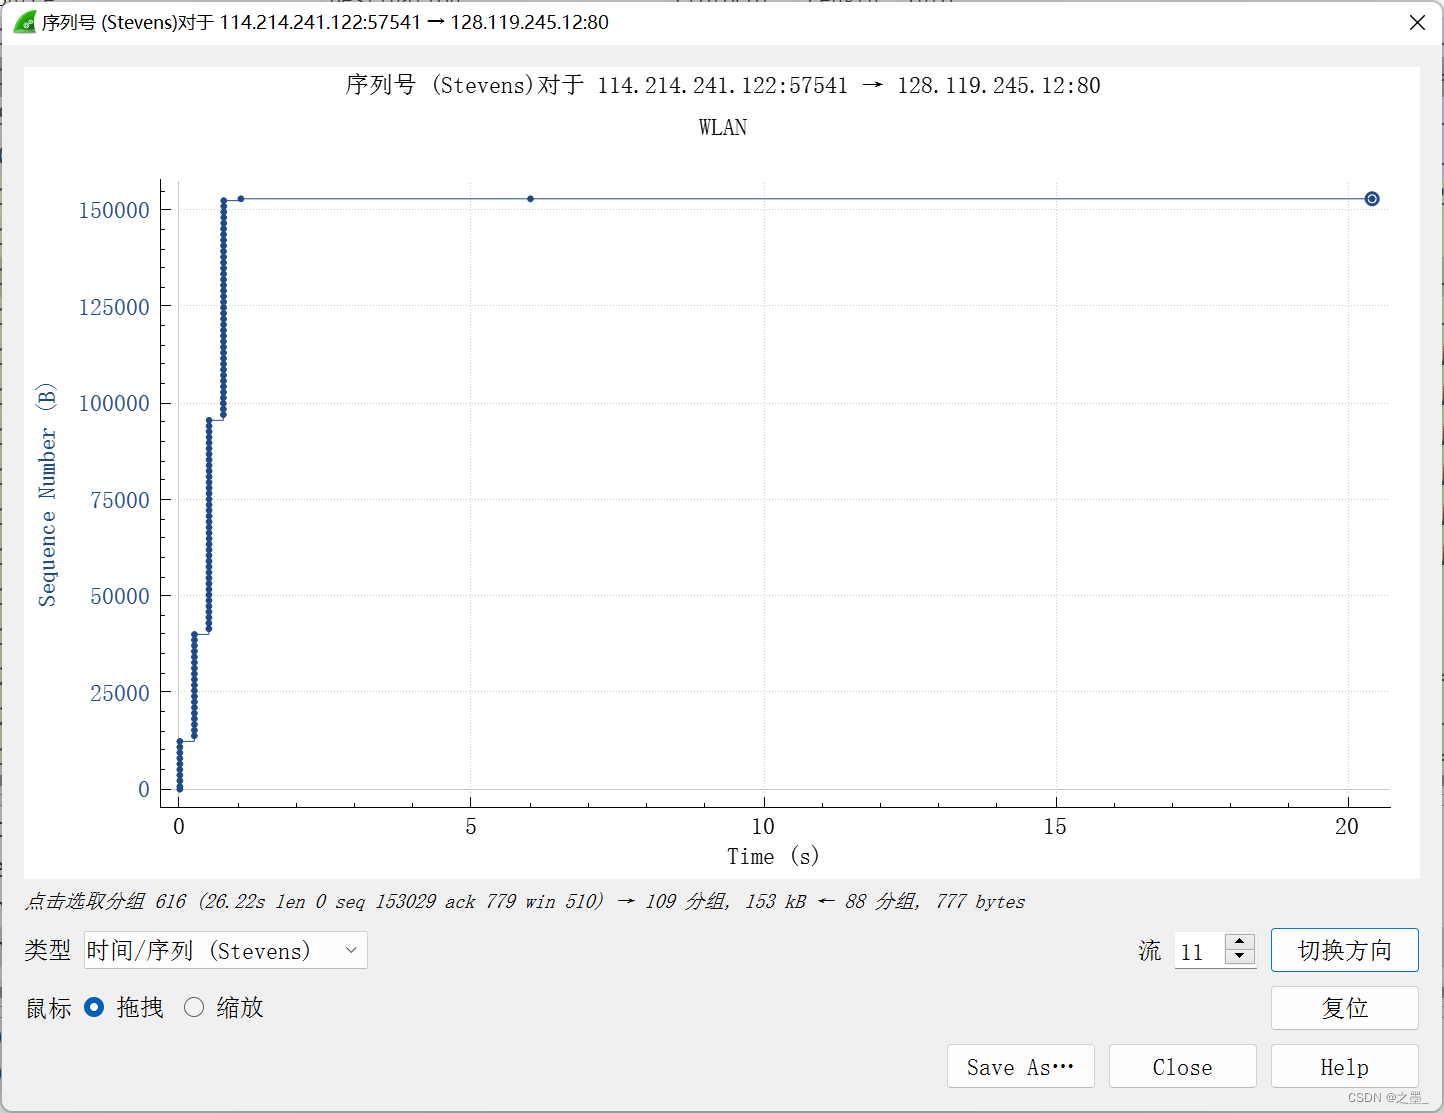
从最开始时刻是慢启动开始的时间,但无法看出慢启动结束和拥塞避免开始的情况。