相关资料
- prometheus文档:https://prometheus.io/
- grafana文档:https://grafana.com/
- grafana github: https://github.com/grafana/grafana
- Pyhton客户端https://pypi.org/project/prometheus-client/
1、使用Python提供数据源
安装依赖
pip install prometheus-client
基于flask服务代码示例
随机返回一些数值
# -*- coding: utf-8 -*-
"""
@File    : demo.py
@Date    : 2023-06-30
"""

import random
import prometheus_client
from flask import Flask, Response
from prometheus_client import Gauge
from prometheus_client.core import CollectorRegistry

app = Flask(__name__)


@app.get('/metrics')
def metrics():
    """
    prometheus metrics接口
    :return:
    """
    registry = CollectorRegistry(auto_describe=False)

    gauge = Gauge(
        name="flask_app",
        documentation="this is a flask app data",
        labelnames=["label"],
        registry=registry)

    rows = [
        {


            'label': '张飞',
            'value': random.randint(10, 20)
        },
        {


            'label': '赵云',
            'value': random.randint(10, 20)
        },
        {


            'label': '刘备',
            'value': random.randint(10, 20)
        }
    ]

    for row in rows:
        gauge.labels(row['label']).set(row['value'])

    return Response(prometheus_client.generate_latest(registry), mimetype='text/plain')


if __name__ == '__main__':
    app.run(host='0.0.0.0', port=8000)
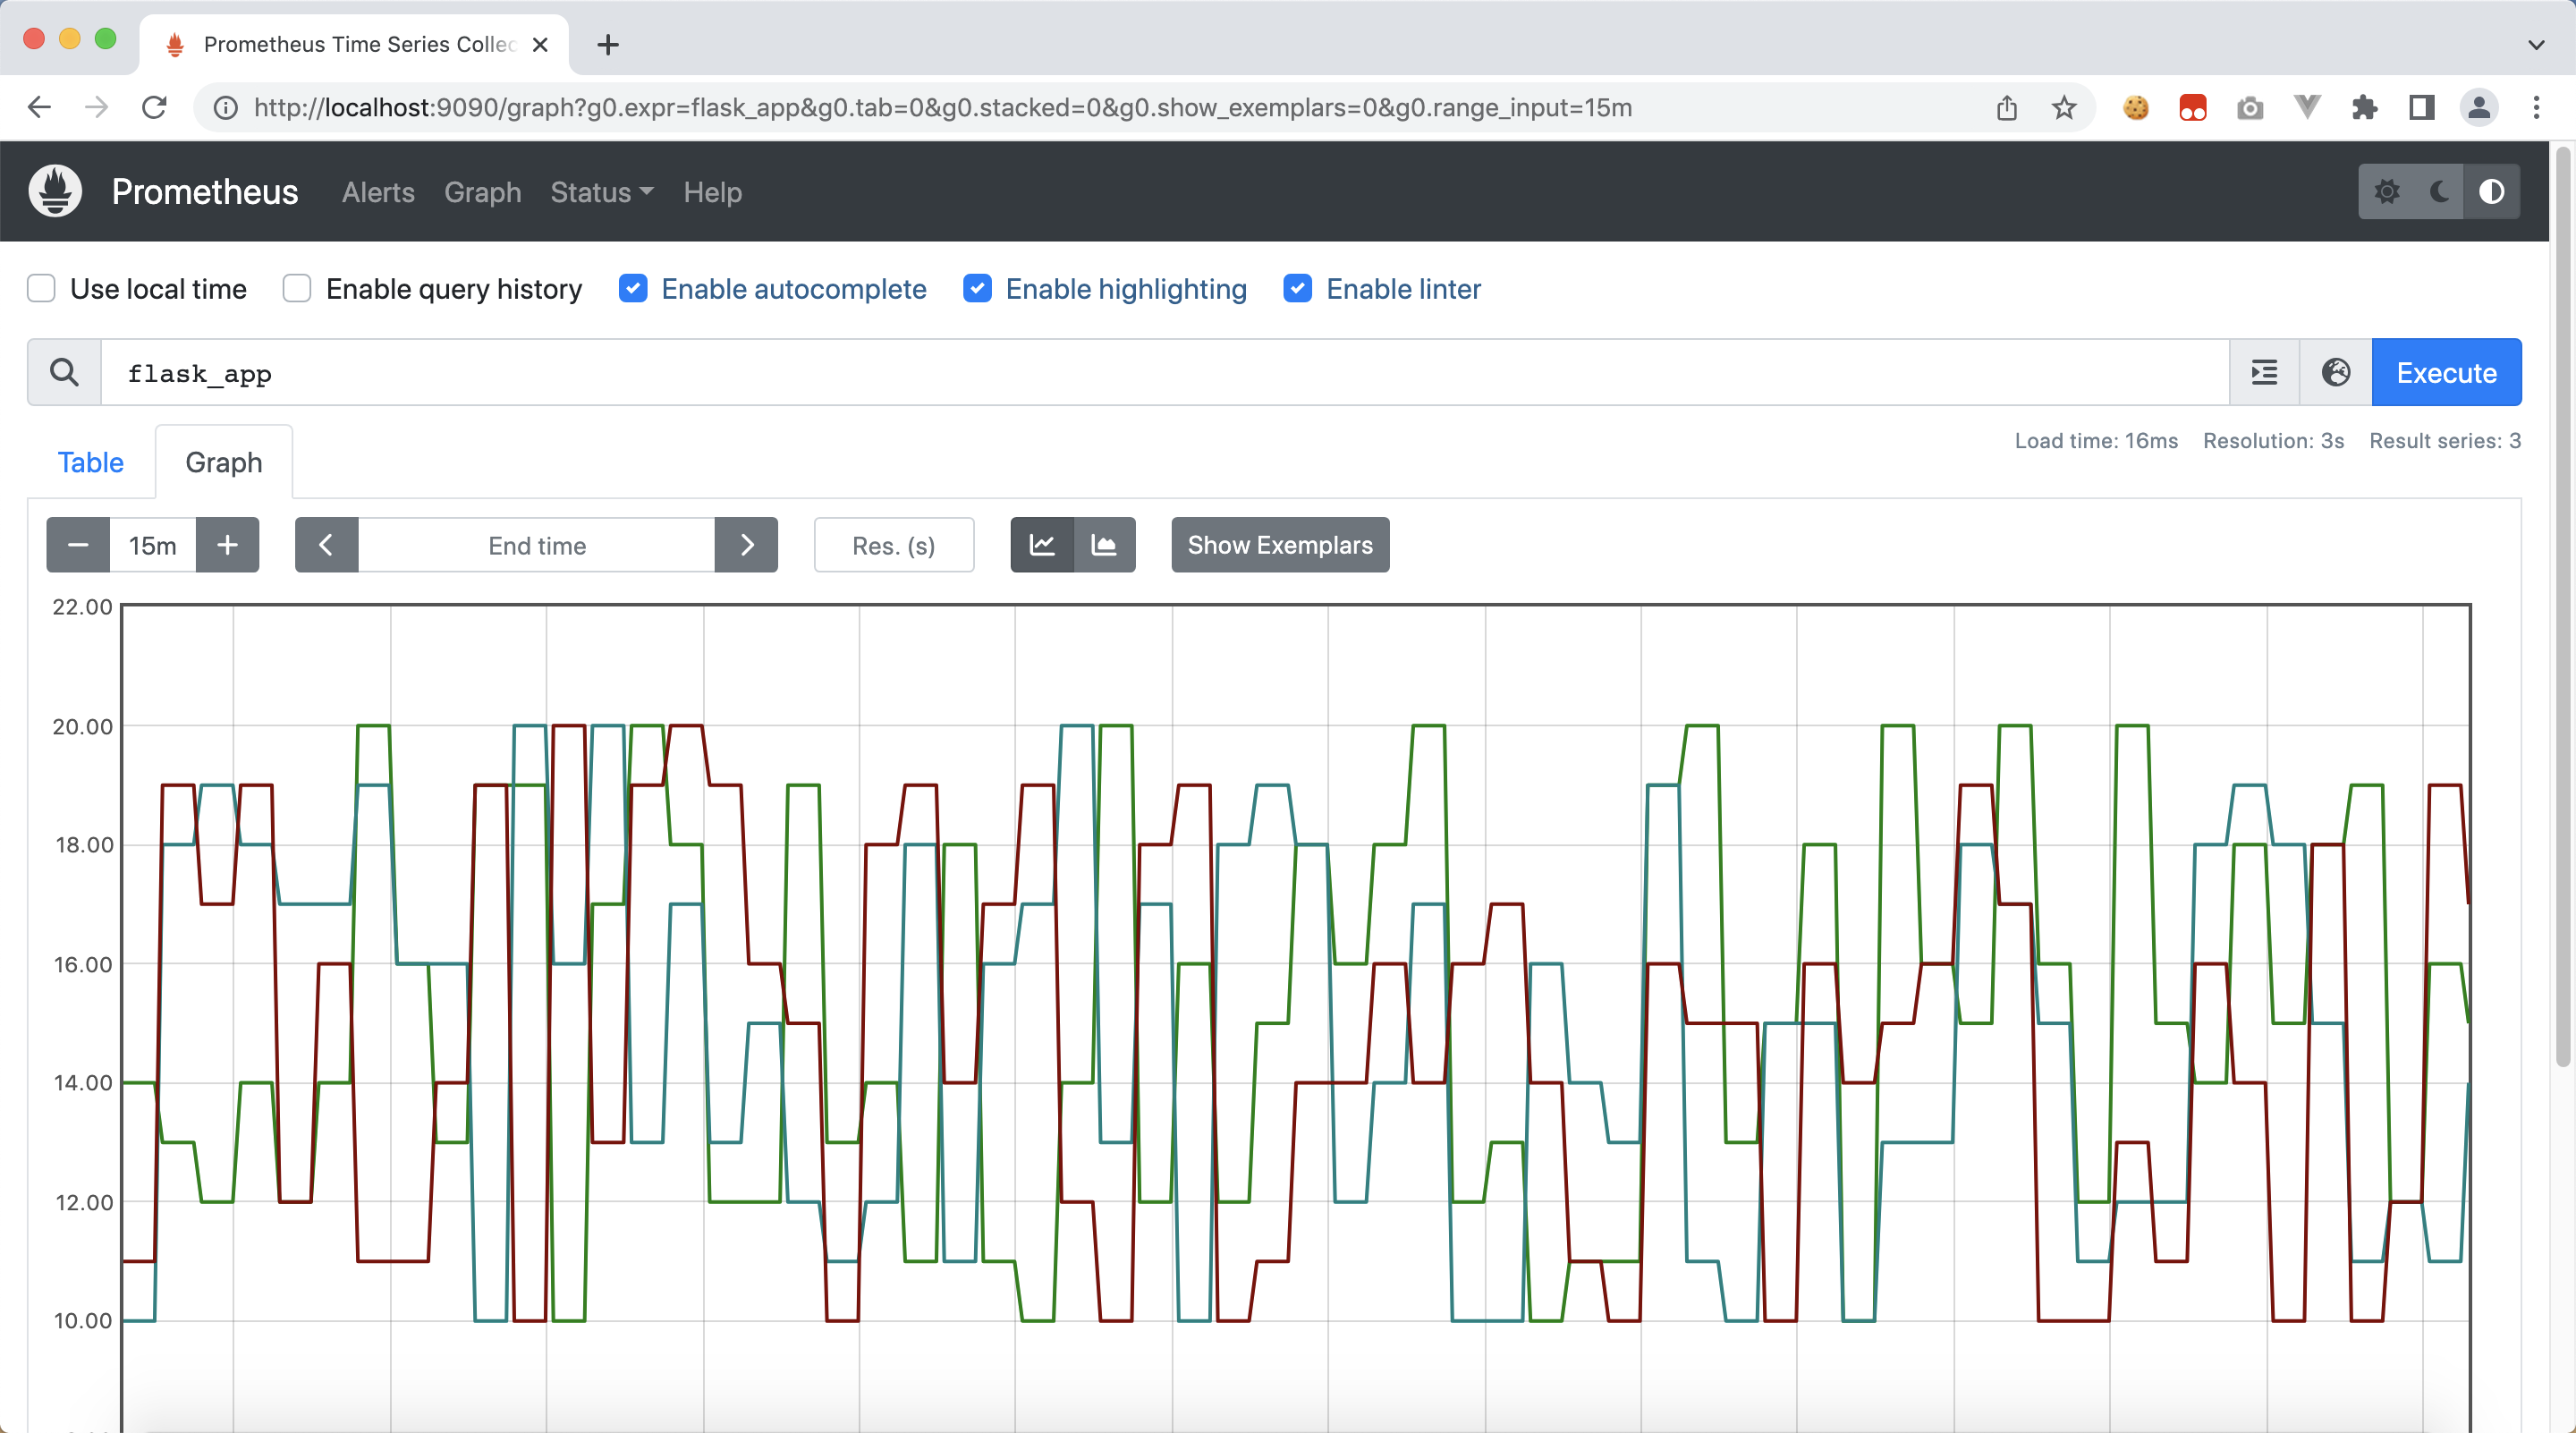
2、启动 prometheus
From metrics to insight Power your metrics and alerting with the leading open-source monitoring solution.
译文:从度量到洞察力,通过领先的开源监控解决方案。
配置文件 prometheus.yml
# my global config
global:
  scrape_interval: 15s # Set the scrape interval to every 15 seconds. Default is every 1 minute.
  evaluation_interval: 15s # Evaluate rules every 15 seconds. The default is every 1 minute.
  # scrape_timeout is set to the global default (10s).

# Alertmanager configuration
alerting:
  alertmanagers:
    - static_configs:
        - targets:
          # - alertmanager:9093

# Load rules once and periodically evaluate them according to the global 'evaluation_interval'.
rule_files:
  # - "first_rules.yml"
  # - "second_rules.yml"

# A scrape configuration containing exactly one endpoint to scrape:
# Here it's Prometheus itself.
scrape_configs:
  # The job name is added as a label `job=<job_name>` to any timeseries scraped from this config.
  - job_name: "prometheus"

    # metrics_path defaults to '/metrics'
    # scheme defaults to 'http'.

    static_configs:
      - targets: ["localhost:9090"]
      - targets: ["192.168.0.101:8000"]
注意:如果是docker方式启动,ip地址需要配置局域网ip,不能使用127.0.0.1
使用docker方式启动 prometheus
扫描二维码关注公众号,回复:
15490738 查看本文章

docker run \
-p 9090:9090 \
-v $(pwd)/prometheus.yml:/etc/prometheus/prometheus.yml \
--name prometheus \
prom/prometheus
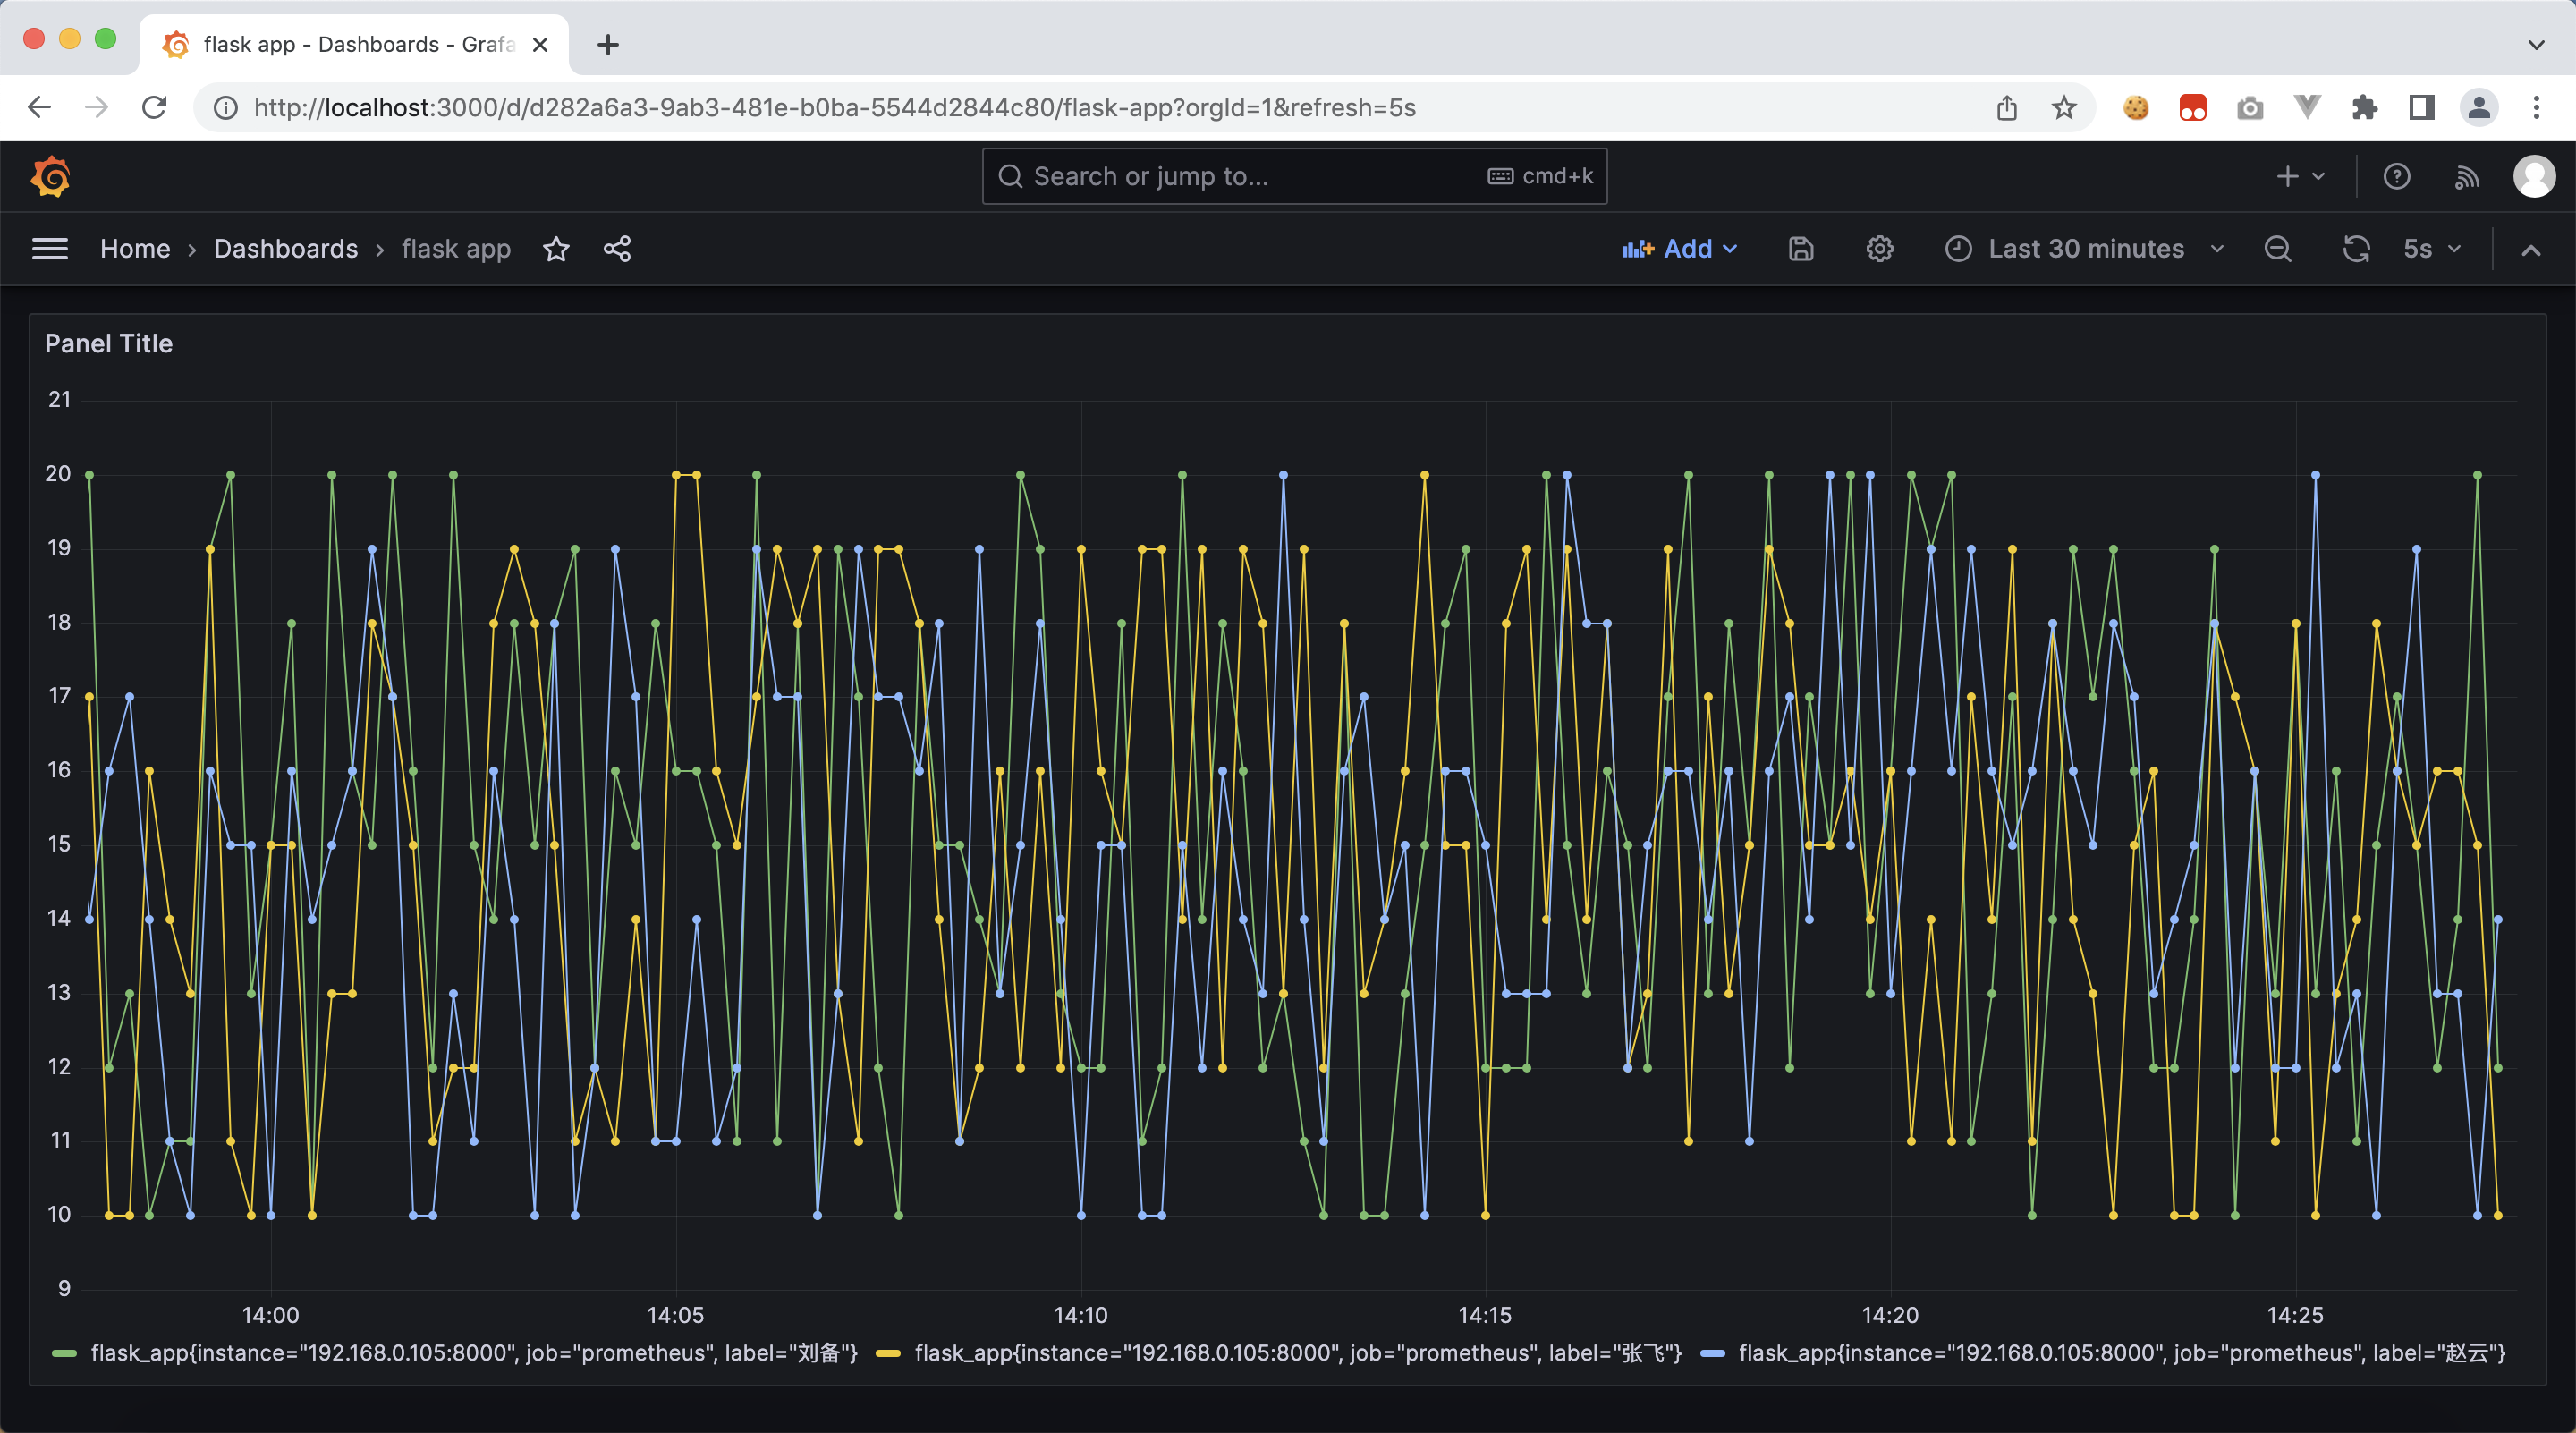
3、启动 grafana
The open and composable observability and data visualization platform. Visualize metrics, logs, and traces from multiple sources like Prometheus, Loki, Elasticsearch, InfluxDB, Postgres and many more.
译文:开放、可组合的可观测性和数据可视化平台。可视化来自Prometheus、Loki、Elasticsearch、InfluxDB、Postgres等多个来源的指标、日志和跟踪。
使用docker方式启动 grafana
docker run -d \
-p 3000:3000 \
--name grafana \
grafana/grafana
参考文章