一、前言
本文将详细介绍如何使用Spring Boot Actuator Metrics,Prometheus和Grafana搭建一个可视化的Metrics监控系统。通过本文,你将学到:
1.1 Spring Boot Actuator Metrics概述:了解Spring Boot Actuator Metrics的基本概念和功能,以及如何将其应用于Spring Boot项目。
1.2 Prometheus介绍:了解Prometheus的基本原理,功能,以及如何与Spring Boot Actuator Metrics进行集成,用于收集和存储应用程序的性能指标。
1.3 Grafana简介:了解Grafana的基本概念,功能,以及如何与Prometheus集成,用于展示应用程序的性能指标,实现可视化监控。
二、配置Spring Boot Actuator Metrics
2.1 添加依赖
需要添加Spring Boot Actuator和Micrometer的依赖。在pom.xml文件中,添加以下依赖:
<dependency>
    <groupId>org.springframework.boot</groupId>
    <artifactId>spring-boot-starter-actuator</artifactId>
</dependency>
<dependency>
    <groupId>io.micrometer</groupId>
    <artifactId>micrometer-registry-prometheus</artifactId>
</dependency>
2.2 配置Actuator
在项目的application.yml或application.properties文件中,进行以下配置:
management:
  endpoints:
    web:
      exposure:
        include: "*" # 暴露所有端点,包括自定义端点
  endpoint:
    health:
      show-details: always # 显示详细的健康检查信息
  metrics:
    export:
      prometheus:
        enabled: true # 启用Prometheus
  prometheus:
    enabled: true # 启用Prometheus端点
2.3 配置Prometheus
在Spring Boot项目中创建一个PrometheusConfig类,并使用@Configuration注解标注。在该类中,配置一个CollectorRegistry Bean,用于将Micrometer的指标数据转换为Prometheus可以识别的格式。
import io.micrometer.prometheus.PrometheusConfig;
import io.micrometer.prometheus.PrometheusMeterRegistry;
import io.prometheus.client.CollectorRegistry;
import org.springframework.context.annotation.Bean;
import org.springframework.context.annotation.Configuration;

@Configuration
public class PrometheusConfiguration {

    @Bean
    public CollectorRegistry collectorRegistry() {
        return new CollectorRegistry();
    }

    @Bean
    public PrometheusMeterRegistry prometheusMeterRegistry(PrometheusConfig config, CollectorRegistry collectorRegistry) {
        return new PrometheusMeterRegistry(config, collectorRegistry, Clock.SYSTEM);
    }
}
至此,已成功配置了Spring Boot Actuator Metrics,使其与Prometheus兼容。接下来,需要配置Prometheus服务器以收集应用程序的指标数据,并配置Grafana以实现指标数据的可视化。
三、配置和安装Prometheus
3.1 下载和安装Prometheus
访问Prometheus官方网站(https://prometheus.io/download/),下载适合操作系统的Prometheus版本。解压下载的文件,将包含Prometheus二进制文件和配置文件的目录放在合适的位置。
3.2 配置Prometheus
在Prometheus的安装目录中,找到prometheus.yml配置文件。打开并编辑该文件,以配置Prometheus以抓取Spring Boot应用程序的指标数据。
3.3 配置Prometheus抓取Spring Boot应用Metrics
在prometheus.yml文件中,找到scrape_configs部分,并添加一个新的抓取配置,如下所示:
scrape_configs:
  - job_name: 'spring_boot_app'
    metrics_path: '/actuator/prometheus'
    static_configs:
      - targets: ['localhost:8080'] # 使用你的Spring Boot应用程序的实际主机和端口替换
在此配置中,我们指定了应用程序的/actuator/prometheus端点作为Prometheus抓取指标数据的路径。确保将targets中的localhost:8080替换为你的Spring Boot应用程序的实际主机名和端口号。
3.4 启动Prometheus
在Prometheus的安装目录中,使用命令行运行以下命令以启动Prometheus:
- 对于Linux/macOS:
./prometheus --config.file=prometheus.yml- 对于Windows:
prometheus.exe --config.file=prometheus.yml现在,Prometheus已经开始运行并监控你的Spring Boot应用程序的指标数据。接下来,需要安装和配置Grafana,以实现指标数据的可视化。
启动成功日志如下

四、配置和安装Grafana
4.1 下载和安装Grafana
访问Grafana官方网站(https://grafana.com/grafana/download/),下载适合你操作系统的Grafana版本。安装完成后,按照Grafana官方文档中的说明启动Grafana服务。
4.2 配置Grafana数据源
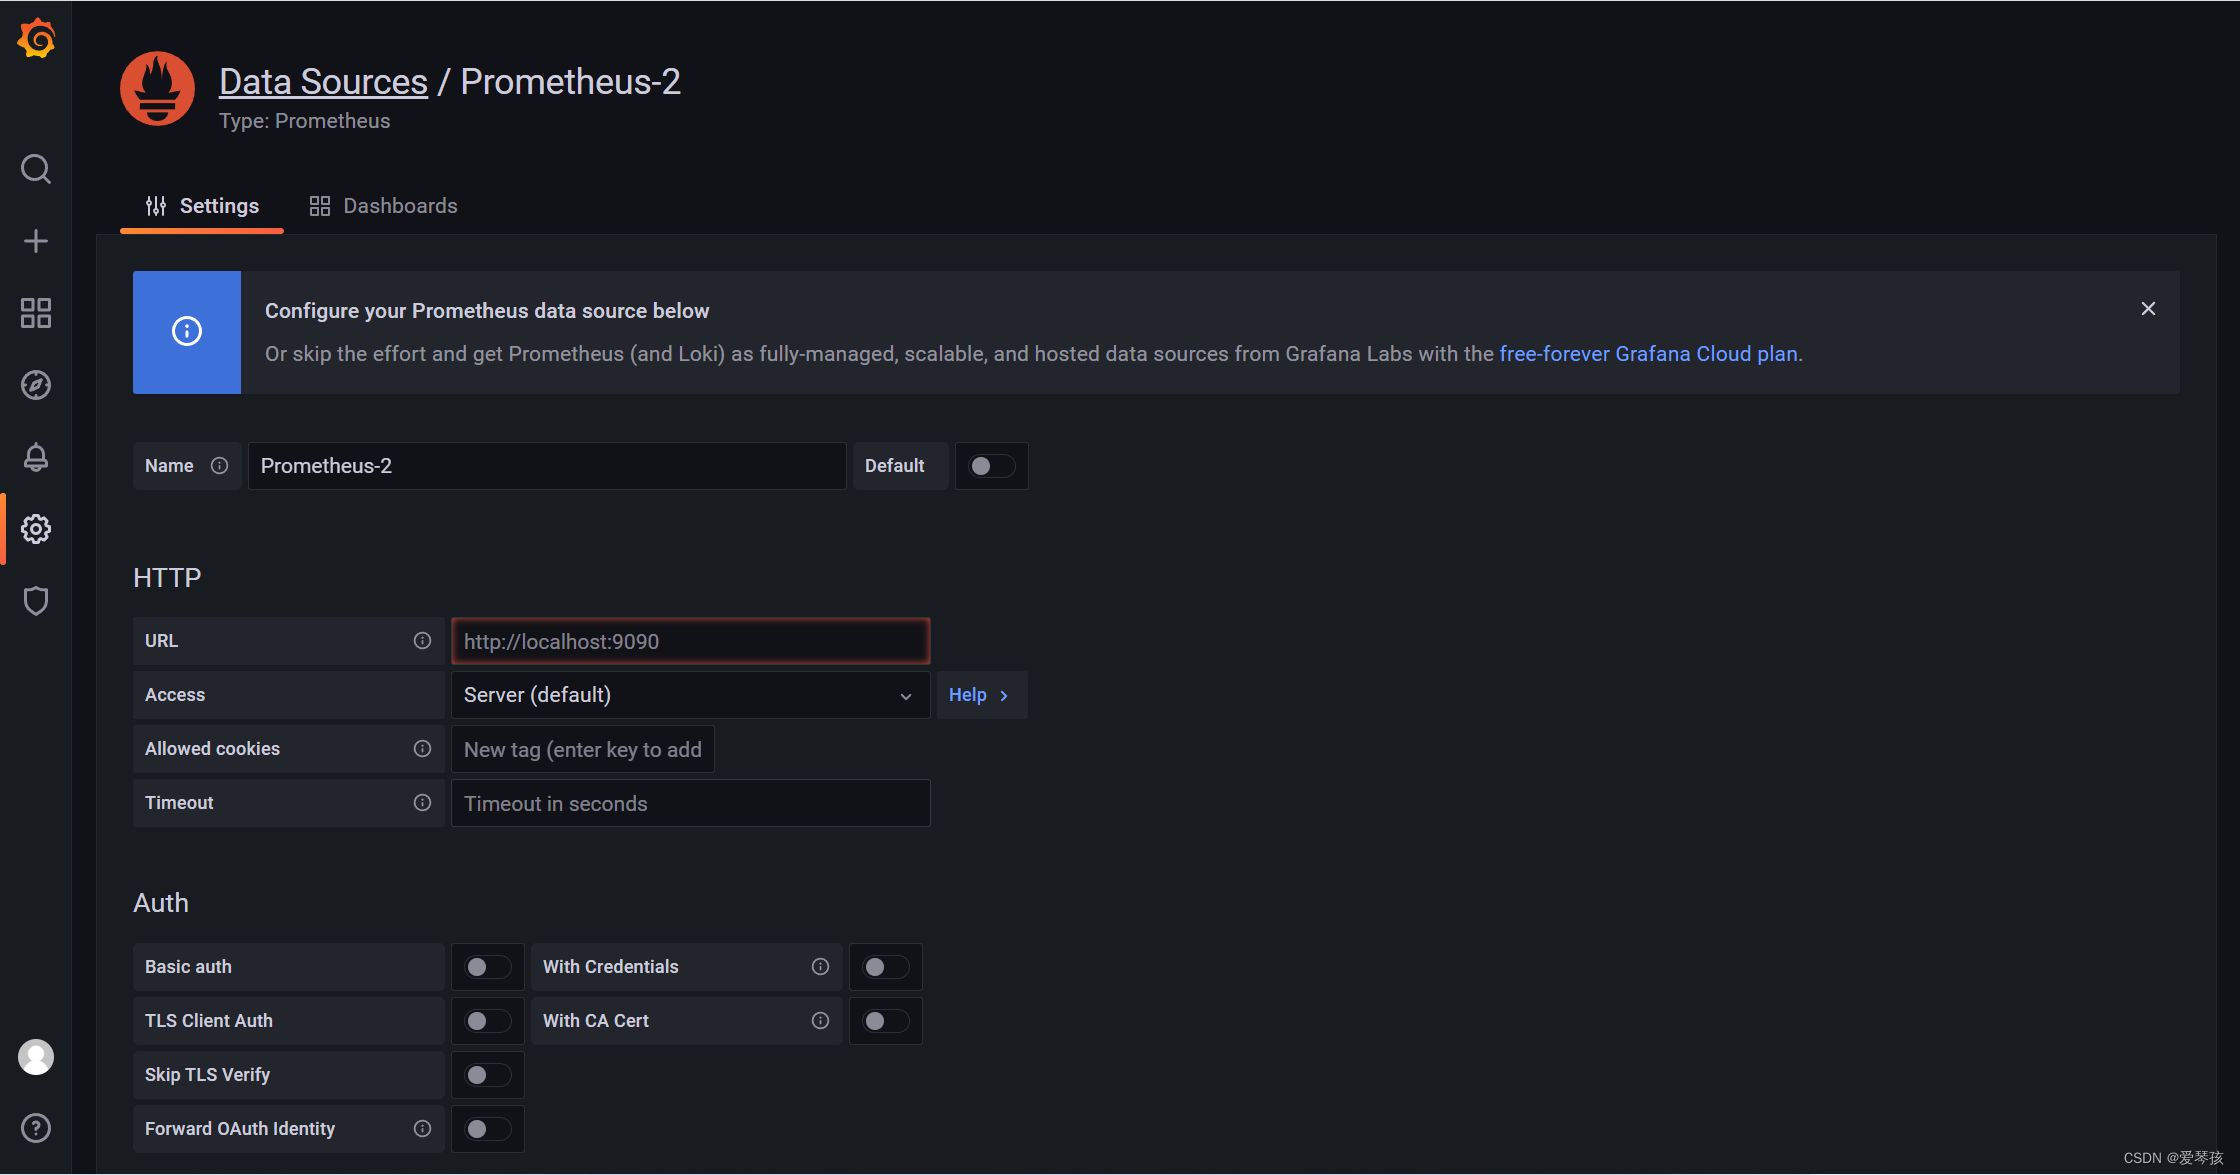
登录Grafana(默认用户名和密码均为admin),然后转到Configuration > Data Sources。点击Add data source,选择Prometheus作为数据源类型。

在URL字段中,输入Prometheus实例的地址(例如http://localhost:9090),然后将Access设置为Server。点击Save & Test按钮以测试和保存数据源配置。
4.3 创建Dashboard
完成数据源配置后,转到Dashboards > Manage,点击New dashboard按钮创建一个新的Dashboard。

在新的Dashboard中,点击Add new panel以添加图表。在图表编辑器中,你可以选择查询Prometheus数据源的指标数据。例如,要查看Spring Boot应用程序的HTTP请求数,可以输入以下PromQL查询:
rate(http_server_requests_seconds_count[1m])
根据需要,你可以添加更多图表以监控其他指标,例如JVM内存使用情况、数据库连接池状态等。调整图表的显示方式和格式,以满足你的监控需求。
完成Dashboard配置后,保存并返回Dashboard页面。现在,你可以在Grafana中查看和分析Spring Boot应用程序的实时指标数据。随着时间的推移,你可以轻松地跟踪应用程序的性能和资源使用情况。
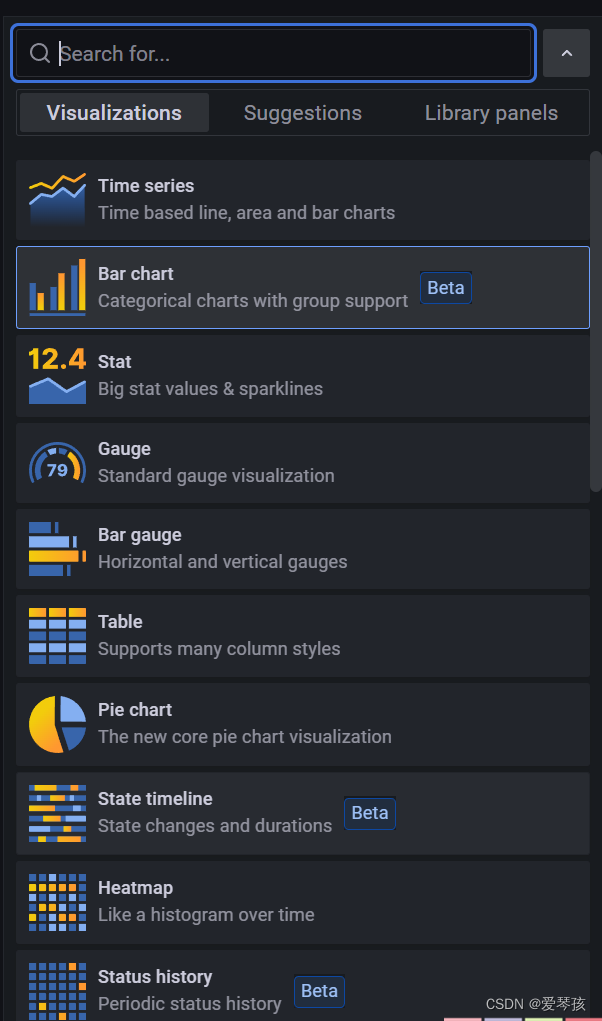
4.4 自定义图表样式
在图表编辑器的Visualization选项卡下,你可以自定义图表的显示方式和样式。Grafana提供了多种图表类型,如折线图、饼图、柱状图等。选择适合你需求的图表类型,并根据需要调整颜色、轴标签等显示设置。
4.5 保存并分享Dashboard
完成图表配置后,点击Apply按钮将其添加到Dashboard中。你可以继续添加更多图表以满足监控需求。最后,点击Dashboard右上角的Save按钮以保存你的更改。
要与团队成员共享Dashboard,点击右上角的Share按钮。你可以选择生成一个共享链接,或将Dashboard嵌入到其他网页中。这样,团队成员可以轻松访问并查看实时的应用程序性能和资源使用情况。
五、最佳实践和优化建议
5.1 选择合适的Metrics采集间隔
根据应用程序的性能要求和监控目标,合理设置Prometheus抓取Metrics的间隔。较短的间隔可以提供更实时的数据,但可能会增加系统负载。相反,较长的间隔可能会降低系统负载,但数据可能不够实时。权衡这两者之间的关系,以获得最佳的性能和监控效果。
5.2 使用标签和注解优化监控数据
使用Prometheus的标签功能,可以更好地组织和筛选监控数据。为指标添加有意义的标签,可以方便地对数据进行聚合和查询。在Grafana中,可以利用标签快速定位特定指标,并为Dashboard图表提供更丰富的信息。
5.3 自定义Metrics收集
除了Spring Boot Actuator提供的默认Metrics之外,还可以根据实际需求,自定义收集应用程序的其他性能指标。例如,可以监控业务指标(如订单数、用户注册数等)或者应用程序的自定义组件。通过自定义Metrics,可以更全面地了解应用程序的运行状况和性能表现。
5.4 安全性和访问控制
在生产环境中,确保对Spring Boot Actuator端点、Prometheus和Grafana进行适当的访问控制。例如,可以限制对敏感端点的访问,或为Prometheus和Grafana设置身份验证。此外,还可以使用HTTPS、防火墙规则等安全措施,以保护监控数据和系统的安全。