15-1&15-2
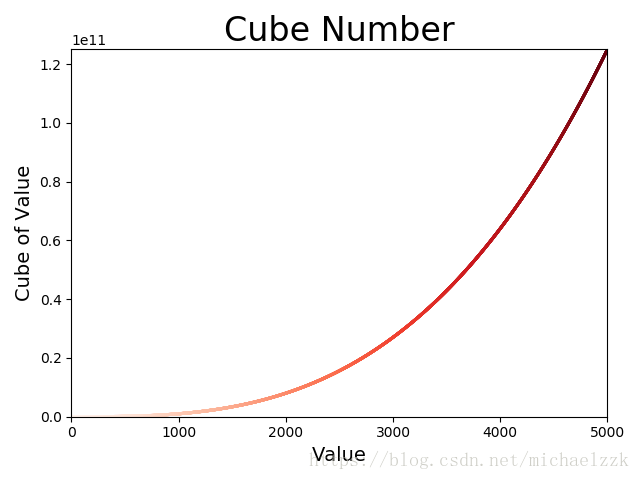
绘制一个图形,显示前5个整数的立方值,再绘制一个图形,显示前5000个整数的立方值,给该立方图指定颜色映射
# 15-2 彩色立方
import matplotlib.pyplot as plt

x_values = list(range(0,5001))
y_values = [x ** 3 for x in x_values]

plt.scatter(x_values, y_values,
            c=x_values,cmap=plt.cm.Reds,edgecolors='none', s=5)
plt.title("Cube Number", fontsize=24)
plt.xlabel("Value", fontsize=14)
plt.ylabel("Cube of Value", fontsize=14)
plt.axis([0,5000,0,125000000000])

plt.show()
15-3&15-5
修改随机漫步的显示代码,将其中的plt.scatter()替换为plt.plot()(即散点图替换为折线图),以此来模拟花粉在水滴表面的运动路径。向plt.plot()传递rw.x_values和rw.y_values。
重构:新建一个get_step()的方法,用于确定每次漫步的距离和方向,并计算这次漫步将如何移动。
#random_walk.py
from random import choice


class RandomWalk():
    """一个生成随机漫步数据的类"""

    def __init__(self, num_points=5000):
        """初始化随机漫步的属性,默认走5000步"""
        self.num_points = num_points
        # 所有随机漫步都始于(0,0)
        self.x_values = [0]
        self.y_values = [0]

    def fill_walk(self):
        """计算随机漫步包含的所有点"""
        # 不断漫步,直到列表达到指定的长度
        while len(self.x_values) < self.num_points:
            # 决定前进方向以及沿着这个方向前进的距离
            x_step = self.get_step()
            y_step = self.get_step()

            if x_step == 0 and y_step == 0:
                continue

            # 计算下一个点的x和y值
            next_x = self.x_values[-1] + x_step
            next_y = self.y_values[-1] + y_step

            self.x_values.append(next_x)
            self.y_values.append(next_y)

    def get_step(self):
        direction = choice([1, -1])
        distance = choice([0, 1, 2, 3, 4])
        step = direction * distance
        return step
#rw_visual.py
import matplotlib.pyplot as plt
from chapter15.random_walk import RandomWalk

while True:
    # 创建一个RandWalk实例,并将其包含的点都绘制出来
    rw=RandomWalk()
    rw.fill_walk()
    plt.plot(rw.x_values,rw.y_values) #模拟花粉在水滴表面的运动路径

    plt.show()

    keep_running=input("Make another walk?(y/n):")
    if keep_running=='n':
        break
15-8
同时掷三个D6骰子,可能得到的最小点数为3,而最大点数为18,可视化展示两头骰子点数相乘的结果。
die.py
from random import randint

class Die():
    """表示一个骰子的类"""
    def __init__(self, num_sides=6):
        """骰子默认为6面"""
        self.num_sides = num_sides

    def roll(self):
        """返回一个位于1和骰子面数之间的随机值"""
        return randint(1, self.num_sides)
three dice.py
import pygal
from chapter15.die import Die

die1=Die()
die2=Die()
die3=Die()

results=[die1.roll()+die2.roll()+die3.roll() for roll_num in range(50000)]

#分析结果
max_result=die1.num_sides+die2.num_sides+die3.num_sides
frequences = [results.count(value) for value in range(3,max_result+1)]

#对结果进行可视化
hist = pygal.Bar()
hist.title="Results of rolling three D6 50000 times."
hist.x_labels=list(range(3,19))
hist.x_title="Result"
hist._y_title="Frequence of Result"

hist.add('D6+D6+D6',frequences)
hist.render_to_file('three_visual.svg')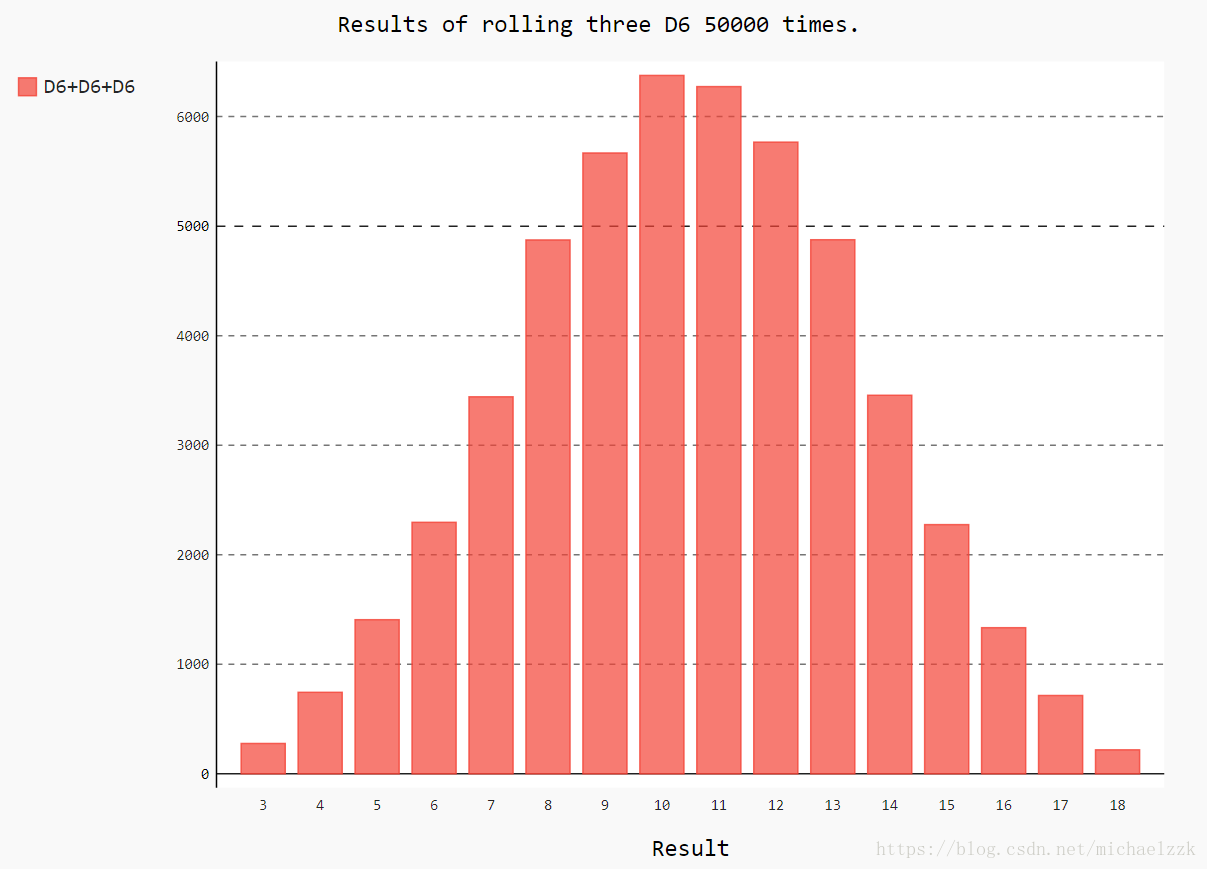
15-9
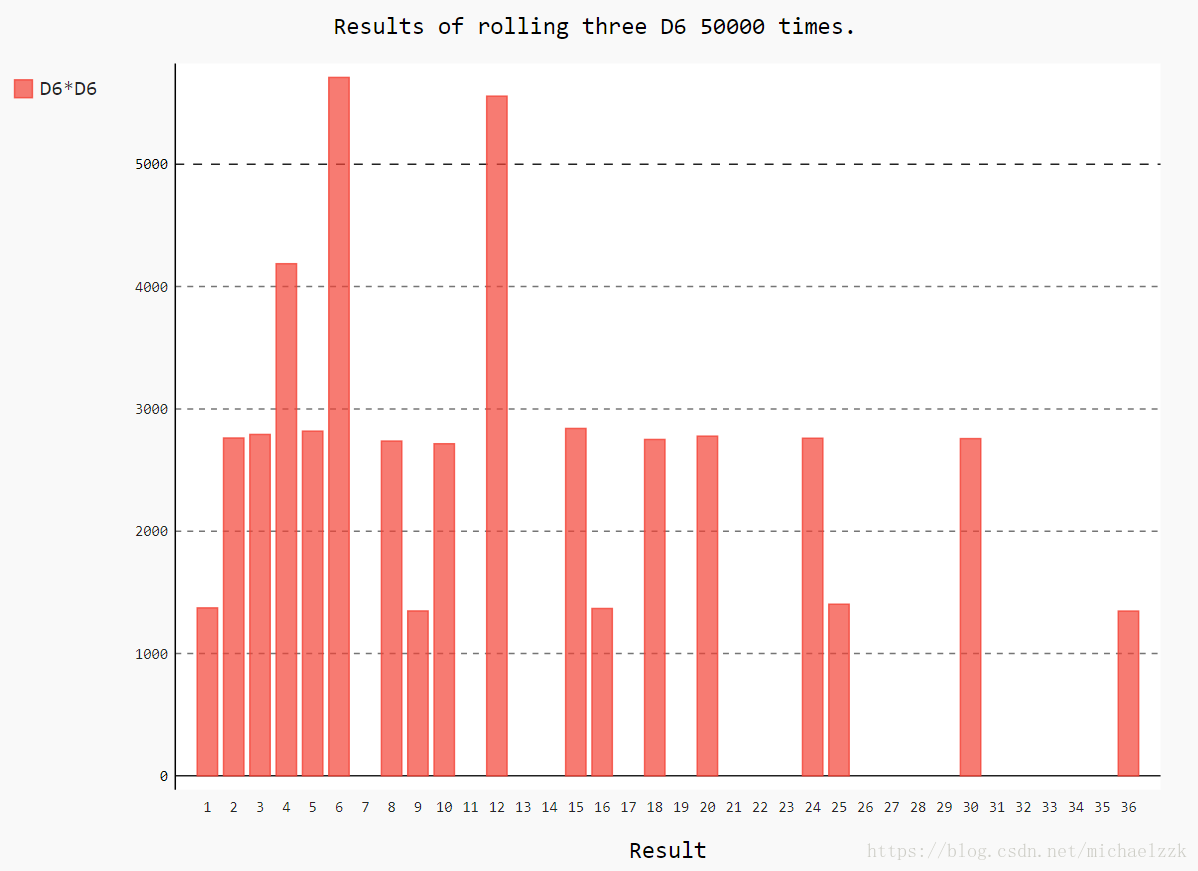
同时掷两个骰子,可视化两个骰子点数相乘的结果
import pygal
from chapter15.die import Die

die1=Die()
die2=Die()

results=[die1.roll()*die2.roll() for roll_num in range(50000)]

#分析结果
max_result=die1.num_sides*die2.num_sides
frequences = [results.count(value) for value in range(1,max_result+1)]

#对结果进行可视化
hist = pygal.Bar()
hist.title="Results of rolling three D6 50000 times."
hist.x_labels=list(range(1,37))
hist.x_title="Result"
hist._y_title="Frequence of Result"

hist.add('D6*D6',frequences)
hist.render_to_file('multip_visual.svg')