PaintEvent:系统自动调用
void MainWindow::paintEvent(QPaintEvent *)
添加QWT
参考文章
CONFIG += qwt
DEFINES += QT_DLL QWT_DLL
LIBS += -L"D:\File\LearnFile\QT\qwt-6.2.0\build-qwt-Desktop_Qt_5_14_2_MinGW_64_bit-Debug\lib" -lqwtd #自己编译64位的QWT的lib路径
LIBS += -L"D:\File\LearnFile\QT\qwt-6.2.0\build-qwt-Desktop_Qt_5_14_2_MinGW_64_bit-Debug\lib" -lqwt
INCLUDEPATH += D:\File\LearnFile\QT\File\5.14.2\mingw73_64\include\qwt #添加的QWT的源码
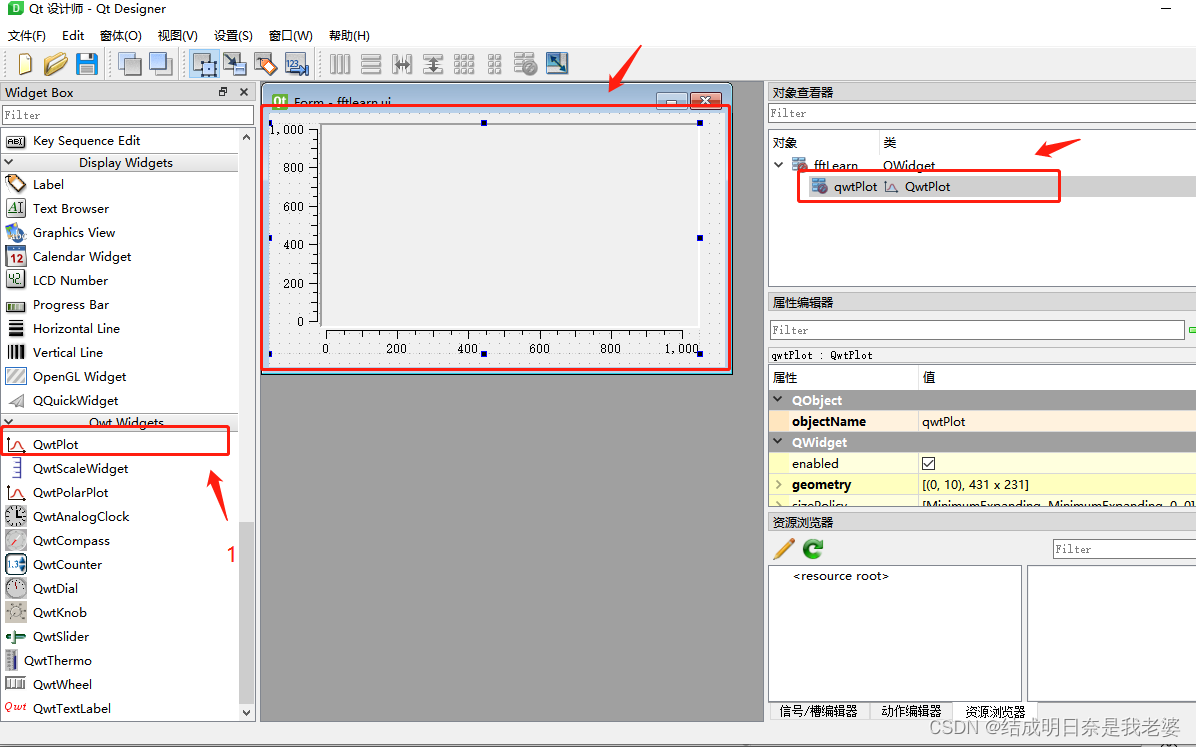
通过ui界面去设置QWT

添加的头
#include <qwt_plot_curve.h>
#include <qwt_plot_grid.h>
#include <qwt_legend.h>
#include <qwt_legend_label.h>
清除
ui->qwtPlot->detachItems();
ui->qwtPlot->replot();
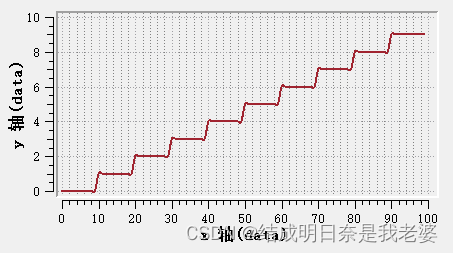
点
QPolygonF point;
for(int i=0;i<100;i++){
point<<QPoint(i,i*0.1);
}
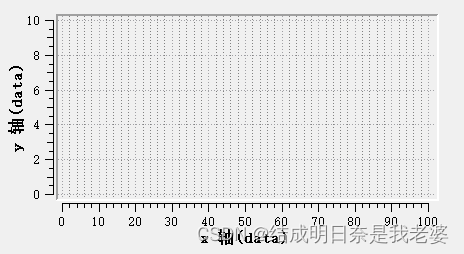
设置坐标最大最小值
ui->qwtPlot->setAxisScale(QwtPlot::xBottom,0,100,10);
ui->qwtPlot->setAxisScale(QwtPlot::yLeft,0,10,2);
ui->qwtPlot->setAxisTitle(QwtPlot::xBottom,"x 轴(data)");
ui->qwtPlot->setAxisTitle(QwtPlot::yLeft,"y 轴(data)");
设置网格
QwtPlotGrid *grid = new QwtPlotGrid;
grid->enableXMin( true );
grid->setMajorPen( Qt::gray, 0, Qt::DotLine );
grid->setMinorPen( Qt::darkGray, 0, Qt::DotLine );
grid->attach( ui->qwtPlot );
绘制曲线
QwtPlotCurve* curve = new QwtPlotCurve("Curve 1");
curve->setSamples(point);
curve->setPen(QColor(160, 36,48),2,Qt::SolidLine);
curve->attach(ui->qwtPlot);
curve->setCurveAttribute(QwtPlotCurve::Fitted, true);