最近做的上位机软件的项目,需要做一个生成测试报告的功能,对回放文件和对比文件做一个可视化分析,并把分析得到的结果保存在一个文档中!数据可视化我使用的是qcustomplot(qt提供的一个画图库),官方给了demo演示如何将plot保存在文档中,大家也可以去看一下这里https://www.qcustomplot.com/index.php/tutorials/specialcases/textdocument
我是按照以下几个步骤实现的。
1. 下载qcustomplot代码库
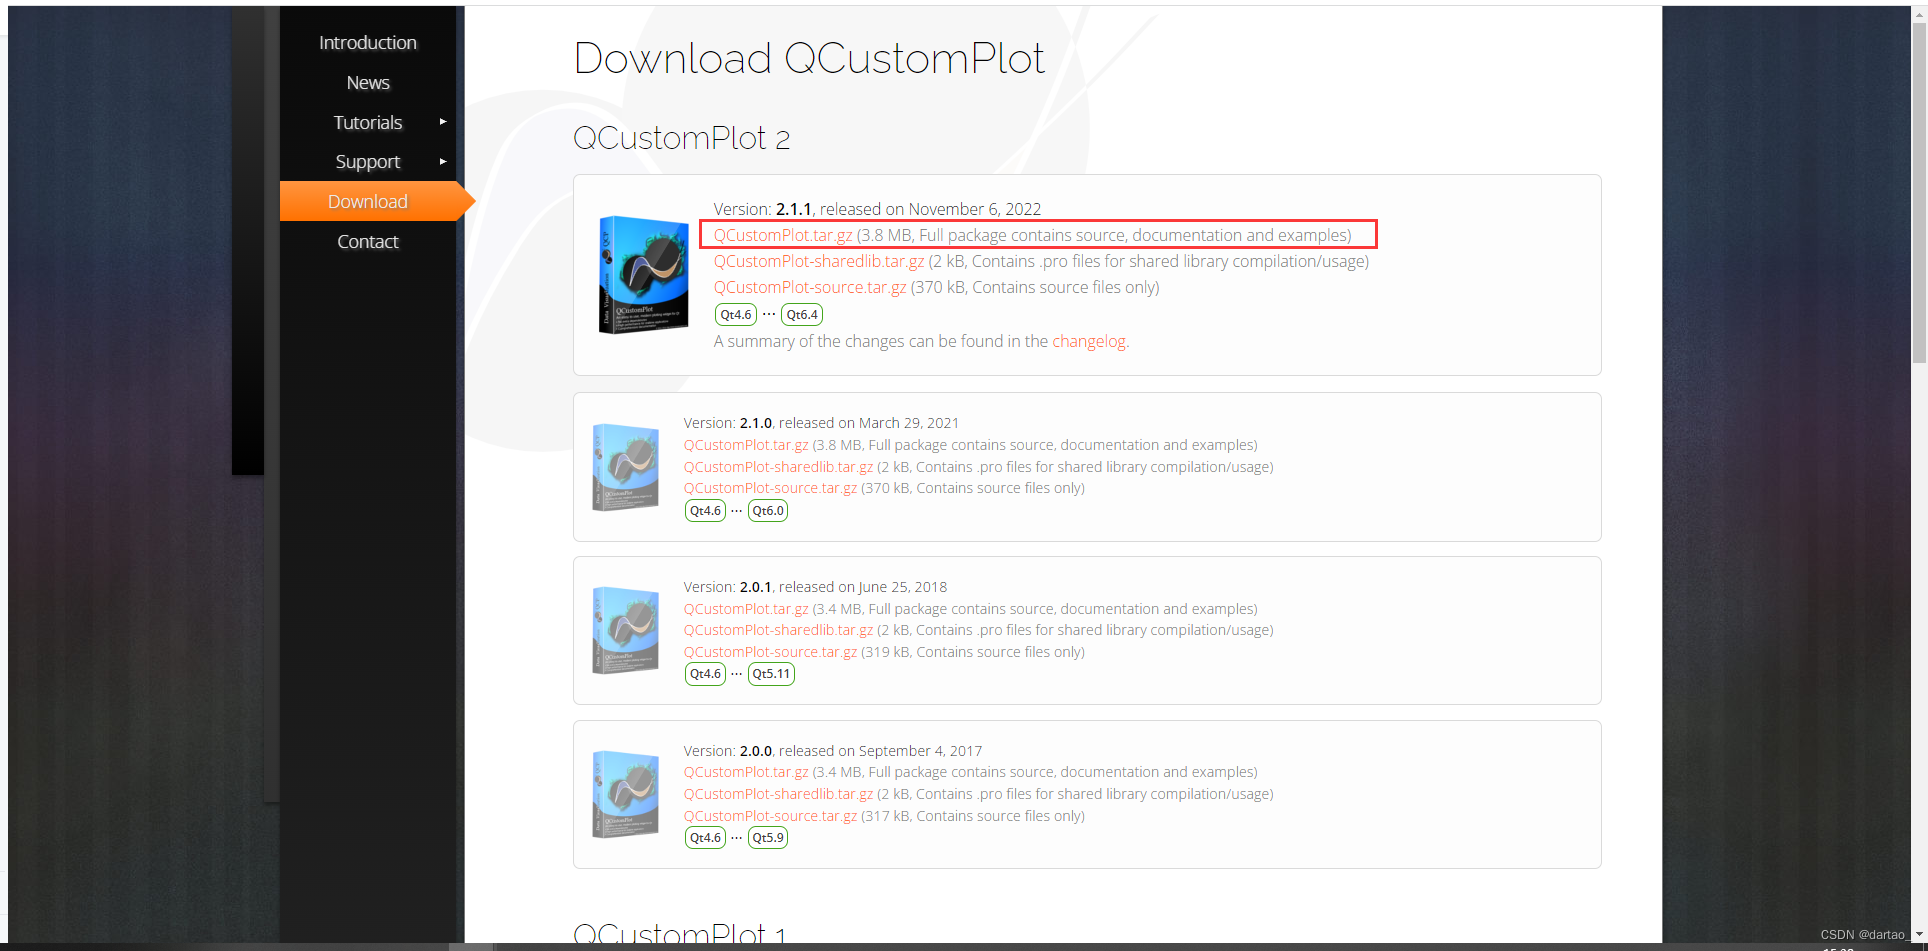
进入官网,选择与你Qt版本对应的代码库,https://www.qcustomplot.com/index.php/download
2. 文件夹解压,把相对应的.cpp/.h文件添加进项目
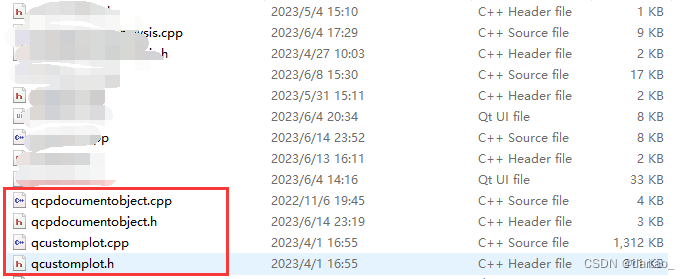
将下载的压缩包文件进行解压,并把qcustomplot.cpp/.h以及examples\text-document-integration下的qcpdocumentobject.cpp/.h文件都加载进项目;
3. 实现plot保存功能
3.1 加载头文件,添加UI组件
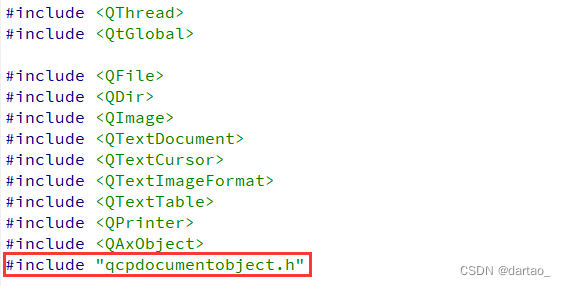
在实现保存功能的类中加载qcpdocumentobject.h的头文件
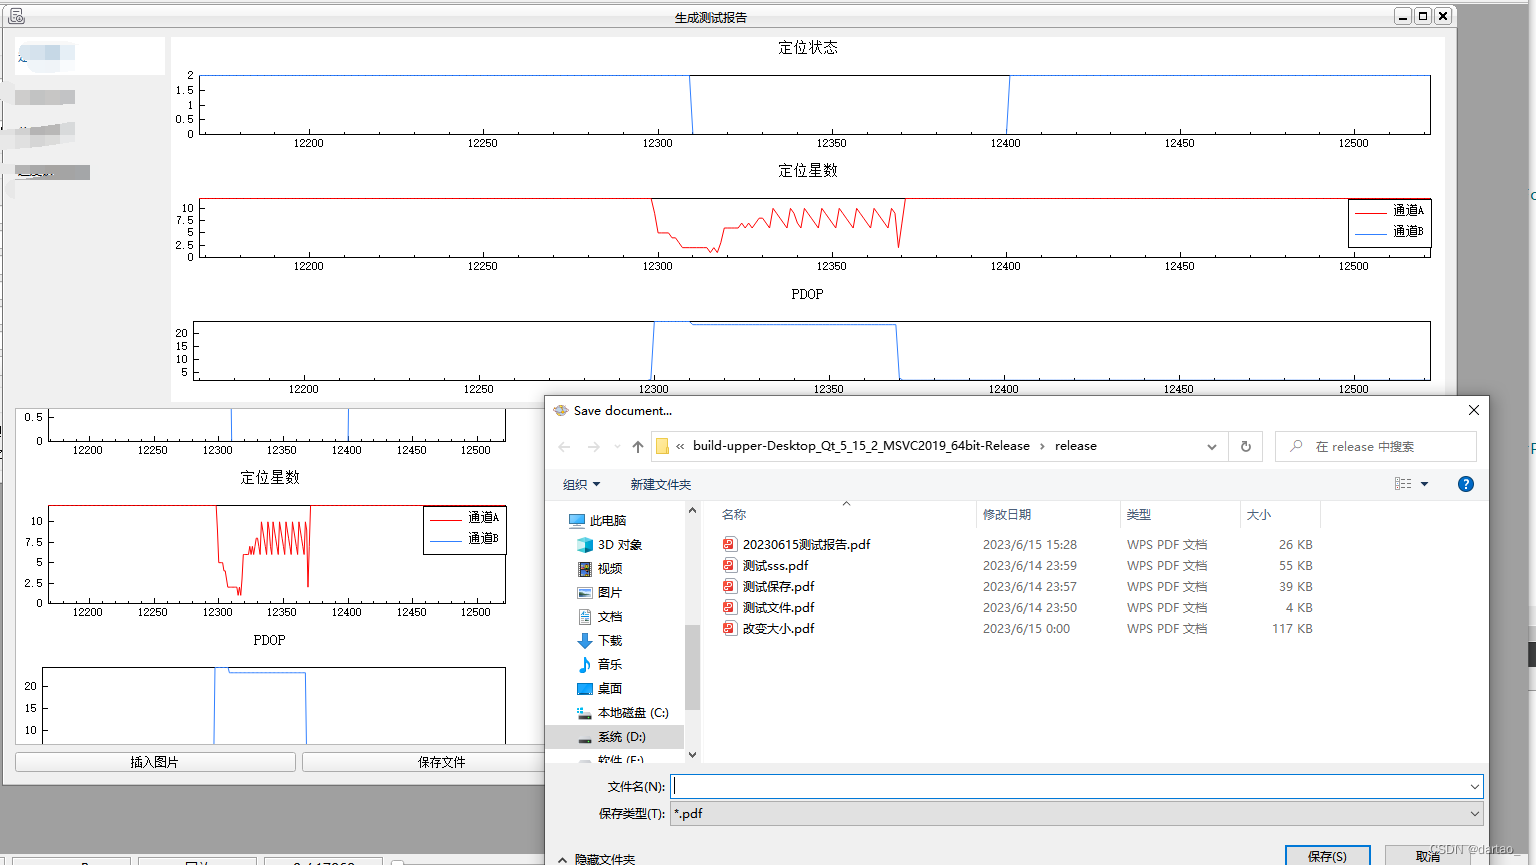
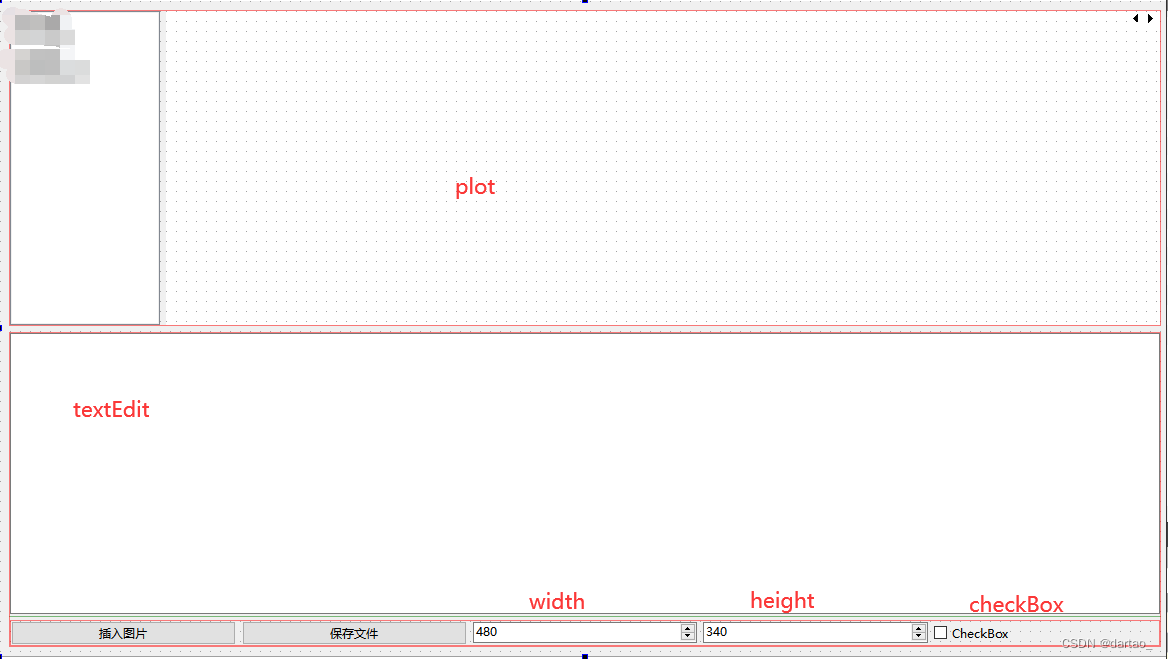
添加一些UI组件,我这里的UI界面是这样的,plot里是绘制的图形,下面的是一个文本编辑框,用来插入的plot和输入一些文字
3.2 注册文本文档中绘图对象的handler
把textEdit注册为文本文档中绘图对象的处理程序,只需要执行一次,我这里是直接放在了构造函数中。
QCPDocumentObject *plotObjectHandler = new QCPDocumentObject(this);
ui->textEdit->document()->documentLayout()->registerHandler(QCPDocumentObject::PlotTextFormat, plotObjectHandler);
3.3 编写槽函数,实现插入图形的功能
在UI界面中,右击“转到槽函数”,在槽函数中加入以下代码:
QTextCursor cursor = ui->textEdit->textCursor();

// 如果勾选了checkBox,则使用当前的图形的大小,否则,使用spinBox中的宽和高
double width = ui->checkBox->isChecked() ? 0 : ui->width->value();
double height = ui->checkBox->isChecked() ? 0 : ui->height->value();

cursor.insertText(QString(QChar::ObjectReplacementCharacter), QCPDocumentObject::generatePlotFormat(ui->locateWidget, width, height));

ui->textEdit->setTextCursor(cursor);
3.4 实现导出文档的功能,这里直接使用了官方demo里的代码,导出为pdf(导出doc,docx会乱码)
在UI界面中右击“保存文件”,转到槽函数,在槽函数中输入以下代码:
QString fileName = QFileDialog::getSaveFileName(this, "Save document...", qApp->applicationDirPath(), "*.pdf");
    if (!fileName.isEmpty())
    {


      QPrinter printer;
      printer.setOutputFormat(QPrinter::PdfFormat);
      printer.setOutputFileName(fileName);
      QMargins pageMargins(20, 20, 20, 20);
  #if QT_VERSION < QT_VERSION_CHECK(5, 3, 0)
      printer.setFullPage(false);
      printer.setPaperSize(QPrinter::A4);
      printer.setOrientation(QPrinter::Portrait);
      printer.setPageMargins(pageMargins.left(), pageMargins.top(), pageMargins.right(), pageMargins.bottom(), QPrinter::Millimeter);
  #else
      QPageLayout pageLayout;
      pageLayout.setMode(QPageLayout::StandardMode);
      pageLayout.setOrientation(QPageLayout::Portrait);
      pageLayout.setPageSize(QPageSize(QPageSize::A4));
      pageLayout.setUnits(QPageLayout::Millimeter);
      pageLayout.setMargins(QMarginsF(pageMargins));
      printer.setPageLayout(pageLayout);
  #endif

  #if QT_VERSION < QT_VERSION_CHECK(6, 0, 0)
      ui->textEdit->document()->setPageSize(printer.pageRect().size());
  #else
      ui->textEdit->document()->setPageSize(printer.pageLayout().paintRectPixels(printer.resolution()).size());
  #endif
      ui->textEdit->document()->print(&printer);
4. 运行效果
插入plot
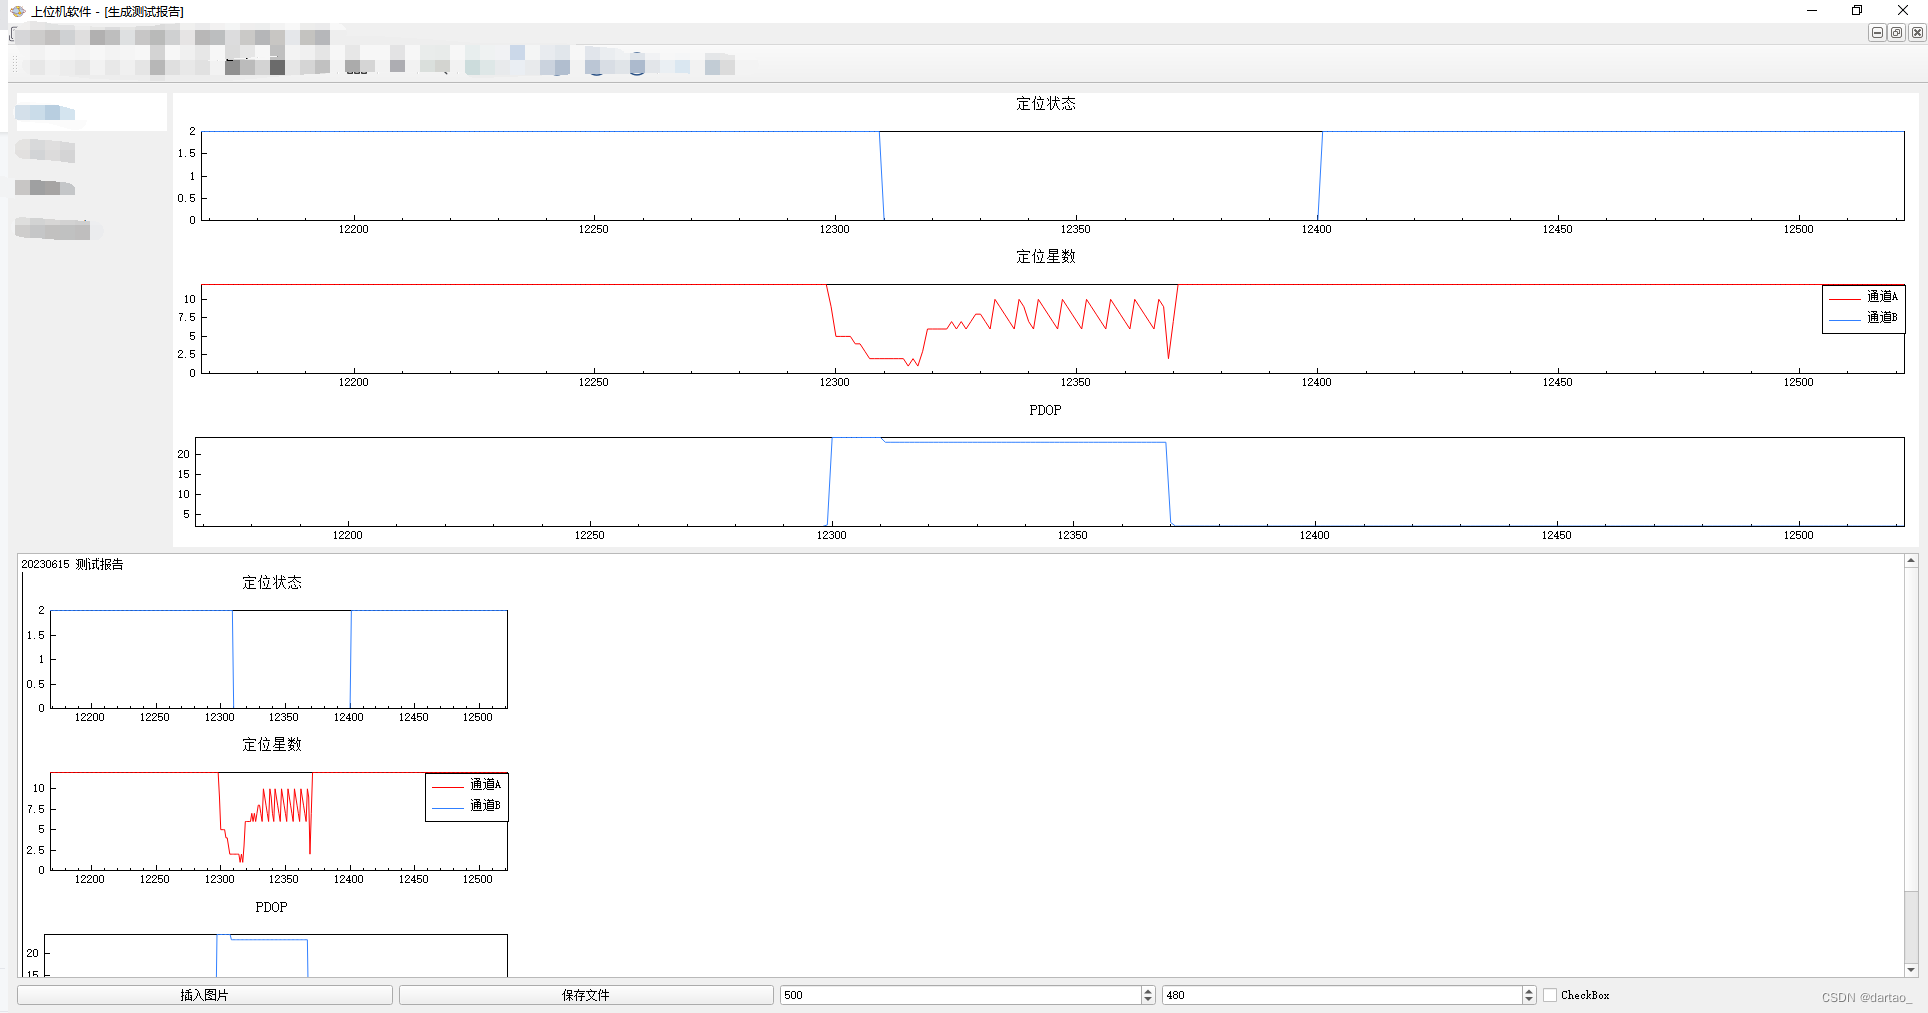
导出文档