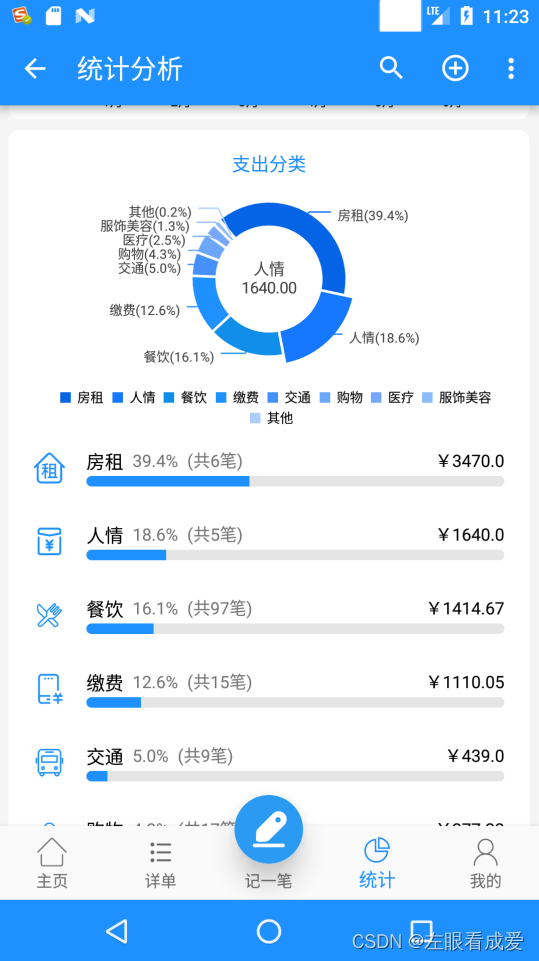
效果如下图:

饼图选中状态:
实现方法如下:
1,自定义PieChartRendederer
package com.example.cashbook.custom;


import android.graphics.Canvas;
import android.graphics.Paint;
import android.graphics.Rect;
import android.graphics.drawable.Drawable;
import com.github.mikephil.charting.animation.ChartAnimator;
import com.github.mikephil.charting.charts.PieChart;
import com.github.mikephil.charting.data.PieData;
import com.github.mikephil.charting.data.PieDataSet;
import com.github.mikephil.charting.data.PieEntry;
import com.github.mikephil.charting.formatter.ValueFormatter;
import com.github.mikephil.charting.interfaces.datasets.IPieDataSet;
import com.github.mikephil.charting.renderer.PieChartRenderer;
import com.github.mikephil.charting.utils.ColorTemplate;
import com.github.mikephil.charting.utils.MPPointF;
import com.github.mikephil.charting.utils.Utils;
import com.github.mikephil.charting.utils.ViewPortHandler;

import java.util.ArrayList;
import java.util.List;

/**
 * @author wh445306
 * @version 1.0
 * @Description PieChartCustomRendederer
 * @Date 2023-06-13 0:42
 */

public class PieChartCustomRendederer extends PieChartRenderer {
     Paint mEntryLabelsPaint=new Paint();

    public PieChartCustomRendederer(PieChart chart, ChartAnimator animator, ViewPortHandler viewPortHandler) {
        super(chart, animator, viewPortHandler);
    }

    private float[] minData(float leftRecordY[][], float pt1y) {
        //计算出离的最近的
        List<Float> bigD = new ArrayList<>();
        //变换前的数据
        List<Float> nearestlist = new ArrayList<>();
        //变换后的数据
        List<Float> nearestlistCopy = new ArrayList<>();
        for (int k = 0; k < leftRecordY[0].length; k++) {
            if (leftRecordY[0][k] != 0) {
                bigD.add(Math.abs(leftRecordY[0][k] - pt1y));
                nearestlist.add(leftRecordY[0][k]);
                nearestlistCopy.add(leftRecordY[1][k]);
            }
        }
        // 距离最近的点,数值
        float[] rF = new float[2];
        if (bigD.size() == 0) {
            return rF;
        }

        float minD = bigD.get(0);
        rF[0]= nearestlist.get(0);
        rF[1]= nearestlistCopy.get(0);

        for (int g = 0; g < bigD.size(); g++) {
            if (bigD.get(g) < minD) {
                minD = bigD.get(g);
                rF[0]= nearestlist.get(g);
                rF[1]= nearestlistCopy.get(g);
            }
        }
        return rF;
    }

    private String text = "2.0%";
    @Override
    public void drawValues(Canvas c) {

        MPPointF center = mChart.getCenterCircleBox();

        // get whole the radius
        float radius = mChart.getRadius();
        float rotationAngle = mChart.getRotationAngle();
        float[] drawAngles = mChart.getDrawAngles();
        float[] absoluteAngles = mChart.getAbsoluteAngles();

        float phaseX = mAnimator.getPhaseX();
        float phaseY = mAnimator.getPhaseY();

        final float roundedRadius = (radius - (radius * mChart.getHoleRadius() / 100f)) / 2f;
        final float holeRadiusPercent = mChart.getHoleRadius() / 100.f;
        float labelRadiusOffset = radius / 10f * 3.6f;

        if (mChart.isDrawHoleEnabled()) {
            labelRadiusOffset = (radius - (radius * holeRadiusPercent)) / 2f;

            if (!mChart.isDrawSlicesUnderHoleEnabled() && mChart.isDrawRoundedSlicesEnabled()) {
                // Add curved circle slice and spacing to rotation angle, so that it sits nicely inside
                rotationAngle += roundedRadius * 360 / (Math.PI * 2 * radius);
            }
        }

        final float labelRadius = radius - labelRadiusOffset;

        PieData data = mChart.getData();
        List<IPieDataSet> dataSets = data.getDataSets();

        float yValueSum = data.getYValueSum();

        boolean drawEntryLabels = mChart.isDrawEntryLabelsEnabled();

        float angle;
        int xIndex = 0;

        c.save();

        float offset = Utils.convertDpToPixel(5.f);

        for (int i = 0; i < dataSets.size(); i++) {

            IPieDataSet dataSet = dataSets.get(i);

            final boolean drawValues = dataSet.isDrawValuesEnabled();

            if (!drawValues && !drawEntryLabels)
                continue;

            final PieDataSet.ValuePosition xValuePosition = dataSet.getXValuePosition();
            final PieDataSet.ValuePosition yValuePosition = dataSet.getYValuePosition();

            // apply the text-styling defined by the DataSet
            applyValueTextStyle(dataSet);
            Rect rect = new Rect();
            mValuePaint.getTextBounds(text, 0, text.length(), rect);
            mValuePaint.setColor(dataSet.getColor(i));
            int textHeight = (int) (rect.height() * 1.4f);//文本的高度
            float lineHeight =  Utils.calcTextHeight(mValuePaint, "Q") + Utils.convertDpToPixel(4f);

            ValueFormatter formatter = dataSet.getValueFormatter();

            int entryCount = dataSet.getEntryCount();

            mValueLinePaint.setColor(dataSet.getValueLineColor());
            mValueLinePaint.setStrokeWidth(Utils.convertDpToPixel(dataSet.getValueLineWidth()));

            final float sliceSpace = getSliceSpace(dataSet);

            MPPointF iconsOffset = MPPointF.getInstance(dataSet.getIconsOffset());
            iconsOffset.x = Utils.convertDpToPixel(iconsOffset.x);
            iconsOffset.y = Utils.convertDpToPixel(iconsOffset.y);
            //第一个存以前的,第二个存变换位置后的
            float leftRecordY[][] = new float[2][entryCount];
            float rightRecordY[][] = new float[2][entryCount];

            for (int j = 0; j < entryCount; j++) {

                PieEntry entry = dataSet.getEntryForIndex(j);

                if (xIndex == 0)
                    angle = 0.f;
                else
                    angle = absoluteAngles[xIndex - 1] * phaseX;

                final float sliceAngle = drawAngles[xIndex];
                final float sliceSpaceMiddleAngle = sliceSpace / (Utils.FDEG2RAD * labelRadius);

                // offset needed to center the drawn text in the slice
                final float angleOffset = (sliceAngle - sliceSpaceMiddleAngle / 2.f) / 2.f;

                angle = angle + angleOffset;

                final float transformedAngle = rotationAngle + angle * phaseY;

                float value = mChart.isUsePercentValuesEnabled() ? entry.getY()
                        / yValueSum * 100f : entry.getY();
                String formattedValue = formatter.getPieLabel(value, entry);
                String entryLabel = entry.getLabel();

                final float sliceXBase = (float) Math.cos(transformedAngle * Utils.FDEG2RAD);
                final float sliceYBase = (float) Math.sin(transformedAngle * Utils.FDEG2RAD);

                final boolean drawXOutside = drawEntryLabels &&
                        xValuePosition == PieDataSet.ValuePosition.OUTSIDE_SLICE;
                final boolean drawYOutside = drawValues &&
                        yValuePosition == PieDataSet.ValuePosition.OUTSIDE_SLICE;
                final boolean drawXInside = drawEntryLabels &&
                        xValuePosition == PieDataSet.ValuePosition.INSIDE_SLICE;
                final boolean drawYInside = drawValues &&
                        yValuePosition == PieDataSet.ValuePosition.INSIDE_SLICE;

                if (drawXOutside || drawYOutside) {

                    final float valueLineLength1 = dataSet.getValueLinePart1Length();
                    final float valueLineLength2 = dataSet.getValueLinePart2Length();
                    final float valueLinePart1OffsetPercentage = dataSet.getValueLinePart1OffsetPercentage() / 100.f;

                    float pt2x, pt2y;
                    float labelPtx, labelPty;

                    float line1Radius;

                    if (mChart.isDrawHoleEnabled())
                        line1Radius = (radius - (radius * holeRadiusPercent))
                                * valueLinePart1OffsetPercentage
                                + (radius * holeRadiusPercent);
                    else
                        line1Radius = radius * valueLinePart1OffsetPercentage;

                    final float polyline2Width =  dataSet.isValueLineVariableLength()
                            ? labelRadius * valueLineLength2 * (float) Math.abs(Math.sin(
                            transformedAngle * Utils.FDEG2RAD))
                            : labelRadius * valueLineLength2;

                    float pt0x = line1Radius * sliceXBase + center.x;
                    float pt0y = line1Radius * sliceYBase + center.y;

                    float pt1x = labelRadius * (1 + valueLineLength1) * sliceXBase + center.x;
                    float pt1y = labelRadius * (1 + valueLineLength1) * sliceYBase + center.y;

                    if (transformedAngle % 360.0 >= 90.0 && transformedAngle % 360.0 <= 270.0) {

                        float nearestPoint[] = minData(leftRecordY, pt1y);

                        leftRecordY[0][j] = pt1y;
                        //判断是否需要挪位置
                        if (nearestPoint[0] != 0 && Math.abs(nearestPoint[0] - pt1y) < (textHeight+lineHeight)) {
                            pt1y = nearestPoint[1] - textHeight;
                        }
                        pt2x = pt1x - polyline2Width;
                        pt2y = pt1y;

                        mValuePaint.setTextAlign(Paint.Align.RIGHT);

                        if(drawXOutside)
                            mEntryLabelsPaint.setTextAlign(Paint.Align.RIGHT);

                        labelPtx = pt2x - offset;
                        labelPty = pt2y;
                        leftRecordY[1][j] = pt1y;
                    } else {
                        float[] nearestPoint = minData(rightRecordY, pt1y);

                        rightRecordY[0][j] = pt1y;

                        //判断是否需要挪位置
                        if (nearestPoint[0] != 0 && Math.abs(nearestPoint[0] - pt1y) < (textHeight+lineHeight)) {
                            pt1y = nearestPoint[1] + textHeight;
                        }

                        pt2x = pt1x + polyline2Width;
                        pt2y = pt1y;
                        mValuePaint.setTextAlign(Paint.Align.LEFT);

                        if(drawXOutside)
                            mEntryLabelsPaint.setTextAlign(Paint.Align.LEFT);

                        labelPtx = pt2x + offset;
                        labelPty = pt2y;
                        rightRecordY[1][j] = labelPty;
                    }

                    if (dataSet.getValueLineColor() != ColorTemplate.COLOR_NONE) {

                        if (dataSet.isUsingSliceColorAsValueLineColor()) {
                            mValueLinePaint.setColor(dataSet.getColor(j));
                        }

                        c.drawLine(pt0x, pt0y, pt1x, pt1y, mValueLinePaint);
                        c.drawLine(pt1x, pt1y, pt2x, pt2y, mValueLinePaint);
                    }

                    // draw everything, depending on settings
                    if (drawXOutside && drawYOutside) {

                        drawValue(c, formattedValue, labelPtx, labelPty, dataSet.getValueTextColor(j));

                        if (j < data.getEntryCount() && entryLabel != null) {
                            drawEntryLabel(c, entryLabel, labelPtx, labelPty + lineHeight);
                        }

                    } else if (drawXOutside) {
                        if (j < data.getEntryCount() && entryLabel != null) {
                            drawEntryLabel(c, entryLabel, labelPtx, labelPty + lineHeight / 2.f);
                        }
                    } else if (drawYOutside) {

                        drawValue(c, formattedValue, labelPtx, labelPty + lineHeight / 2.f, dataSet.getValueTextColor(j));
                    }
                }

                if (drawXInside || drawYInside) {
                    // calculate the text position
                    float x = labelRadius * sliceXBase + center.x;
                    float y = labelRadius * sliceYBase + center.y;

                    mValuePaint.setTextAlign(Paint.Align.CENTER);

                    // draw everything, depending on settings
                    if (drawXInside && drawYInside) {

                        drawValue(c, formattedValue, x, y, dataSet.getValueTextColor(j));

                        if (j < data.getEntryCount() && entryLabel != null) {
                            drawEntryLabel(c, entryLabel, x, y + lineHeight);
                        }

                    } else if (drawXInside) {
                        if (j < data.getEntryCount() && entryLabel != null) {
                            drawEntryLabel(c, entryLabel, x, y + lineHeight / 2f);
                        }
                    } else if (drawYInside) {
                        drawValue(c, formattedValue, x, y + lineHeight / 2f, dataSet.getValueTextColor(j));
                    }
                }

                if (entry.getIcon() != null && dataSet.isDrawIconsEnabled()) {

                    Drawable icon = entry.getIcon();


                    float x = (labelRadius + iconsOffset.y) * sliceXBase + center.x;
                    float y = (labelRadius + iconsOffset.y) * sliceYBase + center.y;
                    y += iconsOffset.x;

                    Utils.drawImage(
                            c,
                            icon,
                            (int)x,
                            (int)y,
                            icon.getIntrinsicWidth(),
                            icon.getIntrinsicHeight());
                }

                xIndex++;
            }

            MPPointF.recycleInstance(iconsOffset);
        }
        MPPointF.recycleInstance(center);
        c.restore();
    }
}
2,自定义PieChart
package com.example.cashbook.custom;

import android.content.Context;
import android.util.AttributeSet;
import com.github.mikephil.charting.charts.PieChart;

/**
 * @author wh445306
 * @version 1.0
 * @Description MyPieChart
 * @Date 2023-06-13 1:43
 */

public class MyPieChart extends PieChart {

    public MyPieChart(Context context) {
        super(context);
    }

    public MyPieChart(Context context, AttributeSet attrs) {
        super(context, attrs);
    }

    public MyPieChart(Context context, AttributeSet attrs, int defStyle) {
        super(context, attrs, defStyle);
    }

    @Override
    protected void init() {
        super.init();
        //此处把mRenderer替换成我们自己的PieChartRenderer
        mRenderer = new PieChartCustomRendederer(this, mAnimator, mViewPortHandler);
    }
}
3,使用:
        <com.xxxx.xxxx.custom.MyPieChart
                android:id="@+id/piePayChart"
                android:layout_width="match_parent"
                android:layout_height="180dp"
                android:layout_marginTop="5dp"/>
说明:本着资源共享,部分代码参考网友的,局部做了修改完善,转载需注明出处,谢谢