目录
(一)告警自愈实现详解
上一期我们在讲解夜莺的页面web功能的时候,提到了夜莺的一个强大功能---告警自愈,这一期我们先补充一下上一期没有实现出来的告警自愈的模块。我使用一个案例来告诉帮助大家怎么快速入门ibex夜莺的告警自愈功能。
ibex是夜莺默认的一个告警自愈模块的一个工具插件,它也是有Server-Agent模式,一个服务端,一个客户端。服务端部署在一台机器上,客户端部署在我们监控的机器主机上。由于categraf秉承着all-in-one的理念,所以已经把ibex Agent端集合合并在了categraf里,直接在categraf里面启动配置就可以了。
夜莺关于告警自愈模块文档:使用 ibex 模块做告警自愈脚本的下发执行
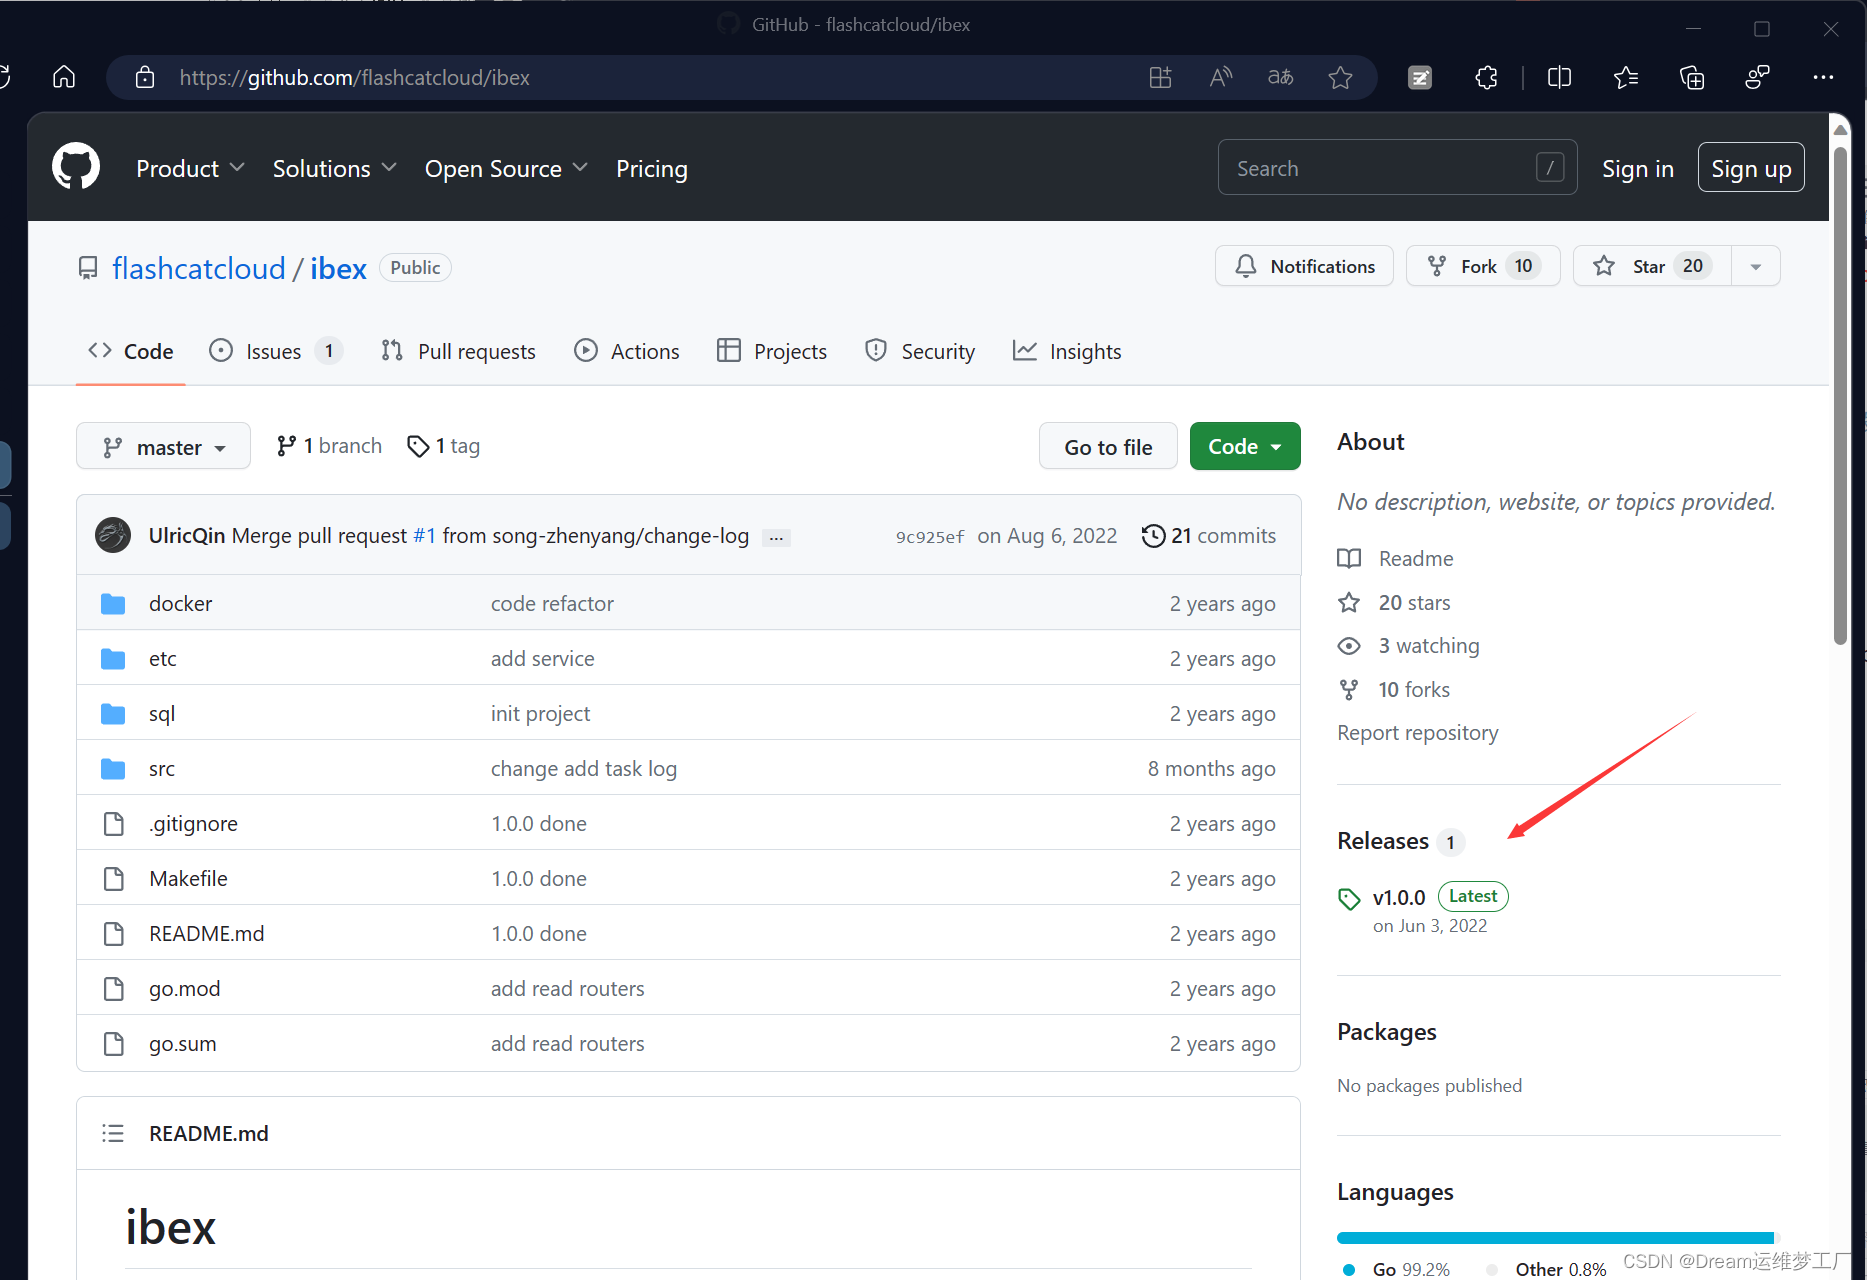
ibex项目下载地址:GitHub - flashcatcloud/ibex
(1):下载安装ibex,配置server端
我们先打开github项目地址 GitHub - flashcatcloud/ibex下载好ibex的安装包
下载好以后我们把安装包上传到我们的server端,然后解压,agent端不用安装,因为安装了categraf,categraf集成了agent端配置

tar xf ibex-1.0.0.tar.gz -C /opt
cd /opt/ibex
mysql < sql/ibex.sql    ##初始化sql
ibex 没有 web 页面,只提供 api 接口,鉴权方式是 http basic auth,basic auth 的用户名和密码默认都是 ibex,在 etc/server.conf 中可以找到,如果ibex 部署在互联网,一定要修改默认用户名和密码,当然,因为 Nightingale 要调用 ibex,所以 Nightingale 的 server.conf 和 webapi.conf 中也配置了 ibex 的 basic auth 账号信息,要改就要一起改啦。
vim /opt/ibex/etc/server.conf
##这里面的很多配置可以根据自己的实际需求进行配置修改,比如mysql的地址,ibex启动的端口,RBC端口地址等 这里的BasicAuth默认的账号密码默认都是ibex,这里要记住如果要修改的话,因为后面在夜莺的页面配置告警自愈功能的时候,需要添加正确的ibex的账号密码和server端的地址端口。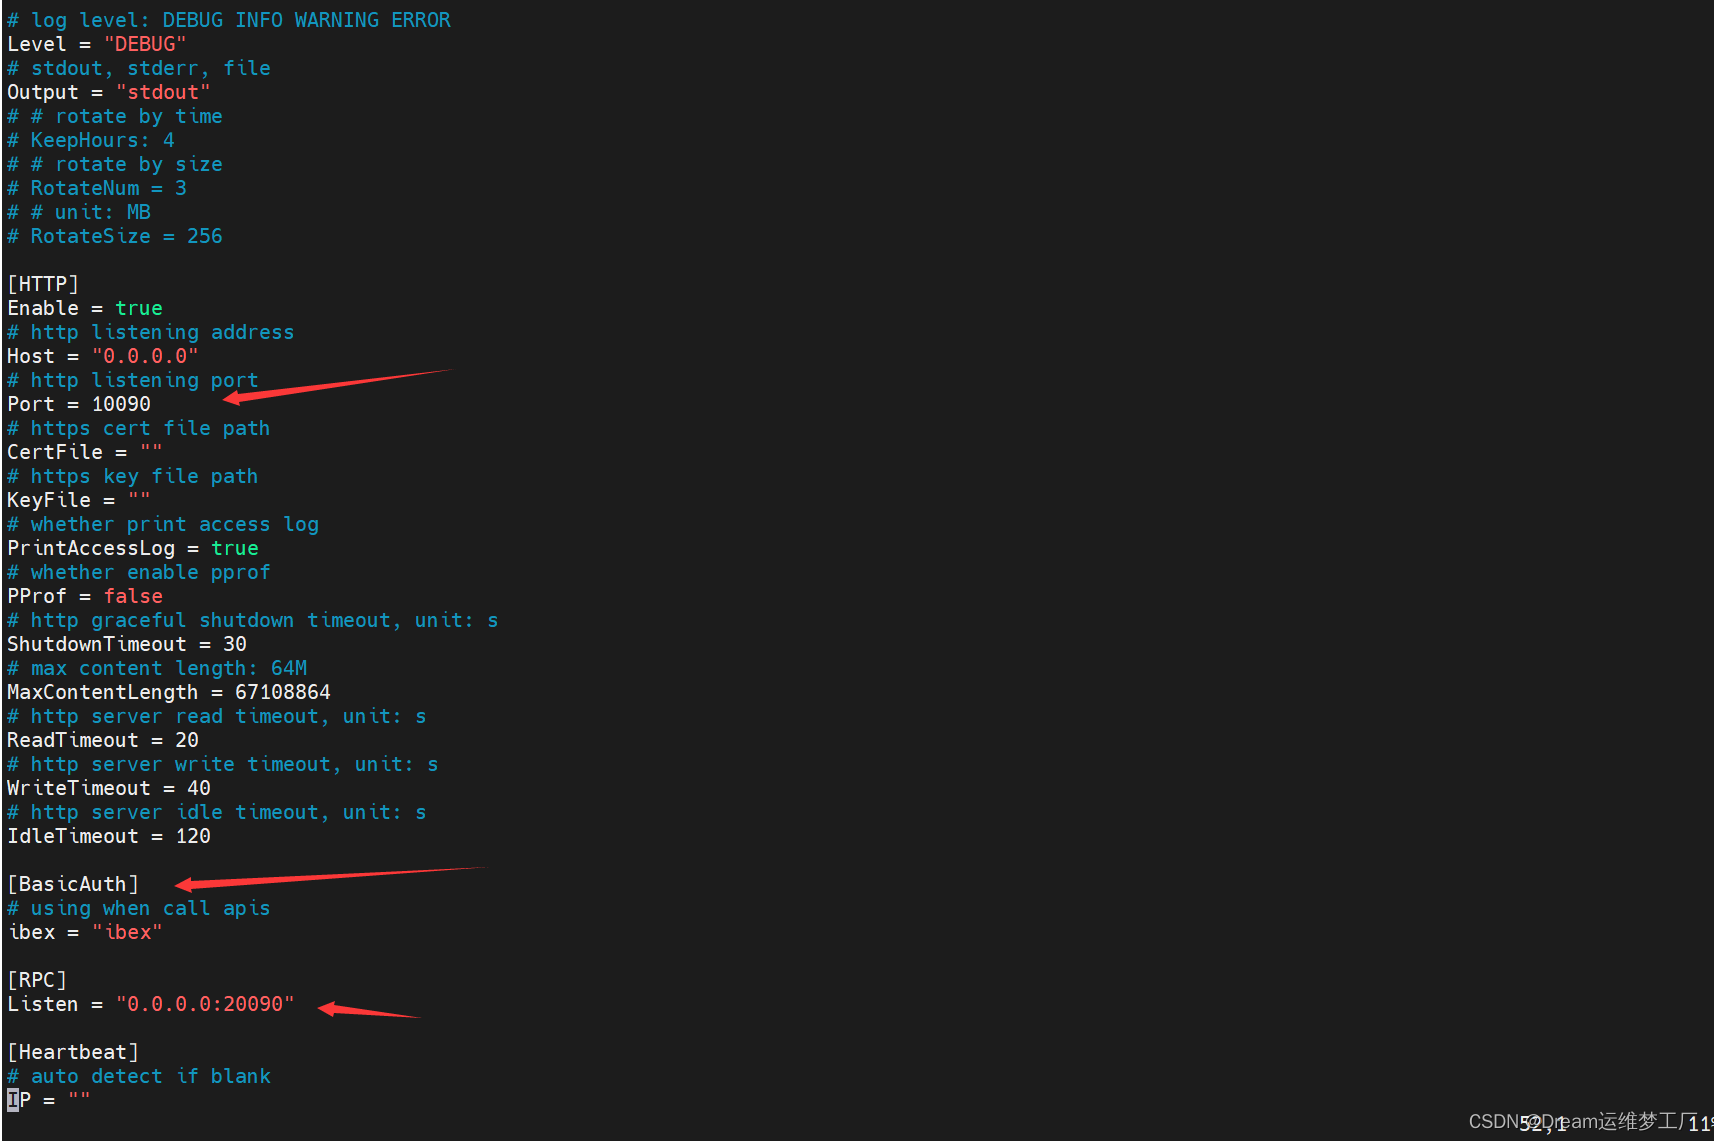
做好这一切后如果觉得没问题可以直接启动ibex server端服务了,启动后会在本机暴露两个端口地址一个是10090端口是server端启动的默认端口,一个是20090是RPC远程过渡调用协议的端口,用于agent端与server端直接的互相通信。
nohup ./ibex server &> server.log &

## 这里启动可以使用nohup和system启动,如果应用与生产环境或者经常使用可以使用systemctl来启动或者控制服务。这个server文件的模板在ibex的安装包里面也提供了 /opt/ibex/etc/service 在这里面有两个service的文件模板即可。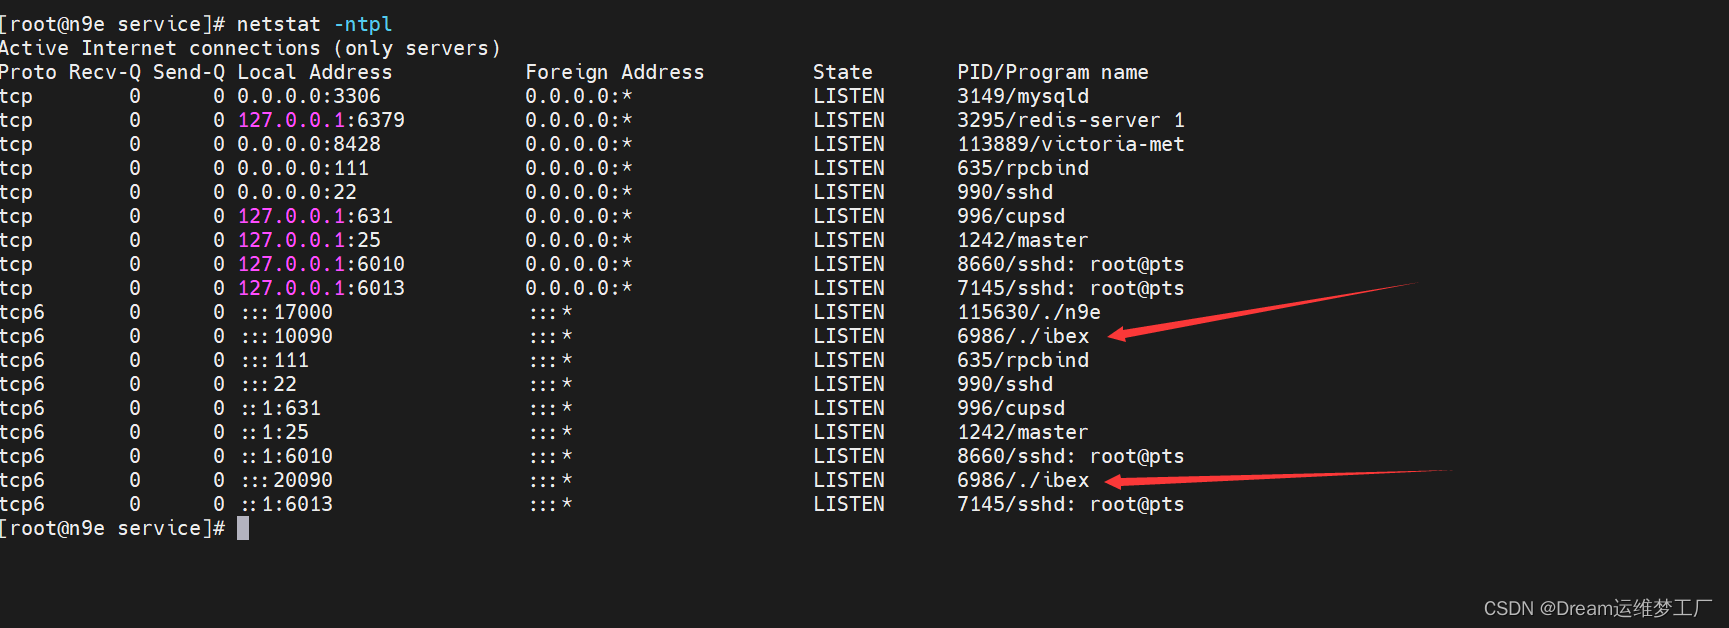
(2):配置ibex-agent端
上面也说过,ibex的agent端已经集合到了categraf最新版本中,所以我们不需要额外的去下载安装ibex,直接在我们需要监控的主机上安装好categraf进入categraf的配置文件配置即可,categraf不会安装的可以看一下我第一期关于夜莺的文章,里面详细的说明安装部署。
vim //opt/categraf/conf/config.toml
.....
.....
[http]
enable = false
address = ":9100"
print_access = false
run_mode = "release"

[ibex]
enable = true            ##把这里的false改为true
## ibex flush interval
interval = "1000ms"
## n9e ibex server rpc address
servers = ["192.168.120.17:20090"]         ##这里的地址改为ibex server端的RPC端口地址。
## temp script dir
meta_dir = "./meta"

[heartbeat]
enable = true
这里只需要修改两处,一个是开启ibex告警自愈的功能,一个是添加ibex server端的地址,使得server和agent直接能通信。更改好以后重启categraf即可。
(2):验证ibex告警自愈功能
打开n9e的web页面,配置ibex模板。系统配置->通知模板->告警自愈
Address:是ibex-server端的IP地址: 端口不要弄错,ibex默认的server端的端口是10090
BasicAuthUser和BasicAuthUser:ibex的配置文件里面设置的basic的账号密码,默认的是ibex,如果修改了文件里的这个字段,需要在这里声明修改
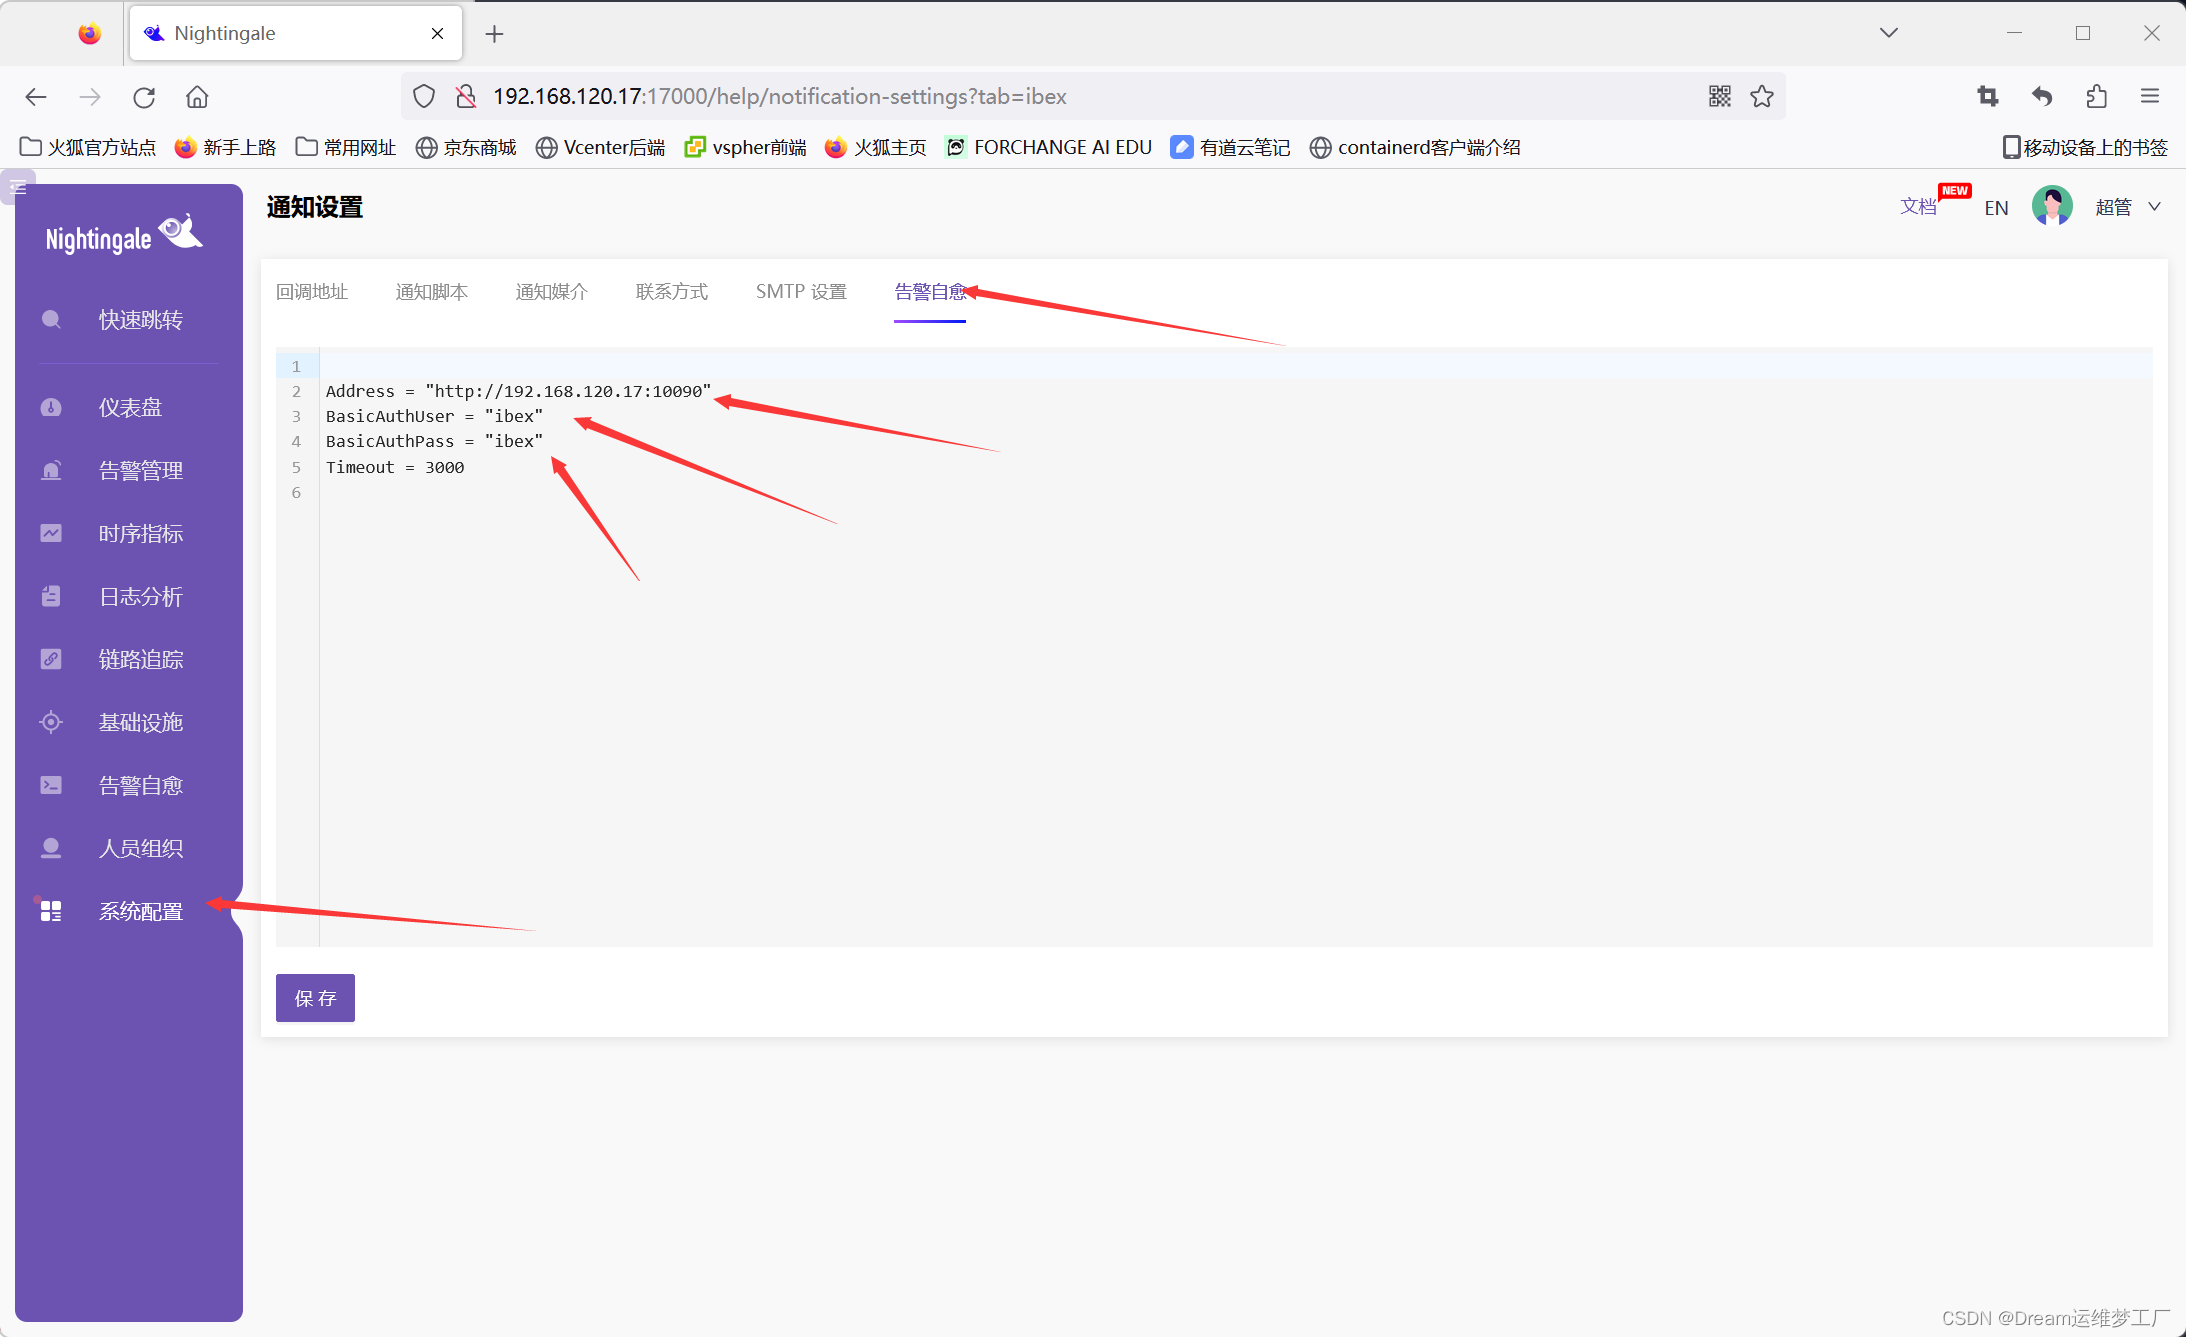
配置完成后我们要记得保存。
测试告警自愈功能:告警自愈->执行历史->创建临时任务。
这里我们是为了测试一下告警自愈功能,所以我们直接创建一个临时的任务,让他在agent上进行自愈功能,当然如果要应用到告警规则里面也是可以的,具体在告警规则里面怎么配置,可以去查看我的上一篇文章夜莺(Flashcat)V6监控(二):夜莺页面全网最详细功能介绍及案列_博客 在这里面我详细说明了告警规则和告警自愈的功能介绍和使用。


Title: 给告警自愈取一个名字
Hosts:这里的机器列表必须是我们categraf数据上传到n9e的机器的主机名,在基础设施->机器列表里面查看我们上传到的主机名。这里标签就是我们categraf监控的主机的主机名hostsname

Script:我们要执行的告警自愈的脚本内容

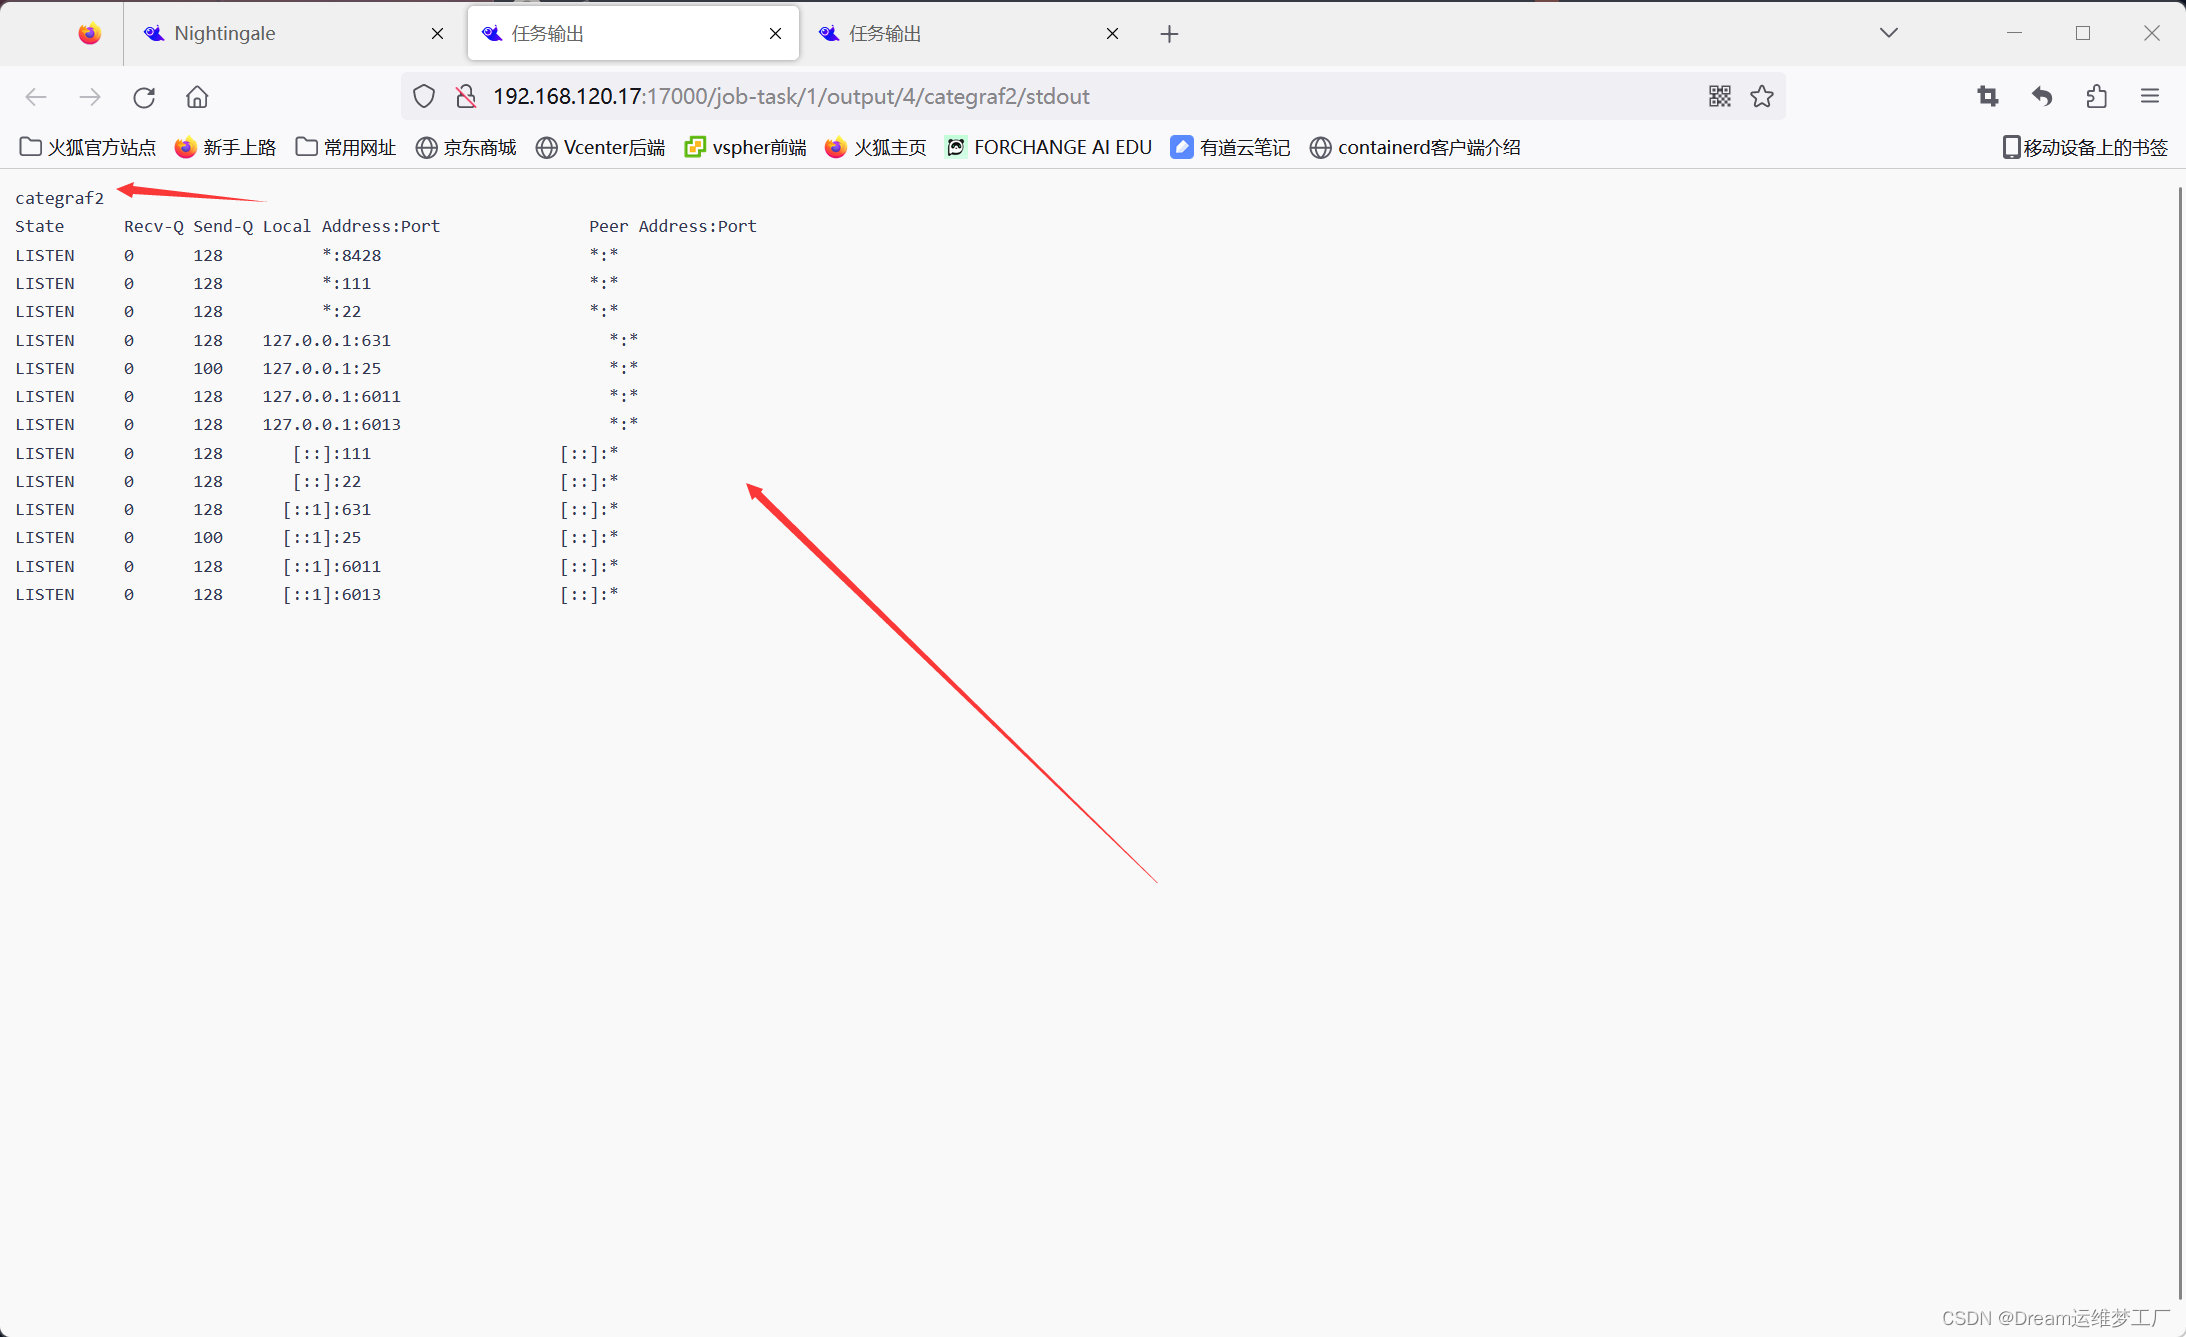
这样我们就能看到我们告警自愈后脚本的内容了 !
(二)categraf (all-in-one)详解解剖
categraf的github地址:GitHub - flashcatcloud/categraf: for nightingale
categraf官方文件: Categraf 项目简介 - 快猫星云 (flashcat.cloud)
Categraf 是一个监控采集 Agent,类似 Telegraf、Grafana-Agent、Datadog-Agent,希望对所有常见监控对象提供监控数据采集能力,采用 All-in-one 的设计,不但支持指标采集,也希望支持日志和调用链路的数据采集。来自快猫研发团队,和 Open-Falcon、Nightingale 的研发是一拨人,是快猫星云自主研发的一个监控采集器。也是Go代码编写的,静态编译依赖少,容易分发,易于安装
为了让大家更直观的了解认识categraf这个采集器,我这里举一个例子:
当我们使用Prometheus来部署监控的时候,比如我们要监控一个MySQL的主从数据库的数据,我们就要去先去官网下载一个专门用于监控MySQL的export,然后再安装这个export再配置。先不说安装一个,万一我们要监控的指标有10个,20个,30个,比如我们要监控kafka,mysql,zookeeper等一些指标,那么我们如果用Prometheus的话就要去下载对应的这些监控指标的exporter,部署成本,维护成本,学习成本也很多,不同exporter我们就要去学习不同的配置方法,很费时。
那么!有没有一种采集器或者工具能直接把这些exporter都集合,ALL-in-one的方式,咱们拿来直接打开即用,当然那必须的有,那就是categraf!categraf集成了大大小小几十个监控指标,我们如果要使用对应的插件监控只需要进入配置文件打开即可。
接下来咱直接进入正题,讲一下categraf这个工具的一些使用,插件的使用,指标在哪里配置
当我们安装好categraf以后,会有二个文件:一个是categraf,conf文件夹。categraf是程序启动文件,conf里面就包含了所有的插件配置文件:
config.toml: 主配置文件
logs.toml: logs-agent配置
prometheus.toml:prometheus agent配置
traces.yaml: tracs-agent配置
config/input/.toml:插件配置文件

(1) 主配置config.toml文件详解:
[global]
# 是否打印配置内容
print_configs = false

# 机器名,作为本机的唯一标识,会为时序数据自动附加一个 agent_hostname=$hostname 的标签
# hostname 配置如果为空,自动取本机的机器名
# hostname 配置如果不为空,就使用用户配置的内容作为hostname
# 用户配置的hostname字符串中,可以包含变量,目前支持两个变量,
# $hostname 和 $ip,如果字符串中出现这两个变量,就会自动替换
# $hostname 自动替换为本机机器名,$ip 自动替换为本机IP
# 建议大家使用 --test 做一下测试,看看输出的内容是否符合预期
# 这里配置的内容,再--test模式下,会显示为 agent_hostname=xxx 的标签
hostname = ""

# 是否忽略主机名的标签,如果设置为true,时序数据中就不会自动附加agent_hostname=$hostname 的标签
omit_hostname = false

# 时序数据的时间戳使用ms还是s,默认是ms,是因为remote write协议使用ms作为时间戳的单位
precision = "ms"

# 全局采集频率,15秒采集一次
interval = 15

# 配置文件来源,目前支持local和http两种配置,如果配置为local就读取本地的配置,如果配置为http,需要在[http]模块配置http来源
providers = ["local"]


# 全局附加标签,一行一个,这些写的标签会自动附到时序数据上
# [global.labels]
# region = "shanghai"
# env = "localhost"

# 日志模块
[log]
# 默认的log输出,到标准输出(stdout)
# 如果指定为文件, 则写入到指定的文件中
file_name = "stdout"

# 当日志输出到文件时该配置生效,用于限制日志文件大小
max_size = 100
# 日志保留天数
max_age = 1
# 备份日志个数
max_backups = 1
# 是否使用本地时间格式化日志
local_time = true
# 是否用gzip对日志进行压缩
compress = false

# 发给后端的时序数据,会先被扔到 categraf 内存队列里,每个采集插件一个队列
# chan_size 定义了队列最大长度
# batch 是每次从队列中取多少条,发送给后端backend
[writer_opt]
batch = 1000
chan_size = 1000000

# 后端backend配置,在toml中 [[]] 表示数组,所以可以配置多个writer
# 每个writer可以有不同的url,不同的basic auth信息
[[writers]]
url = "http://127.0.0.1:17000/prometheus/v1/write"

# 认证用户,默认为空
basic_auth_user = ""

# 认证密码,默认为空
basic_auth_pass = ""

## 请求头信息
# headers = ["X-From", "categraf", "X-Xyz", "abc"]

# 超时配置:单位是 ms
timeout = 5000
dial_timeout = 2500
max_idle_conns_per_host = 100

# 如果providers配置为http,就需要在这个地方进行配置
[http]
# 是否开启
enable = false
# 地址信息
address = ":9100"
print_access = false
run_mode = "release"

# ibex配置,用于配置ibex-server的地址,用于实现故障自愈
[ibex]
enable = false
## ibex刷新频率
interval = "1000ms"
## ibex server 地址
servers = ["127.0.0.1:20090"]
## 脚本临时保存目录
meta_dir = "./meta"

# 心跳上报给n9e
[heartbeat]
enable = true

# 上报 os version cpu.util mem.util 等元信息
url = "http://127.0.0.1:17000/v1/n9e/heartbeat"

# 上报频率,单位是 s
interval = 10

# 认证用户
basic_auth_user = ""

# 认证密码
basic_auth_pass = ""

## header 头信息
# headers = ["X-From", "categraf", "X-Xyz", "abc"]

# 超时配置,单位 ms
timeout = 5000
dial_timeout = 2500
max_idle_conns_per_host = 100我再说一下这里的input文件夹,这里面的每一个input文件就是一个监控指标插件,比如我们要收集kafka的数据,只需进入input.kafka文件夹里面,编辑toml配置文件,配置instances字段,当我们如果有多台kafka的时候,只需要复制instances字段下面的所有内容,然后再添加一条instances的字段,比如我们这里有两台kafka机器01,02,那我们配置02的时候就只需要复制整段instances字段添加在下面即可,这个配置适用于所有的插件配置instances字段,比如添加多台mysql,zookeeper,也是这样复制整断instance即可
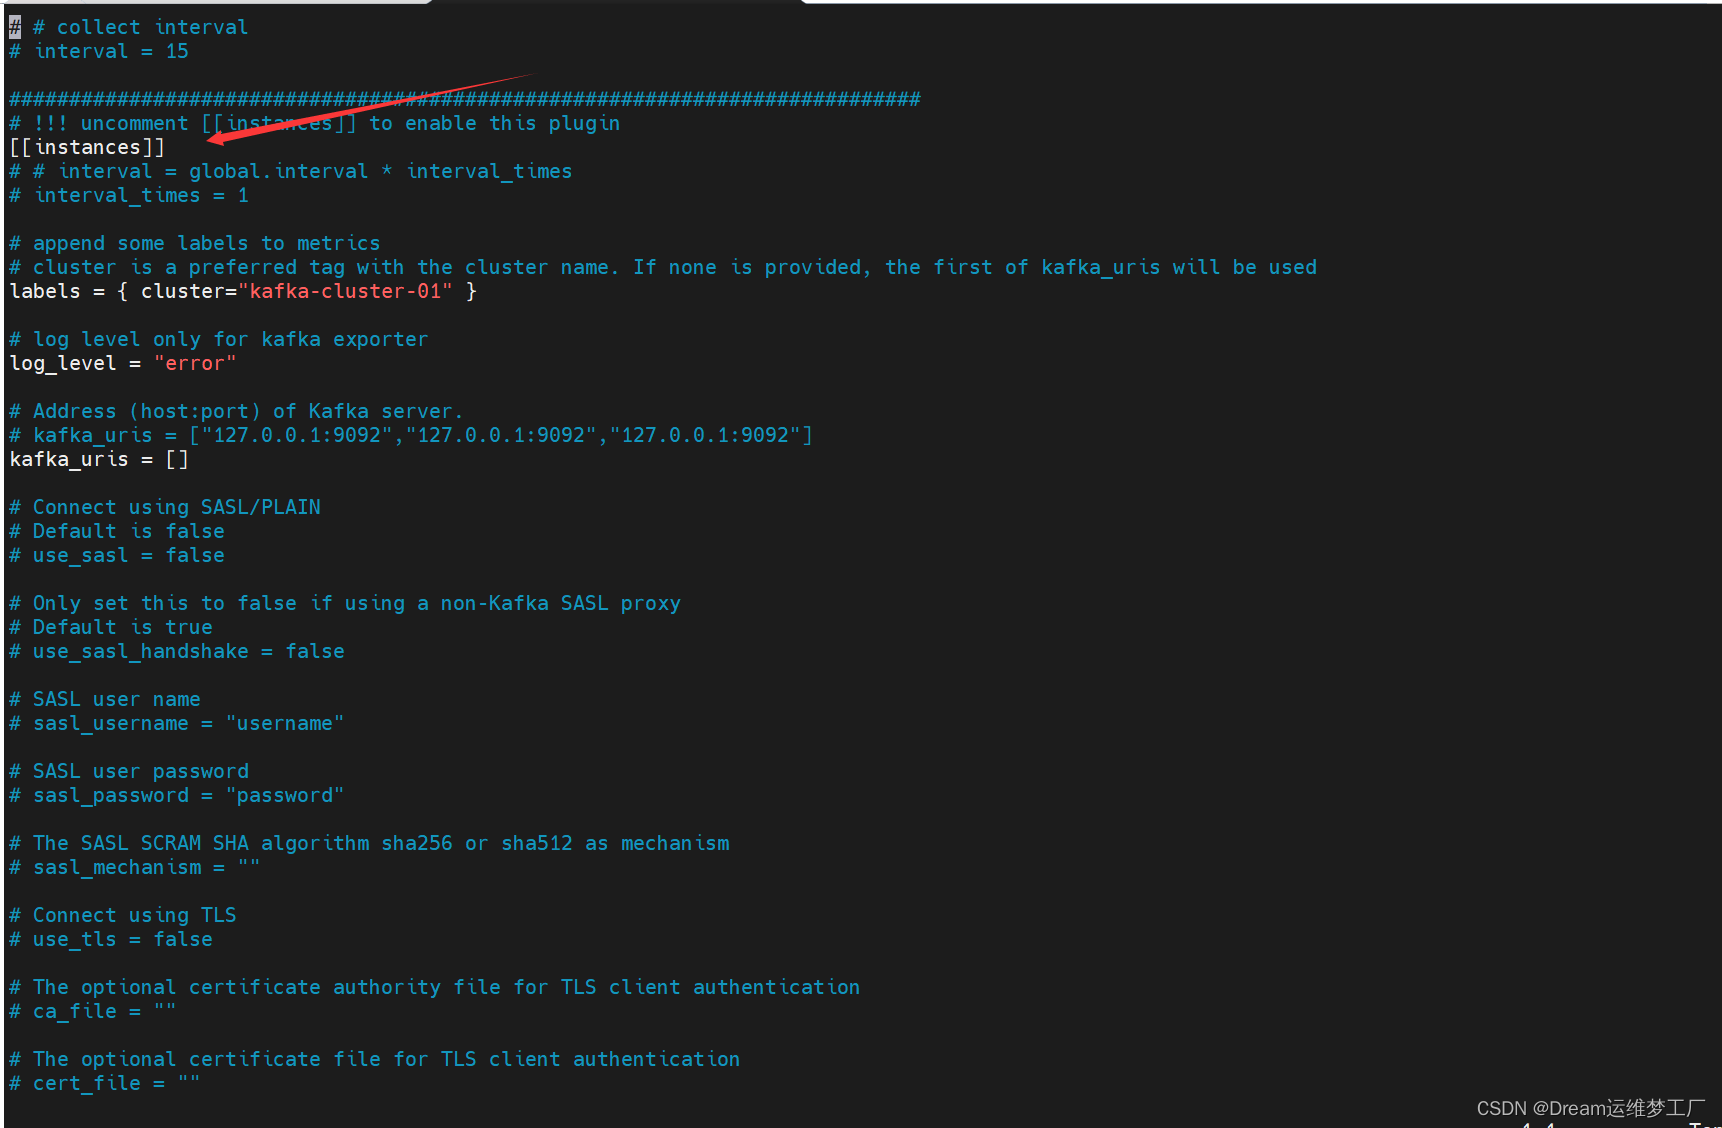
[[instances]]
# # interval = global.interval * interval_times
# interval_times = 1

# append some labels to metrics
# cluster is a preferred tag with the cluster name. If none is provided, the first of kafka_uris will be used
labels = { cluster="kafka-cluster-01" } ## 集群01

# log level only for kafka exporter
log_level = "error"

# Address (host:port) of Kafka server.
# kafka_uris = ["127.0.0.1:9092","127.0.0.1:9092","127.0.0.1:9092"]
kafka_uris = []

# Connect using SASL/PLAIN
# Default is false
# use_sasl = false

# Only set this to false if using a non-Kafka SASL proxy
# Default is true
# use_sasl_handshake = false

# SASL user name
# sasl_username = "username"

# SASL user password
# sasl_password = "password"

# The SASL SCRAM SHA algorithm sha256 or sha512 as mechanism
# sasl_mechanism = ""

# Connect using TLS
# use_tls = false

# The optional certificate authority file for TLS client authentication
# ca_file = ""

# The optional certificate file for TLS client authentication
# cert_file = ""
# The optional certificate file for TLS client authentication
# cert_file = ""

# The optional key file for TLS client authentication
# key_file = ""

# If true, the server's certificate will not be checked for validity. This will make your HTTPS connections insecure
# insecure_skip_verify = true

# Kafka broker version
# Default is 2.0.0
# kafka_version = "2.0.0"

# if you need to use a group from zookeeper
# Default is false
# use_zookeeper_lag = false

# Address array (hosts) of zookeeper server.
# zookeeper_uris = []

# Metadata refresh interval
# Default is 1s
# metadata_refresh_interval = "1m"

# If true, all scrapes will trigger kafka operations otherwise, they will share results. WARN: This should be disabled on large clusters
# Default is false
# allow_concurrency = false

# Maximum number of offsets to store in the interpolation table for a partition
# Default is 1000
# max_offsets = 1000

# How frequently should the interpolation table be pruned, in seconds.
# Default is 30
# prune_interval_seconds = 30

# Regex filter for topics to be monitored
# Default is ".*"
# topics_filter_regex = ".*"

# Regex filter for consumer groups to be monitored
# Default is ".*"
# groups_filter_regex = ".*"


[[instances]]
# # interval = global.interval * interval_times
# interval_times = 1

# append some labels to metrics
# cluster is a preferred tag with the cluster name. If none is provided, the first of kafka_uris will be used
labels = { cluster="kafka-cluster-02" }   ###这里添加一个字段即可复制

# log level only for kafka exporter
log_level = "error"

# Address (host:port) of Kafka server.
# kafka_uris = ["127.0.0.1:9092","127.0.0.1:9092","127.0.0.1:9092"]
kafka_uris = []

# Connect using SASL/PLAIN
# Default is false
# use_sasl = false

# Only set this to false if using a non-Kafka SASL proxy
# Default is true
# use_sasl_handshake = false

# SASL user name
# sasl_username = "username"

# SASL user password
# sasl_password = "password"

# The SASL SCRAM SHA algorithm sha256 or sha512 as mechanism
# sasl_mechanism = ""

# Connect using TLS
# use_tls = false

# The optional certificate authority file for TLS client authentication
# ca_file = ""

# The optional certificate file for TLS client authentication
# cert_file = ""
# The optional certificate file for TLS client authentication
# cert_file = ""

# The optional key file for TLS client authentication
# key_file = ""

# If true, the server's certificate will not be checked for validity. This will make your HTTPS connections insecure
# insecure_skip_verify = true

# Kafka broker version
# Default is 2.0.0
# kafka_version = "2.0.0"

# if you need to use a group from zookeeper
# Default is false
# use_zookeeper_lag = false

# Address array (hosts) of zookeeper server.
# zookeeper_uris = []

# Metadata refresh interval
# Default is 1s
# metadata_refresh_interval = "1m"

# If true, all scrapes will trigger kafka operations otherwise, they will share results. WARN: This should be disabled on large clusters
# Default is false
# allow_concurrency = false

# Maximum number of offsets to store in the interpolation table for a partition
# Default is 1000
# max_offsets = 1000

# How frequently should the interpolation table be pruned, in seconds.
# Default is 30
# prune_interval_seconds = 30

# Regex filter for topics to be monitored
# Default is ".*"
# topics_filter_regex = ".*"

# Regex filter for consumer groups to be monitored
# Default is ".*"
# groups_filter_regex = ".*"
(2)logs.toml配置详解
[logs]
# api_key http模式下生效,用于鉴权, 其他模式下占位符
api_key =
# 是否开启log-agent
enable = false
# 日志接收地址,可以配置tcp、http以及kafka
send_to = "127.0.0.1:17878"
# 日志发送协议:http/tcp/kafka
send_type = "http"
# kafka模式下的topic
topic = "flashcatcloud"
# 是否进行压缩
use_compress = false
# 是否使用tls
send_with_tls = false
# 批量发送的等待时间
batch_wait = 5
# 日志偏移量记录,用于断点续传
run_path = "/opt/categraf/run"
# 最大打开文件数
open_files_limit = 100
# 扫描目录日志评论
scan_period = 10
# udp采集的buffer大小
frame_size = 9000

# 是否采集pod的stdout/stderr日志
collect_container_all = true
  # 全局处理规则, 该处不支持多行合并。多行日志合并需要在logs.items中配置
  # [[logs.Processing_rules]]
  # 日志采集配置
  [[logs.items]]
  # 日志类型,支持file/journald/tcp/udp
  type = "file"
  # 日志路径,支持统配符,用统配符,默认从最新位置开始采集
  ## 如果类型是file,则必须配置具体的路径; 如果类似是journald/tcp/udp,则配置端口
  path = "/opt/tomcat/logs/*.txt"
  # 日志的label 标识日志来源的模块
  source = "tomcat"
  # 日志的label 标识日志来源的服务
service = "my_service"其中,日志采集规则可以在全部logs.Processing_rules中配置,也可以在logs.items.logs_processing_rules中进行配置。
规则类型主要分为以下几种:
-
exclude_at_match:表示不发送匹配到的日志行
-
include_at_match:表示只发送匹配到的日志行
-
mask_sequences:可以在日志发送前对日志进行处理,比如替换日志内容
-
multi_line:多行合并,不支持全局配置
(1)不发送匹配到的日志行
type = "exclude_at_match"
name = "exclude_xxx_users"
pattern="\\[email protected]"
表示日志中匹配到@flashcat.cloud 的行 不发送
(2)只发送匹配到的日志行
type = "include_at_match"
name = "include_demo"
pattern="^2022*"
表示日志中匹配到2022开头的行 才发送
(3)对日志内容进行替换处理
type = "mask_sequences"
name = "mask_phone_number"
replace_placeholder = "[186xxx]"
pattern="186\\d{8}"
表示186的手机号会被[186xxx] 代替
(4)多行合并
type = "multi_line"
name = "new_line_with_date"
pattern="\\d{4}-\\d{2}-\\d{2}" (多行规则不需要添加^ ,代码会自动添加)
表示以日期为日志的开头,多行的日志合并为一行进行采集
(3)prometheus.toml配置详解
Categraf 本身以及可以完成很多指标的采集,如果你本身已经有了完整的 Promtheus 体系,但是想用 N9e,Categraf 也支持采集 Prometheus 指标。
[prometheus]
# 是否启动prometheus agent
enable=false
# 原来prometheus的配置文件
# 或者新建一个prometheus格式的配置文件
scrape_config_file="/path/to/in_cluster_scrape.yaml"
## 日志级别,支持 debug | warn | info | error
log_level="info"
# 以下配置文件,保持默认就好了
## wal file storage path ,default ./data-agent
# wal_storage_path="/path/to/storage"
## wal reserve time duration, default value is 2 hour
# wal_min_duration=2
比如这里配置 Prometheus 自动采集 kube-state-metrics 指标的 scrape 配置:
global:
  scrape_interval: 15s
  external_labels:
    scraper: ksm-test
    cluster: test
scrape_configs:
  - job_name: "kube-state-metrics"
    metrics_path: "/metrics"
    kubernetes_sd_configs:
      - role: endpoints
        api_server: "https://172.31.0.1:443"
        tls_config:
          ca_file: /etc/kubernetes/pki/ca.crt
          cert_file: /etc/kubernetes/pki/apiserver-kubelet-client.crt
          key_file: /etc/kubernetes/pki/apiserver-kubelet-client.key
          insecure_skip_verify: true
    scheme: http
    relabel_configs:
      - source_labels:
          [
            __meta_kubernetes_namespace,
            __meta_kubernetes_service_name,
            __meta_kubernetes_endpoint_port_name,
          ]
        action: keep
        regex: kube-system;kube-state-metrics;http-metrics

remote_write:
- url: "http://172.31.62.213/prometheus/v1/write"然后在prometheus.toml配置中使用scrape_config_file加载上面的文件即可。
本期文章讲解初步写到这就结束了关于categraf,当然我这文章写的肯定没有写完很多一些设置,我把大家在日常可能经常使用的功能讲解了一下,更多的关于这个神奇categarf的一些详情文档还有一些配置插件大家可以查看categraf的github托管项目,里面包含了很多一些关于插件或者说一些关于n9e仪表盘的json文件等等GitHub - flashcatcloud/categraf: collector for nightingale
如果对categraf还有n9e的一些用法配置,可以去查看我前面两篇文章可以带大家入门更快的了解夜莺体系 夜莺(Flashcat)V6监控(一):介绍及其部署_夜莺部署_Dream运维梦工厂的博客-CSDN博客
夜莺(Flashcat)V6监控(二):夜莺页面全网最详细功能介绍及案列_Dream运维梦工厂的博客-CSDN博客
后面还会继续更新,带大家从0到1更加充分的认识夜莺产品这个国产监控之光,开持续更新这个专栏,希望大家继续关注