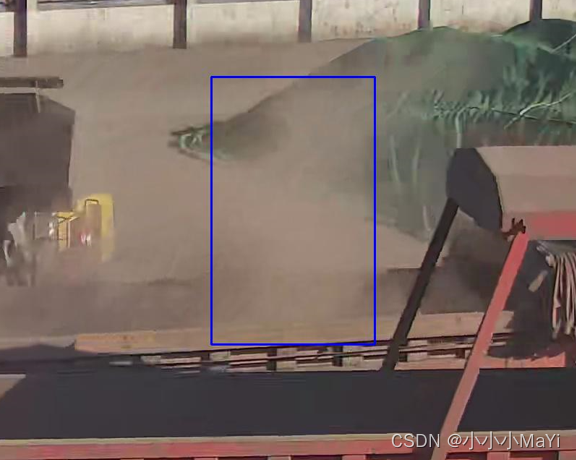
根据Labelimg生成的YOLO标签(txt文件),在原图中画出待检测目标的矩形框。蓝色为标记矩形框。
1、数据要求
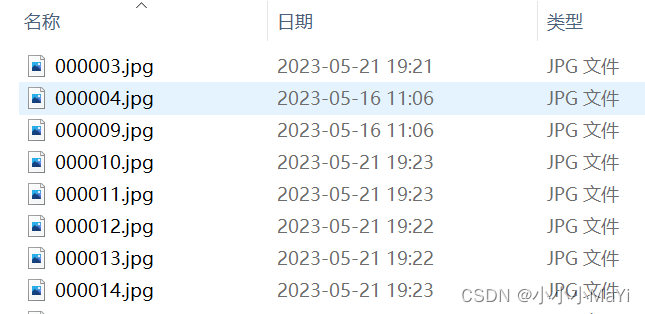
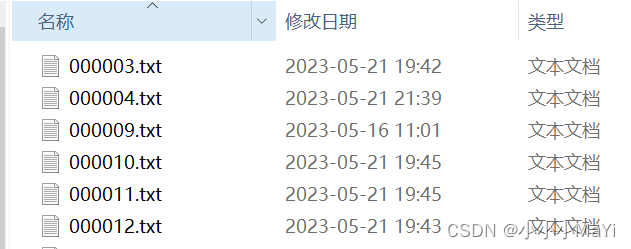
需要以下三个文件夹

1、images文件夹:原图像(格式统一)
2、labels文件夹:标签(txt文件)
3、img_labels文件夹(空):带矩形框标记的原图(格式统一)
Labelme生成的标签txt
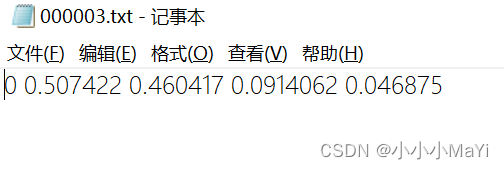
五个值分别代表:类别,中心点横坐标,中心点纵坐标,检测框的宽,检测框的高。其中后四个数值都是经过归一化处理,为0-1的小数。
代码如下:
只需要修改对应数据集的路径
#由原标签得出检测矩形框左上角和右下角的坐标分别为:xmin,ymin,xmax,ymax
def Xmin_Xmax_Ymin_Ymax(img_path, txt_path):
    """
    :param img_path: 图片文件的路径
    :param txt_path: 标签文件的路径
    :return:
    """
    img = cv2.imread(img_path)
    # 获取图片的高宽
    h, w, _ = img.shape
    # 读取TXT文件 中的中心坐标和框大小
    with open(txt_path, "r") as fp:
        # 以空格划分
        contline = fp.readline().split(' ')
    if len(contline)>1:
        # 计算框的左上角坐标和右下角坐标,使用strip将首尾空格去掉
        xmin = float((contline[1]).strip()) - float(contline[3].strip()) / 2
        xmax = float(contline[1].strip()) + float(contline[3].strip()) / 2

        ymin = float(contline[2].strip()) - float(contline[4].strip()) / 2
        ymax = float(contline[2].strip()) + float(contline[4].strip()) / 2

        # 将坐标(0-1之间的值)还原回在图片中实际的坐标位置
        xmin, xmax = w * xmin, w * xmax
        ymin, ymax = h * ymin, h * ymax

        return (contline[0], xmin, ymin, xmax, ymax)
    else:
        return (0, 0, 0, 2, 2)
#根据label坐标画出目标框
def plot_tangle():
    images = r'F:\nanana\522\images\*.jpg'
    for img_path in glob.glob(images):

        if os.path.exists(img_path.replace('images','img_label'))==False:
            print(img_path[-10:-4])
            temp = img_path.replace('images','labels')
            temp = temp.replace('jpg','txt')
            cl, xmin, ymin, xmax, ymax= Xmin_Xmax_Ymin_Ymax(img_path,temp)
            img = cv2.imread(img_path)
            img = cv2.cvtColor(img,cv2.COLOR_BGR2RGB)
            cv2.rectangle(img, (int(xmin), int(ymin)), (int(xmax), int(ymax)), (0, 0, 255), 2)
            temp = img_path.replace('images','img_label')
            plt.imsave(temp,img)
            # plt.imshow(img)
            # plt.show()
if __name__=="__main__":

    plot_tangle()
    pass