使用 WPF 的 SPC 控制图工具,将变量控制图(X-Bar R、X-Bar Sigma、单个范围、中值范围、EWMA、MA、MAMR、MAMS 和 CuSum 控制图)、属性控制图(p、np、c、u 和 DPMO 控制图)、频率直方图和帕累托图添加到 WPF 和 WPF Web 应用程序中。
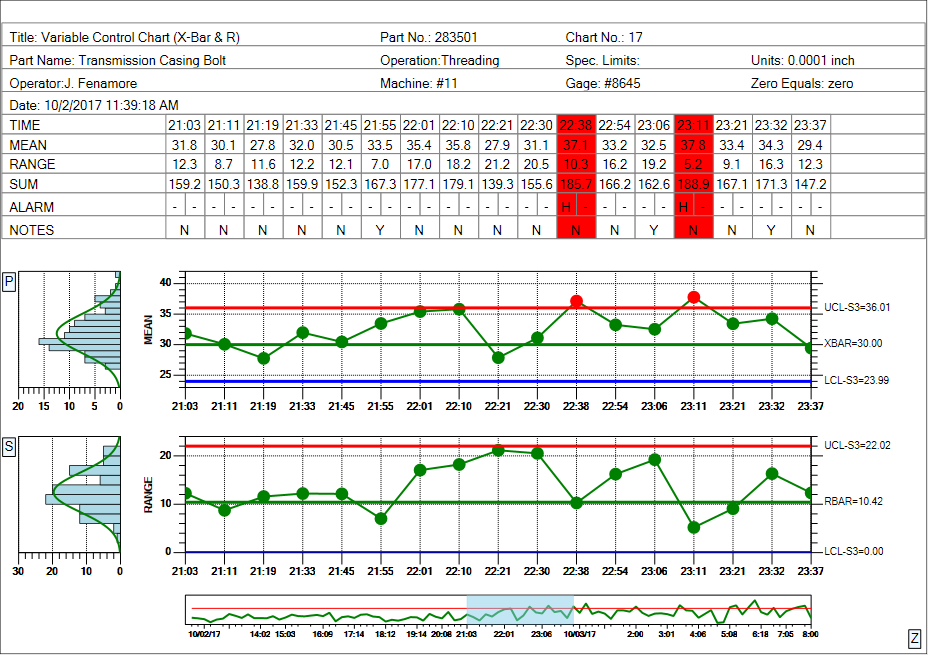
X-Bar R 控制图,具有集成的表格支持、频率直方图、Cpk 和 Ppk 统计以及缩放功能
QCSPCChart SPC 控制图工具 for WPF 软件是一个面向对象的、基于 WPF 的工具包,面向希望将静态和动态质量控制图添加到其 C# for WPF 应用程序的开发人员。
典型用户是 SPC 工程师和其他质量控制专业人员,他们创建基于 WPF 的应用程序,这些应用程序将用于监视制造、加工和服务行业中的关键质量因素。功能丰富的工具包包括最常见的 SPC 控制图类型的模板:变量控制图(X-Bar R、X-Bar 西格玛、单个范围、中位数范围、EWMA、MA、MAMR、MAMS 和 CuSum 控制图)、属性控制图(p、np、c、u 和 DPMO 控制图)、频率直方图、概率图和帕累托图。该软件将使用支持的变量控制图和属性控制图类型的历史数据自动计算SPC控制限。
可以为标准 +3 西格玛控制限或标准 SPC 规则集(WECO、Nelson、Juran、Hughes、Gitlow、AAIG、Westgard 和 Duncan)生成警报。警报可以在 SPC 图表和表格中以颜色突出显示。它还将计算过程能力比(Cp,Cpl,CPU,Cpk和Cpm)和过程性能指数(Pp,Ppl,Ppu和Ppk)。用户可以与图表交互:添加注释、定义自定义工具提示和编辑注释。
主要优势
- 由于对最常见的SPC控制图使用了高级模板,因此开发时间短
- 图表对数据点的数量或时间范围没有限制
- 集成的直方图和表格显示无需编程
- 与数据库集成,因为软件是使用 C# WPF 编写和编程的。
- 通过将软件与 WPF 结合使用,将 SPC 图表添加到您的网站。
- 永远不会错过警报条件,警报可以在图表和表格中突出显示
功能摘要
- Visual Studio 2022 及更高版本 – 从修订版 3.1 开始,我们在 2022 年之前取消了对所有版本的 Visual Studio .Net 的支持。这样,我们不再需要为 .Net 的最低公分母配置库,并且可以使用原始版本中没有的新 .Net 功能。该软件与 Visual Studio 2022 及更高版本兼容。所有示例程序项目都采用 Visual Studio 2022 格式,如果使用更高版本的编译器加载,则会自动转换为该项目的更高版本。标准 DLL 是为 .Net Framework 6 的目标编译的。这意味着它应该与使用该目标或更高版本编写的程序兼容。没有与早期的 .Net 运行时库关联的旧依赖项。我们还删除了所有 Visual Basic 示例项目。我们已经取消了 Asp.Net WebForms项目,因为Visual Studio 2022和.Net 6不再支持创建 Asp.Net WebForms项目。请参阅我们的QCSPCChart for JavaScript / TypeScript,如果您想将图表添加到支持JavaScript的任何类型的网页。
- Windows 32-bit/64-bit Compatible – The software will run as 32-bit on Windows 32-bit operating systems (XP and later 32-bit versions of Windows) and as 64-bit on Windows 64-bit operating systems. This is a feature of programs and libraries written using .Net (Version 2.0 or greater) in general.
- Based on the WPF Retained Graphics Drawing Framework – Compatible with WPF components and applications.
- 100% Managed .Net Code – The software is entirely written in C#, resulting in provide better performance and scalability. Managed .Net code makes applications easier to deploy and maintain.
- New Features in Revision 2.2 – support for Nelson, Juran, Hughes, Gitlow, AAIG, Westgard and Duncan rule sets in addition to the WECO rules. Exisiting rules can be customized, or new rules created using templates. Added MAMR (Moving Average / Moving Range) and MAMS (Moving Average / Moving Sigma), DPMO (Defects per million) charts. As an aid to internationalizations, all of the default (US English language) strings have been moved into a single static class, where they can be initialized at runtime with country specific values.
- New Features in Revision 3.0 – added a Levey-Jennings variable control chart. All charts have been converted to use EventCoordinates. A zoom control can optionally replace the integral scroll bar, permitting the user to customize the x-scale of the display. Toggle buttons can be used to turn on/off the display of the table rows. Enhanced annotations and out of limit symbols. Bad sample interval marking. For a complete list, see this summary sheet: Rev. 3 New Features
- Variable Control Chart Templates -Variable Control Chart Templates – X-Bar R – (Mean and Range), X-Bar Sigma, (Mean and Sigma), Median and Range, X-R (Individual Range Chart), EWMA (exponentially weighted moving average), MA (moving average), MAMR (moving average / moving range), MAMS (moving average / moving sigma) and CuSum. A special version of the X-Bar Sigma chart supports variable sample sub-group sizes.