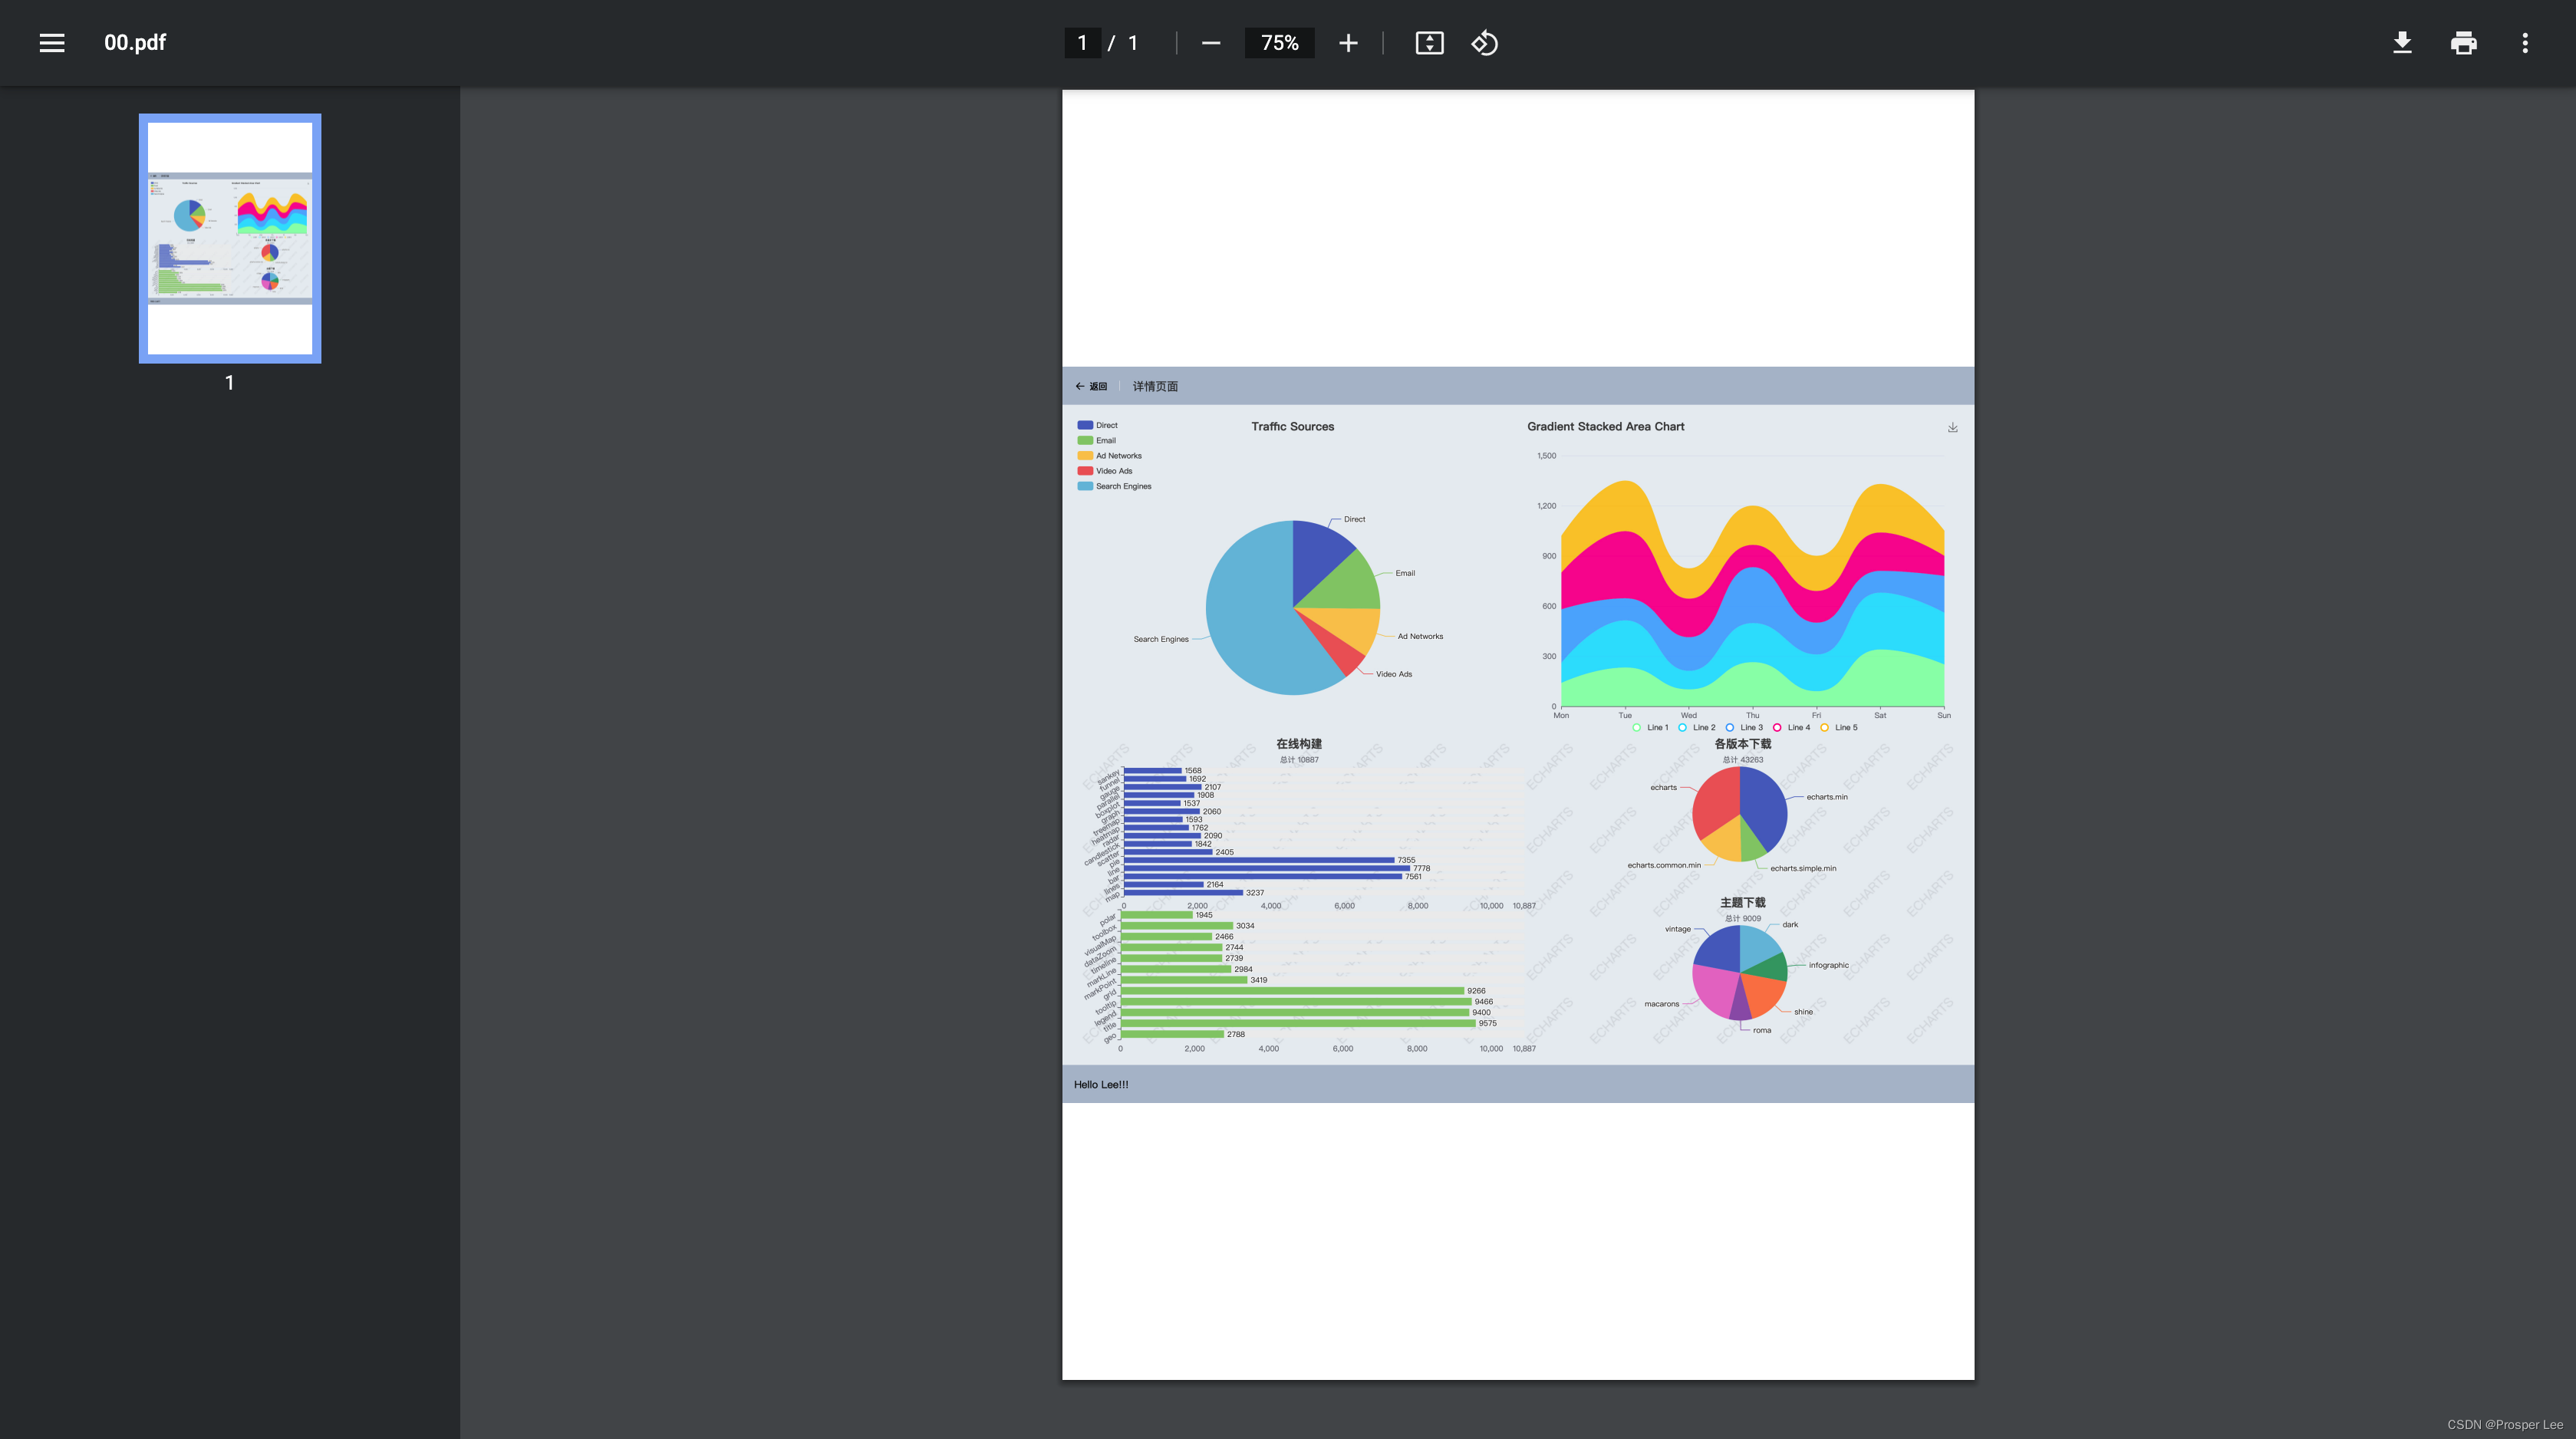
效果
主程序
<el-container ref="PdfPage">
<el-button type="primary" data-html2canvas-ignore='true' @click="printPage">打印</el-button>
<el-main>
<el-row ref="Content" :gutter="20">
......
</el-row>
</el-main>
</el-container>
<script>
import html2canvas from 'html2canvas';
import JsPDF from 'jspdf';
export default {
name: "Home",
methods: {
printPage() {
const elRef = this.$refs['PdfPage'].$el;
const contentRef = this.$refs['Content'].$el;
const options = {
windowHeight: contentRef.clientHeight + 160,
}
html2canvas(elRef, options)
.then(canvas => {
const [w, h] = [595.28, 841.89];
const [cw, ch] = [canvas.width, canvas.height];
const PDF = new JsPDF('p', 'pt', 'a4');
const pageData = canvas.toDataURL('image/jpeg', 1.0);
PDF.addImage(pageData, 'JPEG', 0, (h - ch / (cw / w)) / 2, w, ch / (cw / w));
PDF.save('00.pdf');
})
},
},
}
</script>
源码
<template>
<el-container class="Home">
<el-aside width="240px">
<el-menu default-active="1-4-1" background-color="transparent">
<el-submenu index="1">
<template slot="title">
<i class="el-icon-location"></i>
<span>导航一</span>
</template>
<el-menu-item-group>
<template slot="title">分组一</template>
<el-menu-item index="1-1">选项1</el-menu-item>
<el-menu-item index="1-2">选项2</el-menu-item>
</el-menu-item-group>
<el-menu-item-group title="分组2">
<el-menu-item index="1-3">选项3</el-menu-item>
</el-menu-item-group>
<el-submenu index="1-4">
<template slot="title">选项4</template>
<el-menu-item index="1-4-1">选项1</el-menu-item>
</el-submenu>
</el-submenu>
<el-menu-item index="2">
<i class="el-icon-menu"></i>
<span slot="title">导航二</span>
</el-menu-item>
<el-menu-item index="3">
<i class="el-icon-document"></i>
<span slot="title">导航三</span>
</el-menu-item>
<el-menu-item index="4">
<i class="el-icon-setting"></i>
<span slot="title">导航四</span>
</el-menu-item>
</el-menu>
</el-aside>
<el-container ref="PdfPage">
<el-header>
<el-row type="flex" align="middle">
<el-col :span="20">
<el-page-header content="详情页面" />
</el-col>
<el-col :span="4" align="right">
<el-button type="primary" data-html2canvas-ignore='true' @click="printPage">打印</el-button>
</el-col>
</el-row>
</el-header>
<el-main>
<el-row ref="Content" :gutter="20">
<el-col :span="12">
<v-chart class="chart" :option="option1" autoresize />
</el-col>
<el-col :span="12">
<v-chart class="chart" :option="option2" autoresize />
</el-col>
<el-col :span="24">
<v-chart class="chart" :option="option3" autoresize />
</el-col>
</el-row>
</el-main>
<el-footer>Hello Lee!!!</el-footer>
</el-container>
</el-container>
</template>
<script>
import {
use } from "echarts/core";
import {
CanvasRenderer } from "echarts/renderers";
import {
PieChart, LineChart, BarChart } from "echarts/charts";
import {
TitleComponent,
TooltipComponent,
LegendComponent,
ToolboxComponent,
GridComponent,
} from "echarts/components";
import VChart, {
THEME_KEY } from "vue-echarts";
import html2canvas from 'html2canvas';
import JsPDF from 'jspdf';
export default {
name: "Home",
components: {
VChart
},
provide: {
[THEME_KEY]: "default"
},
data() {
use([
CanvasRenderer,
LineChart,
PieChart,
BarChart,
TitleComponent,
TooltipComponent,
LegendComponent,
ToolboxComponent,
GridComponent,
]);
return {
option1: {
title: {
text: "Traffic Sources",
left: "center"
},
tooltip: {
trigger: "item",
formatter: "{a} <br/>{b} : {c} ({d}%)"
},
legend: {
orient: "vertical",
left: "left",
data: [
"Direct",
"Email",
"Ad Networks",
"Video Ads",
"Search Engines"
]
},
series: [
{
name: "Traffic Sources",
type: "pie",
radius: "55%",
center: ["50%", "60%"],
data: [
{
value: 335, name: "Direct" },
{
value: 310, name: "Email" },
{
value: 234, name: "Ad Networks" },
{
value: 135, name: "Video Ads" },
{
value: 1548, name: "Search Engines" }
],
emphasis: {
itemStyle: {
shadowBlur: 10,
shadowOffsetX: 0,
shadowColor: "rgba(0, 0, 0, 0.5)"
}
}
}
]
},
option2: {
color: ['#80FFA5', '#00DDFF', '#37A2FF', '#FF0087', '#FFBF00'],
title: {
text: 'Gradient Stacked Area Chart'
},
tooltip: {
trigger: 'axis',
axisPointer: {
type: 'cross',
label: {
backgroundColor: '#6a7985'
}
}
},
legend: {
bottom: '0',
data: ['Line 1', 'Line 2', 'Line 3', 'Line 4', 'Line 5']
},
toolbox: {
feature: {
saveAsImage: {
}
}
},
grid: {
left: '3%',
right: '4%',
bottom: '5%',
containLabel: true
},
xAxis: [
{
type: 'category',
boundaryGap: false,
data: ['Mon', 'Tue', 'Wed', 'Thu', 'Fri', 'Sat', 'Sun']
}
],
yAxis: [
{
type: 'value'
}
],
series: [
{
name: 'Line 1',
type: 'line',
stack: 'Total',
smooth: true,
lineStyle: {
width: 0
},
showSymbol: false,
areaStyle: {
opacity: 0.8,
},
emphasis: {
focus: 'series'
},
data: [140, 232, 101, 264, 90, 340, 250]
},
{
name: 'Line 2',
type: 'line',
stack: 'Total',
smooth: true,
lineStyle: {
width: 0
},
showSymbol: false,
areaStyle: {
opacity: 0.8,
},
emphasis: {
focus: 'series'
},
data: [120, 282, 111, 234, 220, 340, 310]
},
{
name: 'Line 3',
type: 'line',
stack: 'Total',
smooth: true,
lineStyle: {
width: 0
},
showSymbol: false,
areaStyle: {
opacity: 0.8,
},
emphasis: {
focus: 'series'
},
data: [320, 132, 201, 334, 190, 130, 220]
},
{
name: 'Line 4',
type: 'line',
stack: 'Total',
smooth: true,
lineStyle: {
width: 0
},
showSymbol: false,
areaStyle: {
opacity: 0.8,
},
emphasis: {
focus: 'series'
},
data: [220, 402, 231, 134, 190, 230, 120]
},
{
name: 'Line 5',
type: 'line',
stack: 'Total',
smooth: true,
lineStyle: {
width: 0
},
showSymbol: false,
label: {
show: true,
position: 'top'
},
areaStyle: {
opacity: 0.8,
},
emphasis: {
focus: 'series'
},
data: [220, 302, 181, 234, 210, 290, 150]
}
]
},
option3: (function () {
const builderJson = {
all: 10887,
charts: {
map: 3237,
lines: 2164,
bar: 7561,
line: 7778,
pie: 7355,
scatter: 2405,
candlestick: 1842,
radar: 2090,
heatmap: 1762,
treemap: 1593,
graph: 2060,
boxplot: 1537,
parallel: 1908,
gauge: 2107,
funnel: 1692,
sankey: 1568
},
components: {
geo: 2788,
title: 9575,
legend: 9400,
tooltip: 9466,
grid: 9266,
markPoint: 3419,
markLine: 2984,
timeline: 2739,
dataZoom: 2744,
visualMap: 2466,
toolbox: 3034,
polar: 1945
},
ie: 9743
};
const downloadJson = {
'echarts.min.js': 17365,
'echarts.simple.min.js': 4079,
'echarts.common.min.js': 6929,
'echarts.js': 14890
};
const themeJson = {
'dark.js': 1594,
'infographic.js': 925,
'shine.js': 1608,
'roma.js': 721,
'macarons.js': 2179,
'vintage.js': 1982
};
const waterMarkText = 'ECHARTS';
const canvas = document.createElement('canvas');
const ctx = canvas.getContext('2d');
canvas.width = canvas.height = 100;
ctx.textAlign = 'center';
ctx.textBaseline = 'middle';
ctx.globalAlpha = 0.08;
ctx.font = '20px Microsoft Yahei';
ctx.translate(50, 50);
ctx.rotate(-Math.PI / 4);
ctx.fillText(waterMarkText, 0, 0);
let option = {
backgroundColor: {
type: 'pattern',
image: canvas,
repeat: 'repeat'
},
tooltip: {
},
title: [
{
text: '在线构建',
subtext: '总计 ' + builderJson.all,
left: '25%',
textAlign: 'center'
},
{
text: '各版本下载',
subtext:
'总计 ' +
Object.keys(downloadJson).reduce(function (all, key) {
return all + downloadJson[key];
}, 0),
left: '75%',
textAlign: 'center'
},
{
text: '主题下载',
subtext:
'总计 ' +
Object.keys(themeJson).reduce(function (all, key) {
return all + themeJson[key];
}, 0),
left: '75%',
top: '50%',
textAlign: 'center'
}
],
grid: [
{
top: 50,
width: '50%',
bottom: '45%',
left: 10,
containLabel: true
},
{
top: '55%',
width: '50%',
bottom: 0,
left: 10,
containLabel: true
}
],
xAxis: [
{
type: 'value',
max: builderJson.all,
splitLine: {
show: false
}
},
{
type: 'value',
max: builderJson.all,
gridIndex: 1,
splitLine: {
show: false
}
}
],
yAxis: [
{
type: 'category',
data: Object.keys(builderJson.charts),
axisLabel: {
interval: 0,
rotate: 30
},
splitLine: {
show: false
}
},
{
gridIndex: 1,
type: 'category',
data: Object.keys(builderJson.components),
axisLabel: {
interval: 0,
rotate: 30
},
splitLine: {
show: false
}
}
],
series: [
{
type: 'bar',
stack: 'chart',
z: 3,
label: {
position: 'right',
show: true
},
data: Object.keys(builderJson.charts).map(function (key) {
return builderJson.charts[key];
})
},
{
type: 'bar',
stack: 'chart',
silent: true,
itemStyle: {
color: '#eee'
},
data: Object.keys(builderJson.charts).map(function (key) {
return builderJson.all - builderJson.charts[key];
})
},
{
type: 'bar',
stack: 'component',
xAxisIndex: 1,
yAxisIndex: 1,
z: 3,
label: {
position: 'right',
show: true
},
data: Object.keys(builderJson.components).map(function (key) {
return builderJson.components[key];
})
},
{
type: 'bar',
stack: 'component',
silent: true,
xAxisIndex: 1,
yAxisIndex: 1,
itemStyle: {
color: '#eee'
},
data: Object.keys(builderJson.components).map(function (key) {
return builderJson.all - builderJson.components[key];
})
},
{
type: 'pie',
radius: [0, '30%'],
center: ['75%', '25%'],
data: Object.keys(downloadJson).map(function (key) {
return {
name: key.replace('.js', ''),
value: downloadJson[key]
};
})
},
{
type: 'pie',
radius: [0, '30%'],
center: ['75%', '75%'],
data: Object.keys(themeJson).map(function (key) {
return {
name: key.replace('.js', ''),
value: themeJson[key]
};
})
}
]
};
return option;
})(),
}
},
methods: {
printPage() {
const elRef = this.$refs['PdfPage'].$el;
const contentRef = this.$refs['Content'].$el;
const options = {
windowHeight: contentRef.clientHeight + 160,
}
html2canvas(elRef, options)
.then(canvas => {
const [w, h] = [595.28, 841.89];
const [cw, ch] = [canvas.width, canvas.height];
const PDF = new JsPDF('p', 'pt', 'a4');
const pageData = canvas.toDataURL('image/jpeg', 1.0);
PDF.addImage(pageData, 'JPEG', 0, (h - ch / (cw / w)) / 2, w, ch / (cw / w));
PDF.save('00.pdf');
})
},
},
}
</script>
<style lang="less" scoped>
.Home {
position: relative;
width: 100%;
height: 100%;
.el-header {
background-color: #B3C0D1;
.el-row {
height: 100%;
}
}
.el-footer {
background-color: #B3C0D1;
line-height: 60px;
}
.el-aside {
background-color: #D3DCE6;
}
.el-main {
background-color: #E9EEF3;
}
.chart {
height: 500px;
}
}
</style>