目录
Pandas中集成了Matplotlib中的基础组件,让绘图更方便。
1.线形图
import numpy as np
import pandas as pd
import matplotlib.pyplot as plt
df = pd.DataFrame({'normal':np.random.normal(size = 50),'gamma':np.random.gamma(1,size = 50)})
df.plot()

2.柱状图
df = pd.DataFrame(np.random.randint(1,100,size = (3,3)),index =
{'one','two','three'},columns = ['I1','I2','I3'])
df.plot(kind = 'barh')

3.直方图
wy = pd.Series(np.random.normal(size = 50))
s.hist(bins = 15,grid = False,color='green')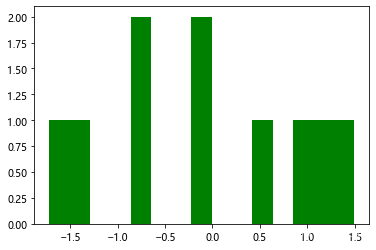
4. 密度图
wy = pd.Series(np.random.normal(size = 100))
s.plot(kind = 'kde',color='red')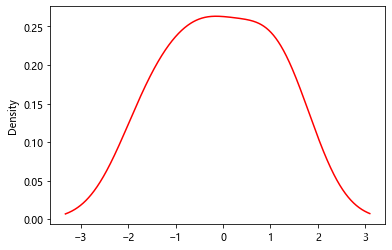
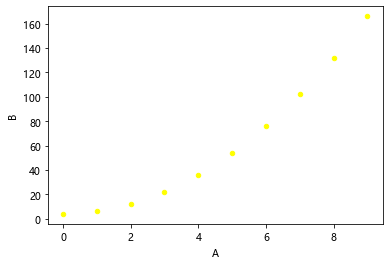
5.散点图
wd = pd.DataFrame(np.arange(10),columns = ['A'])
wd['B'] = 2*wd['A']*wd['A']+4
wd.plot(kind = 'scatter',x = 'A',y = 'B',color='yellow')