一 前言
tshark作为wireshark的命令行版本,功能非常强大,可以抓包,数据包分析、提取文件、提取分析后的数据还支持各种格式,可以说一把流量分析的瑞士军刀,如果在低流量的场景,包装下tshark命令,就可以做个功能比较丰富的分析系统了,结合检测规则,一个简单点的IDS系统就出来了。
二 核心功能
2.1 抓包
如同tcpdump一样,tshark也可以通过命令行方式进行流量捕获,功能一点也不弱。下面的例子是用em1 作为测试网卡。
2.1.1 选择网络接口
# 查看可以抓包的网卡信息
/usr/local/bin/tshark -D
例子:
[root@localhost xxx]# /usr/local/bin/tshark -D
Running as user "root" and group "root". This could be dangerous.
1. virbr0
2. docker0
3. nflog
4. nfqueue
5. em1
6. p1p1
7. p1p2
8. usbmon1
9. em2
10. usbmon2
11. usbmon3
12. usbmon4
13. br-7dd1f852358b
14. any
15. lo (Loopback)
16. randpkt (Random packet generator)
2.1.2 抓流量
# 抓包 同时支持多个网卡抓包
 /usr/local/bin/tshark -i em1  -i lo
#设置缓存大小,丢包场景可以设置下,单位为MB
/usr/local/bin/tshark -i em1 -B 2

#只抓前面512个字节,抓包小,大流量情况下有用
/usr/local/bin/tshark -i em1 -s 512

# 禁止域名解析 只想看ip
/usr/local/bin/tshark -i em1  -n

#设置包保存文件格式
/usr/local/bin/tshark -i em1 -F pcapng -w 1.pcapng
例子:
[root@localhost xxx]# /usr/local/bin/tshark -i em1  -i lo
Running as user "root" and group "root". This could be dangerous.
Capturing on 'em1' and 'Loopback'
    1 0.000000000   10.xx.xx.32 → 10.xx.xx.209 TCP 60 1902 → 22 [ACK] Seq=1 Ack=1 Win=515 Len=0
    2 0.057326592 10.xx.xx.252 → 224.0.0.18   VRRP 60 Announcement (v2)
    3 -0.105265214    127.0.0.1 → 127.0.0.1    UDP 237 41526 → 12345 Len=195
    4 -0.105252544    127.0.0.1 → 127.0.0.1    ICMP 265 Destination unreachable (Port unreachable)
    5 -0.104887691    127.0.0.1 → 127.0.0.1    TCP 78 58290 → 2181 [PSH, ACK] Seq=1 Ack=1 Win=512 Len=12 TSval=2758822980 TSecr=2758821313
2.1.3 抓包过滤
抓包过滤的语法采用bpf过滤语法,和tcpdump一样的过滤语法。比如查看特定端口的流量:
/usr/local/bin/tshark  -f 'port 8080 or port 54'

# 常用过滤语法
# 抓tcp端口为22 ,且含有fin标识的数据包
/usr/local/bin/tshark  -f "tcp port 22 and (tcp[tcpflags] & tcp-fin != 0)"

#主机过滤
not host vs and ace

#网络过滤
ip and not net localnet
例子:
[root@localhost xxxx]# /usr/local/bin/tshark -f 'port 80 or port 53' -i em1
Running as user "root" and group "root". This could be dangerous.
Capturing on 'em1'
    1 0.000000000 10.xx.xx.xxx→ 223.5.5.5    DNS 75 Standard query 0x18ff A www.sina.com.cn
    2 0.021213522    223.5.5.5 → 10.xx.xx.xxx DNS 281 Standard query response 0x18ff A www.sina.com.cn CNAME spool.grid.sinaedge.com CNAME ww1.sinaimg.cn.w.alikunlun.com A 218.98.31.191 A 218.98.31.194 A 218.98.31.197 A 218.98.31.193 A 218.98.31.198 A 218.98.31.195 A 218.98.31.192 A 218.98.31.196
    3 0.027229144 10.10.xx.xxx → 223.5.5.5    DNS 86 Standard query 0xc21f PTR 191.31.98.218.in-addr.arpa
2.1.4 自动停止参数-a
抓到一定包量、或者到达一定时间、或者文件大小达到多少自动停止抓包。
#抓包停止条件: 以数量作为停止条件
/usr/local/bin/tshark -i em1   -c 抓包数量

#抓包停止条件: 以时间作为停止条件 60秒
/usr/local/bin/tshark -i em1    -a duration:60

#抓包停止条件: 以文件大小作为停止条件 单位为KB
/usr/local/bin/tshark -i em1    -a filesize:10  -w 1.pcap
2.1.5 捕获输出参数
捕获输出,又名环形缓冲区参数“-b”,带有与自动停止相同的标志。但是,用法/输出有点不同,即标志持续时间和文件大小,因为它允许您在达到指定的时间限制(以秒为单位)或文件大小后将数据包切换或保存到另一个文件。
#抓包保存自动停止和抓包停止参数类似,用于按照大小自动切换文件、按照时间自动切换文件、或者建个缓存,写多少个之后覆盖写

/usr/local/bin/tshark -i em1   -b filesize:100 -a files:2 -w /tmp/test.pcap
部分命令测试结果:
[root@localhost xxx]# /usr/local/bin/tshark -i lo -w 1.pcap
Running as user "root" and group "root". This could be dangerous.
Capturing on 'Loopback'
283 ^C

[root@localhost xxx]# /usr/local/bin/tshark -i lo
Running as user "root" and group "root". This could be dangerous.
Capturing on 'Loopback'
    1 0.000000000    127.0.0.1 → 127.0.0.1    TCP 78 58286 → 2181 [PSH, ACK] Seq=1 Ack=1 Win=512 Len=12 TSval=2756988487 TSecr=2756986819
    2 0.000076012    127.0.0.1 → 127.0.0.1    TCP 86 2181 → 58286 [PSH, ACK] Seq=1 Ack=13 Win=512 Len=20 TSval=2756988487 TSecr=2756988487
    3 0.000082052    127.0.0.1 → 127.0.0.1    TCP 66 58286 → 2181 [ACK] Seq=13 Ack=21 Win=512 Len=0 TSval=2756988487 TSecr=2756988487

[root@localhost xxx]# /usr/local/bin/tshark -i lo -b filesize:100 -a files:2 -w /tmp/test.pcap
Running as user "root" and group "root". This could be dangerous.
Capturing on 'Loopback'
843
[root@localhost xxx]# ll /tmp/test_0000*
-rw------- 1 root root 100116 Dec  7 11:29 /tmp/test_00001_20221207112900.pcap
-rw------- 1 root root 100092 Dec  7 11:29 /tmp/test_00002_20221207112911.pcap
[root@localhost xxx]# /usr/local/bin/tshark -i lo -b filesize:100  -w /tmp/test.pcap
2.2 读包和分析
2.2.1 简单分析
tshark可以读包进行各种分析,如下:
# 读取pcap包
 /usr/local/bin/tshark -r pcap/tomcat_bru.pcap
# 显示标准点的时间格式
 /usr/local/bin/tshark -r pcap/tomcat_bru.pcap  -t ad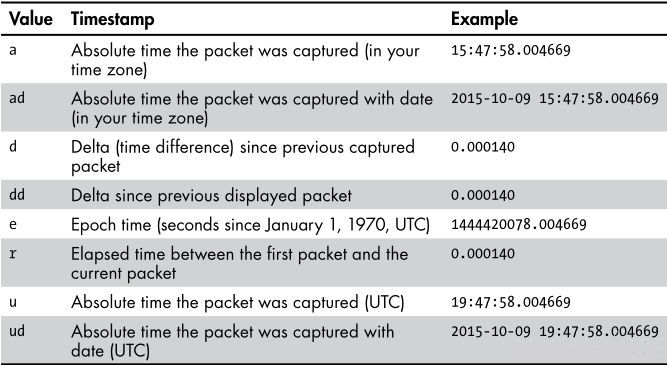
例子:

[root@localhost xxx]# /usr/local/bin/tshark -r pcap/tomcat_bru.pcap |more
Running as user "root" and group "root". This could be dangerous.
    1   0.000000 137.135.12.16 → 172.16.66.100 TLSv1 113 Change Cipher Spec, Encrypted Handshake Message
    2   0.000098 172.16.66.100 → 137.135.12.16 TCP 54 7785 → 443 [ACK] Seq=1 Ack=60 Win=16560 Len=0
    3   0.000379 172.16.66.100 → 137.135.12.16 TLSv1 715 Application Data
    4   0.239551 172.16.66.100 → 125.119.8.1  ICMP 74 Echo (ping) request  id=0x0100, seq=37927/10132, ttl=64
    5   0.242259  125.119.8.1 → 172.16.66.100 ICMP 74 Echo (ping) reply    id=0x0100, seq=37927/10132, ttl=250 (request in 4)
    6   0.282825 137.135.12.16 → 172.16.66.100 TLSv1 603 Application Data
    7   0.282969 172.16.66.100 → 137.135.12.16 TCP 54 7785 → 443 [ACK] Seq=662 Ack=609 Win=16422 Len=0
    8   0.283384 172.16.66.100 → 137.135.12.16 TCP 54 7785 → 443 [FIN, ACK] Seq=662 Ack=609 Win=16422 Len=0
    9   0.284748 172.16.66.100 → 137.135.12.16 TCP 66 7786 → 443 [SYN] Seq=0 Win=8192 Len=0 MSS=1460 WS=4 SACK_PERM=1
   10   0.559238 137.135.12.16 → 172.16.66.100 TCP 60 443 → 7785 [FIN, ACK] Seq=609 Ack=663 Win=64 Len=0
   11   0.559366 172.16.66.100 → 137.135.12.16 TCP 54 7785 → 443 [ACK] Seq=663 Ack=610 Win=16422 Len=0
   12   0.696560 172.16.66.100 → 223.5.5.5    DNS 86 Standard query 0x4d25 PTR 16.12.135.137.in-addr.arpa
2.2.2 过滤和输出格式处理
过滤字段比较简单,命令如下:
/usr/local/bin/tshark -r pcap/tomcat_bru.pcap -T fields -e frame.number -e ip.src -e ip.dst -e tcp.srcport -e tcp.dstport选择字段我会了,但是输出格式是表格不好处理,有好处理的格式:
xml 格式-T fields 改成 -T pdml 其他不变 我想发到ES里面,没问题安排,输出格式改成ek 发送到elasticsearch中,可以将-T fields改成-T ek
我想全点信息,但是又不想写这么多字段,简单,把-e字段全部去掉加上参数-V 想实现类似wireshark点击特定层,显示右边特定高亮,简单-T pdml -V即获取到size和pos的重要信息。
还只是简单想输出tab格式,但是需要有表头、用双引号将值括起来,且分隔符为逗号。请看下面示例:
/usr/local/bin/tshark -r pcap/mysql.pcap    -T fields -e ip.src -e ip.dst -e mysql.query  -E header=y -E separator=, -E quote=d
ip.src,ip.dst,mysql.query
"10.10.3.109","10.10.3.60",
"10.10.3.60","10.10.3.109",
我需要过滤的更牛点,比如过滤dns协议特定内容 mysql协议、过滤http协议包含特定内容的。可以看看下面的例子
#抓包或者读pcap文件都可以采用-Y语法进行过滤,语法功能很强。
# 过滤dns协议包含特定域名的
/usr/local/bin/tshark -r pcap/tomcat_bru.pcap -Y "dns.qry.name matches"in-addr""

#特定网段的
 /usr/local/bin/tshark -r pcap/tomcat_bru.pcap -Y 'ip.addr == 172.16.0.0/16 '

#指定位置匹配  语法很像python的切片语法
eth.src[0:3] == 00:00:83
[i:j]    i = start_offset, j = length
[i-j]    i = start_offset, j = end_offset, inclusive.
[i]      i = start_offset, length = 1
[:j]     start_offset = 0, length = j
[i:]     start_offset = i, end_offset = end_of_field

#端口范围过滤
/usr/local/bin/tshark -r pcap/tomcat_bru.pcap -Y "tcp.port in {53 8080}"


# 过滤http协议,且返回状态为200的报文 只会匹配返回报文
 /usr/local/bin/tshark -r pcap/tomcat_bru.pcap  -Y 'http and http.response.code == 200'

# 匹配mysql查询
 /usr/local/bin/tshark -r pcap/mysql.pcap -T fields -e mysql.query -Y 'mysql.query  contains select'
Running as user "root" and group "root". This could be dangerous.
select @@version_comment limit 1
select * from test_table

#匹配包中包含mysql的select或show命令的语句
/usr/local/bin/tshark -r pcap/mysql.pcap -T fields -e mysql.query -Y 'mysql.query  matches  "select|show"'
Running as user "root" and group "root". This could be dangerous.
show databases
show tables
select @@version_comment limit 1
select * from test_table

#查看特定时间范围的包 并且写入到文件
/usr/local/bin/tshark -r   pcap/tomcat_bru.pcap -t  ad -Y  'frame.time >= "2016-01-04 19:32:47" && frame.time < "2016-01-04 19:32:50" ' -w a.pcap

#
注意字段内容匹配的时候,用contains是字符串包含区分大小写,matches做的是正则表达式的匹配,是perl格式的正则表达式语法。
过滤器,可以通过-Y过滤又成为显示过滤,过滤的是一次性的,即是经过一次过滤出来不做缓存。-2 选项相反,则会缓存输出,会用将来的信息来填充字段,比如返回值,比如数据包重组。
过滤例子:
[root@localhost xxx]#  /usr/local/bin/tshark -r pcap/tomcat_bru.pcap   -T fields -e frame.number -e ip.src -e ip.dst -e tcp.srcport -e tcp.dstport |more
Running as user "root" and group "root". This could be dangerous.
1       137.135.12.16   172.16.66.100   443     7785
2       172.16.66.100   137.135.12.16   7785    443
3       172.16.66.100   137.135.12.16   77

[root@localhost xxx]#  /usr/local/bin/tshark -r pcap/tomcat_bru.pcap   -T ek   -e frame.number -e ip.src -e ip.dst -e tcp.srcport -e tcp.dstport -V|more
Running as user "root" and group "root". This could be dangerous.
{"index" : {"_index": "packets-2022-12-07", "_type": "pcap_file", "_score": null}}
{"timestamp" : "1451907159370", "layers" : {"frame_number": ["1"],"ip_src": ["137.135.12.16"],"ip_dst": ["172.16.66.100"],"tcp_srcport": ["443"],"tcp_dstport": ["7785"]}}

[root@localhost xxx]#  /usr/local/bin/tshark -r pcap/tomcat_bru.pcap   -T json     -e frame.number -e ip.src -e ip.dst -e tcp.srcport -e tcp.dstport -V|more
Running as user "root" and group "root". This could be dangerous.
[
  {
    "_index": "packets-2022-12-07",
    "_type": "pcap_file",
    "_score": null,
    "_source": {
      "layers": {
        "frame.number": ["1"],
        "ip.src": ["137.135.12.16"],
        "ip.dst": ["172.16.66.100"],
        "tcp.srcport": ["443"],
        "tcp.dstport": ["7785"]
      }
    }
  }


root@localhost xxx]#  /usr/local/bin/tshark -r pcap/tomcat_bru.pcap   -T json     -V|more
Running as user "root" and group "root". This could be dangerous.
[
  {
    "_index": "packets-2022-12-07",
    "_type": "pcap_file",
    "_score": null,
    "_source": {
      "layers": {
        "frame": {
          "frame.encap_type": "1",
          "frame.time": "Jan  4, 2016 19:32:39.370369000 CST",
          "frame.offset_shift": "0.000000000",
          "frame.time_epoch": "1451907159.370369000",
          "frame.time_delta": "0.000000000",
          "frame.time_delta_displayed": "0.000000000",
          "frame.time_relative": "0.000000000",
          "frame.number": "1",
          "frame.len": "113",
          "frame.cap_len": "113",
          "frame.marked": "0",
          "frame.ignored": "0",
          "frame.protocols": "eth:ethertype:ip:tcp:ssl"
        },
        "eth": {
          "eth.dst": "20:89:84:32:73:c5",
          "eth.dst_tree": {
            "eth.dst_resolved": "CompalIn_32:73:c5",
            "eth.addr": "20:89:84:32:73:c5",
            "eth.addr_resolved": "CompalIn_32:73:c5",
            "eth.lg": "0",
....

# 单包查看ascii和二进制
# /usr/local/bin/tshark -r pcap/tomcat_bru.pcap -Y 'frame.number == 1 ' -x

Running as user "root" and group "root". This could be dangerous.
0000  20 89 84 32 73 c5 0c da 41 9e cc 85 08 00 45 00    ..2s...A.....E.
0010  00 63 4a 3c 40 00 2d 06 7f 4d 89 87 0c 10 ac 10   .cJ<@.-..M......
0020  42 64 01 bb 1e 69 77 ea ff 2b 21 1f 7c f5 50 18   Bd...iw..+!.|.P.
0030  00 3e 49 58 00 00 14 03 01 00 01 01 16 03 01 00   .>IX............
0040  30 f7 e8 17 52 be c4 73 e2 69 73 ad dc 08 c7 19   0...R..s.is.....
0050  ef a6 21 78 1d 81 c3 42 e7 c5 ef 7e 81 32 4c e8   ..!x...B...~.2L.
0060  48 53 5b b6 0d d6 ca eb c2 df e6 6f 44 49 60 76   HS[........oDI`v
0070  f4                                                .
三 那些少为人知的命令
3.1 流分析
即实现双向的数据显示,在wireshark上直接用右键,选择“追踪流” 即可。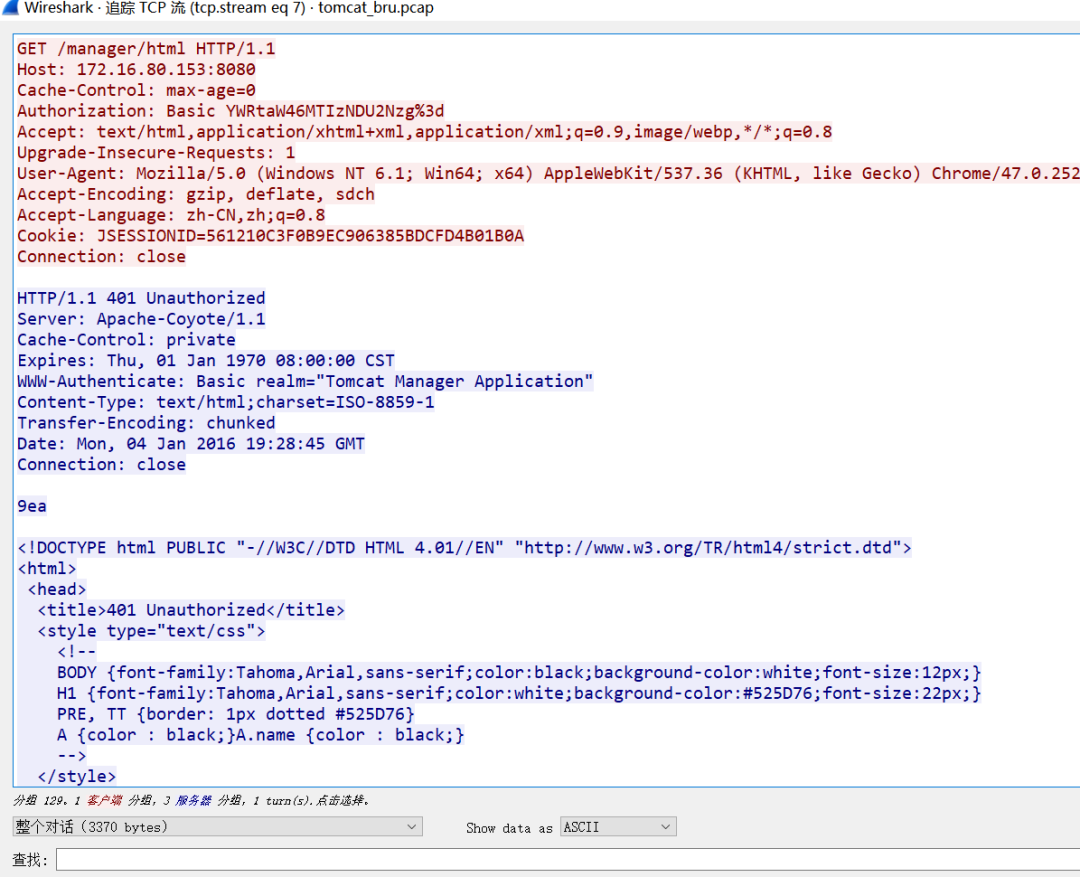
tshark中的对应命令:(下图中7为tcp.stream 的值即可以看成是流在此pcap中的号)
/usr/local/bin/tshark -r   pcap/tomcat_bru.pcap -q -z follow,tcp,ascii,7
Follow: tcp,ascii
Filter: tcp.stream eq 7
Node 0: 172.16.66.100:7792
Node 1: 172.16.80.153:8080
0

        0

0

512
GET /manager/html HTTP/1.1
Host: 172.16.80.153:8080
Cache-Control: max-age=0
Authorization: Basic YWRtaW46MTIzNDU2Nzg%3d
Accept: text/html,application/xhtml+xml,application/xml;q=0.9,image/webp,*/*;q=0.8
Upgrade-Insecure-Requests: 1
User-Agent: Mozilla/5.0 (Windows NT 6.1; Win64; x64) AppleWebKit/537.36 (KHTML, like Gecko) Chrome/47.0.2526.106 Safari/537.36
Accept-Encoding: gzip, deflate, sdch
Accept-Language: zh-CN,zh;q=0.8
Cookie: JSESSIONID=561210C3F0B9EC906385BDCFD4B01B0A
Connection: close


        1460
HTTP/1.1 401 Unauthorized
Server: Apache-Coyote/1.1
Cache-Control: private
Expires: Thu, 01 Jan 1970 08:00:00 CST
WWW-Authenticate: Basic realm="Tomcat Manager Application"
Content-Type: text/html;charset=ISO-8859-1
...
会发现中间有很多数字,曾经也困扰了我(这个在网上还没搜到类似的说明),后来终于明白了,分析流还是按照包显示的,显示的格式是:payload的长度 +换行+ payload按照格式展示,这里面是ascii,如果是流的另一个方向那,那长度前面有^I,字符即tab键盘。另外注意长度是包含换行和回车的,比看到的多两个字节。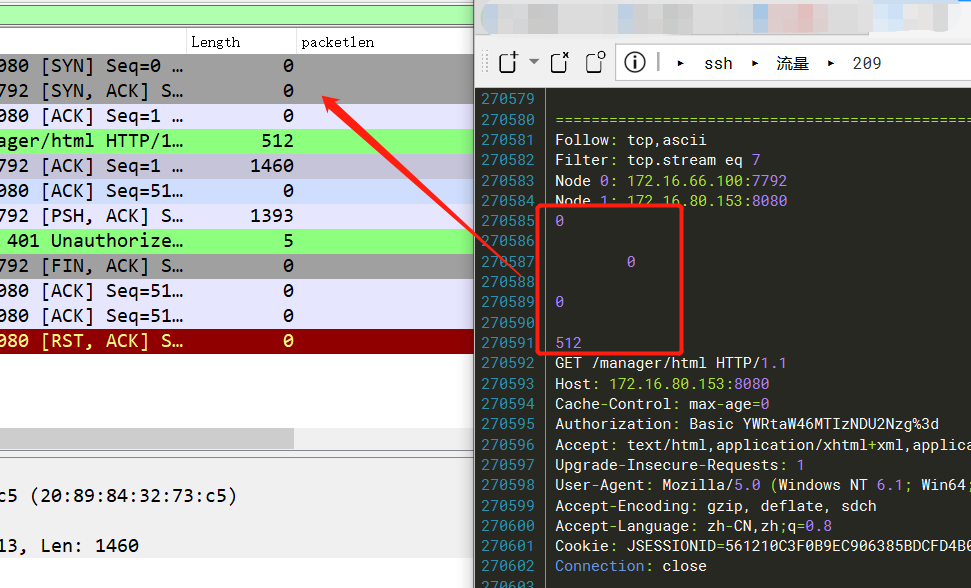
如果想展示左边为16进制,右边为ascii,可以使用如下参数:
/usr/local/bin/tshark -r pcap/tomcat_bru.pcap -q -z follow,tcp,hex,7提取存16进制,可以将hex改成raw。过滤特定流的pcap包,可以输入下面命令:
/usr/local/bin/tshark -r pcap/tomcat_bru.pcap -Y 'tcp.stream == 7'3.2 统计
3.2.1 专家信息统计
可以用来发现网络是否有异常等:
/usr/local/bin/tshark -r pcap/tomcat_bru.pcap -z expert -q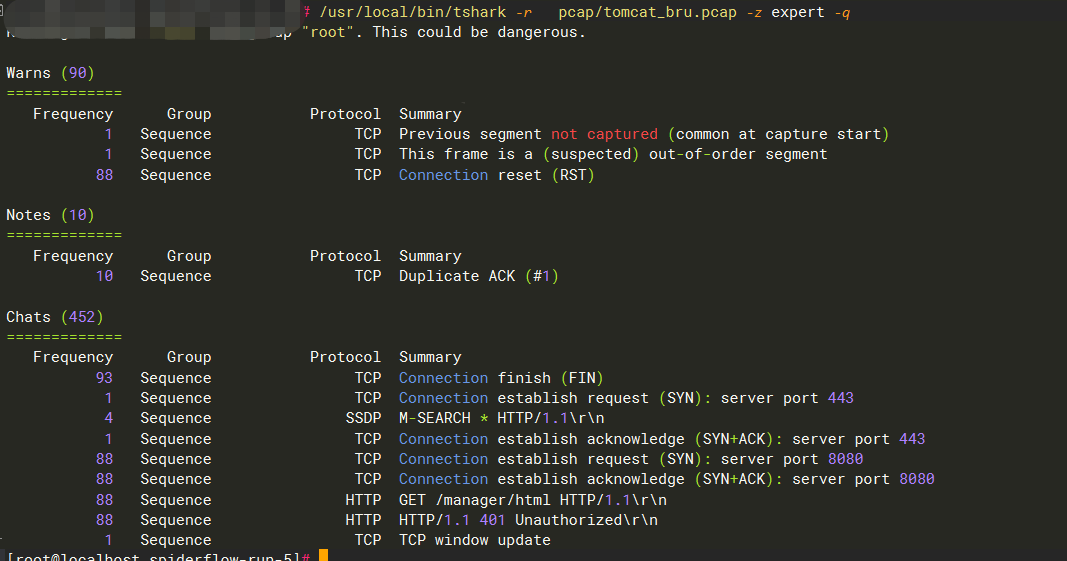
3.2.2 包长度统计
排查下是否有异常的小包时候有用:
/usr/local/bin/tshark -r pcap/tomcat_bru.pcap -z plen,tree -q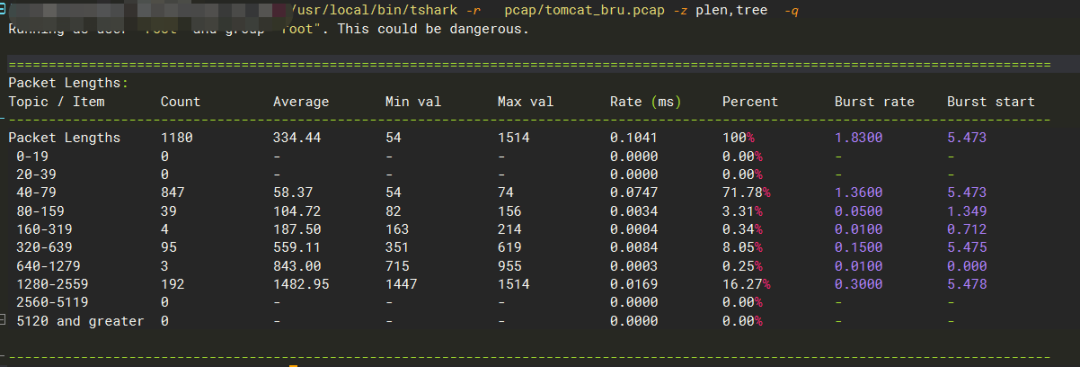
3.2.3 会话统计
/usr/local/bin/tshark -r pcap/tomcat_bru.pcap -z conv,ip -q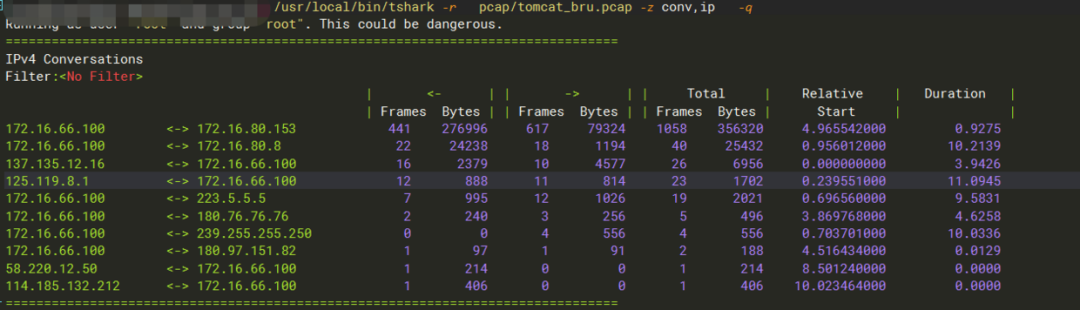
3.2.4 统计所有IP信息
/usr/local/bin/tshark -r pcap/tomcat_bru.pcap -z endpoints,ip -q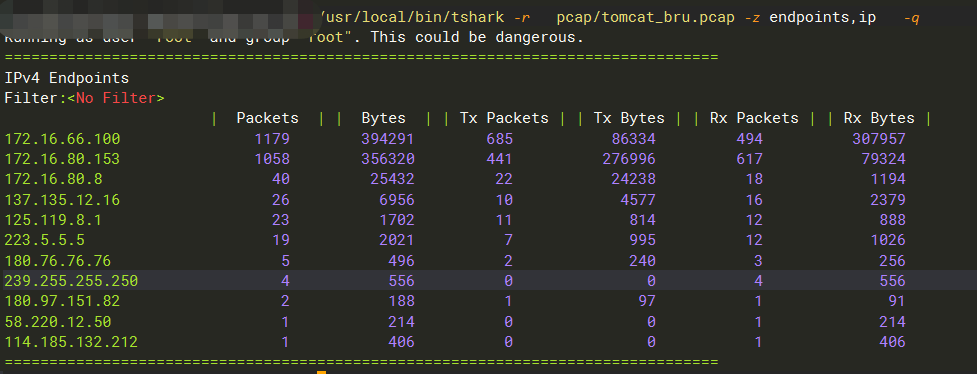
3.2.5 HTTP包情况统计
/usr/local/bin/tshark -q -r ./pcap/tomcat_bru.pcap -2 -R http -z http,tree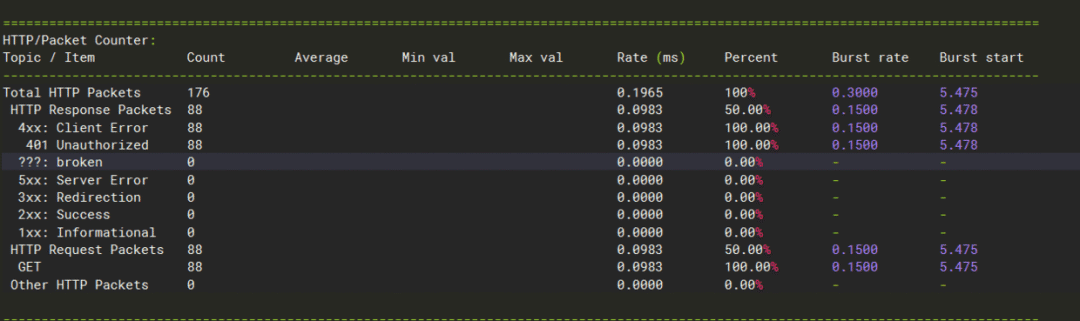
3.2.5 以固定时间间隔统计数据
比如5s为间隔统计IO情况:
/usr/local/bin/tshark -r pcap/tomcat_bru.pcap -z io,stat,5 -q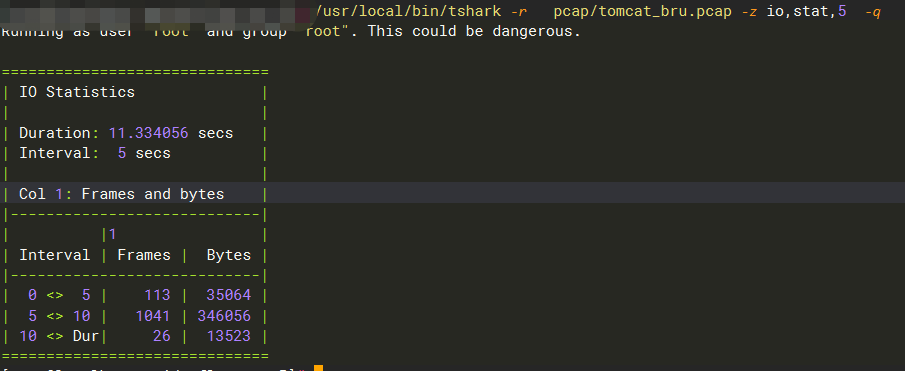
加过滤器的统计
/usr/local/bin/tshark -r pcap/tomcat_bru.pcap -z io,stat,3,ip==172.16.0.0/16 -q统计的维度非常多,可以通过-z xxx 故意输错,打印出来所有统计维度信息。
3.3 HTTPS有密钥情况下解包
-Y: 过滤条件
-o 设置参数
重点是ssl.keys_list 设置了https的服务器地址、端口、私钥文件
-V 展开所有协议
-x 输出16进制和ASCII

tshark  -Y 'http contains "pmos.md.sgcc.com.cn" and frame.number==20'  -o "ssl.desegment_ssl_records: TRUE" -o "ssl.desegment_ssl_application_data: TRUE"   -o "ssl.keys_list: 10.x.1x.30,443,http,./key.pem"    -o "ssl.debug_file: ./debug" -r ce0f77a1-a351-4e0f-b92f-a3e1b9612a5d.pcap -x -V -w 2.txt
3.4 pcap分层解析
比如我只想详细看tcp层或ip层,命令如下: 查看tcp层:
/usr/local/bin/tshark -r pcap/tomcat_bru.pcap -Y "frame.number == 1" -O tcp查看ip层:
/usr/local/bin/tshark -r pcap/tomcat_bru.pcap -Y "frame.number == 1" -O ip所有层都展开:
/usr/local/bin/tshark -r pcap/tomcat_bru.pcap -Y "frame.number == 1" -V3.5 导出文件
不一定所有版本都支持
#tt为保存文件夹名字
/usr/local/bin/tshark  pcap/tomcat_bru.pcap  --export-objects http,tt -q
3.6 将特定条件的包按照某个协议进行解码
# 将tcp端口为8888的报文按照http协议解码,应对tshark未识别出协议的场景
 /usr/local/bin/tshark  -q -r ./pcap/tomcat_bru.pcap  -d   tcp.port==8888,http
四 参考文档
官方文档:[https://www.wireshark.org/docs/man-pages/tshark.html](https://www.wireshark.org/docs/man-pages/tshark.html)
参考:[https://blog.csdn.net/weixin_44288604/article/details/123807294](https://blog.csdn.net/weixin_44288604/article/details/123807294)