本篇翻译自此篇博客
这篇博客,不过这篇博客的有些操作描述不清楚。
第一步 :安装和启动logstash在osx系统上。
执行命令
$ brew install logstash
·
我们可以看到它安装了最新的版本(logstash v6.1.1)

安装好以后我就可以把它作为一个brew服务开启

logstash homebrew services started
$ brew services list
$ brew services start logstash
在homebrew下我们可以根据一下的目录去确认logstash的配置
$ /usr/local/Cellar/logstash/6.1.1/libexec/config

第二步 02:安装和启动elastic栈在osx上
执行命令
$ brew install elasticsearch

我们可以找到配置文件在如下位置

将elastic search作为一个homebrew服务开启
$ brew services start elasticsearch

$ brew info elasticsearch
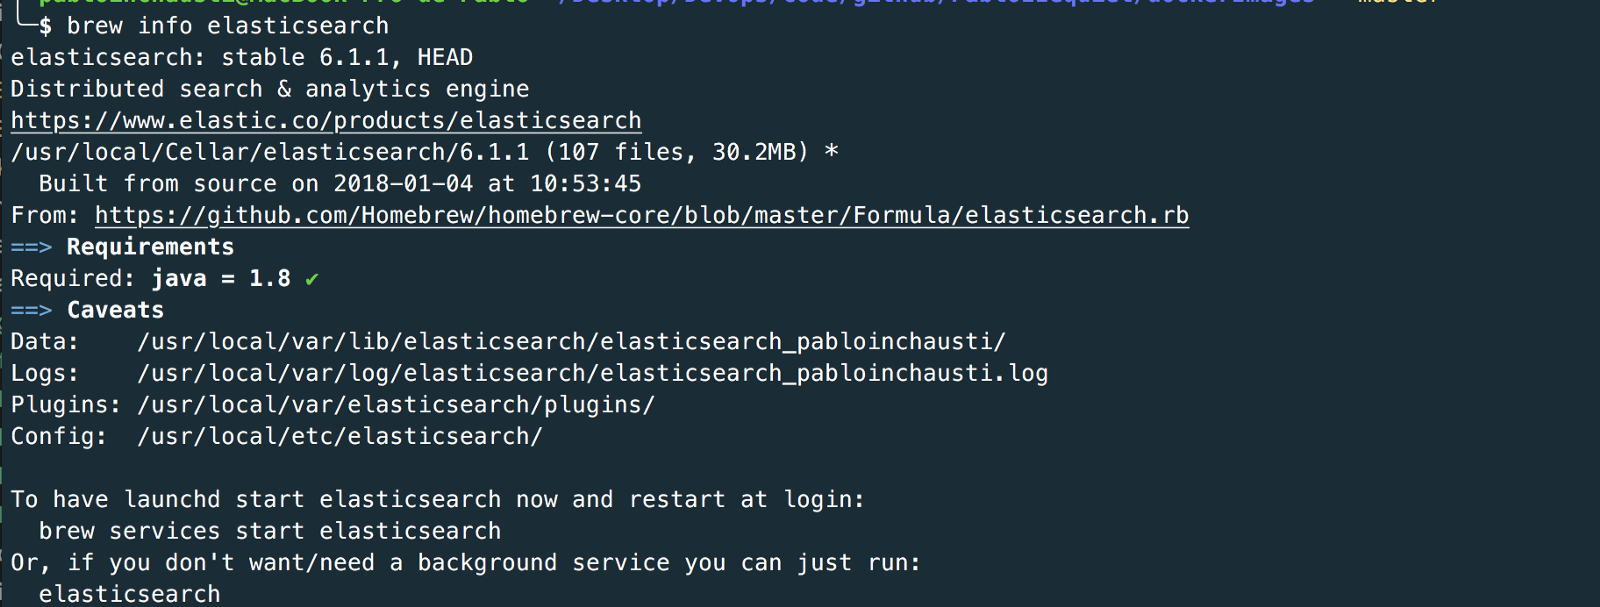
info service elasticsearch

service elastic search started with homebrew
$ tail -f /usr/local/var/log/elasticsearch/elasticsearch_pabloinchausti.log
elastic服务已经启动,我们可以看到它的有关信息在如下链接:http://localhost:9200/

第三步 03:安装和启动kibana在osx系统上
好的,现在我们将要通过homebrew安装kibana。
$ brew install kibana
kibana install


starting kibana

info service kibana
kibana服务的配置文件在 /usr/local/etc/kibana/kibana.yml
但是它的第一行被注释了(我们可以去掉注释来改变默认kibana配置)
一些默认的kibana设置:
- localhost:5601
- elasticsearch on 9200
http://localhost:5601
http://localhost:5601/status

第四步#04:载入某些数据在osx elk栈上
好的,此时我已经安装了 Kibana、Elasticsearch 和 Logstash,它们都具有默认配置值。我想在这个 ELK Stack 中提供一些数据来使用可视化仪表板。
我将按照官方教程中的的步骤加载一些数据集进行操作,然后下载并解压缩数据集:

根据官方文档了解“映射”:
映射是定义文档及其包含的字段如何存储和索引的过程。例如,如何使用映射

使用示例数据集(“莎士比亚”):

在 Kibana DevTools 中,我们创建索引“shakespeare”:

在 elasticsearch:

我们为日志创建索引:


账户数据集不需要任何映射,所以此时我们已准备好使用 Elasticsearch 批量 API 使用以下命令加载数据集:
$ curl -H 'Content-Type: application/x-ndjson' -XPOST 'localhost:9200/bank/account/_bulk?pretty' --data-binary @accounts.json
$ curl -H 'Content-Type: application/x-ndjson' -XPOST 'localhost:9200/shakespeare/doc/_bulk?pretty' --data-binary @shakespeare_6.0.json
$
curl -H 'Content-Type: application/x-ndjson' -XPOST 'localhost:9200/_bulk?pretty' --data-binary @logs.jsonl
Shakespeare:

curl -H ‘Content-Type: application/x-ndjson’ -XPOST ‘localhost:9200/bank/account/_bulk?pretty’ — data-binary @accounts.json

curl -H ‘Content-Type: application/x-ndjson’ -XPOST ‘localhost:9200/shakespeare/doc/_bulk?pretty’ — data-binary @shakespeare_6.0.json

… running ….

日志:

curl -H ‘Content-Type: application/x-ndjson’ -XPOST ‘localhost:9200/_bulk?pretty’ — data-binary @logs.jsonl

还有什么?
我们应该可以看到:
GET /_cat/indices?v
第五步#05: 发现数据
首先,我们安装了 ELK Stack,接下来,我们为 elasticsearch 提供三个数据集(Shakespeare, logs and accounts),现在我们要发现一些数据:

kibana discover see the datasets
05.01 创建 shakes* index:


Index created Shakes*
05.02 创建 bank* index:

05.03 创建 logstash-2015.05* index:
在这种情况下,我们有一个索引包含基于时间的事件,所以我们


We are selecting a @ timestamp field

this index have almost 100 fields …

this index have almost 100 fields …

根据时间戳:

第六步 #06: 数据可视化


Agregation: another field
最终语
我们可以看到如何在 OSX 上安装 ELK Stack,主要是基于 homebrew,然后,如何使用 logstash 摄取一些数据,在 elastisearch 上建立索引并使用 kibana 将其可视化
参考链接:
当您处理 kibana 和 elasticsearch 时,一些参考的链接是: