文章目录
什么是 Prometheus & Grafana
什么是Prometheus
Prometheus 是一个开源的服务监控系统和时序数据库,其提供了通用的数据模型和快捷数据采集、存储和查询接口。它的核心组
件Prometheus server会定期从静态配置的监控目标或者基于服务发现自动配置的自标中进行拉取数据,当新拉取到的数据大于配
置的内存缓存区时,数据就会持久化到存储设备当中。
1.每个被监控的主机都可以通过专用的exporter 程序提供输出监控数据的接口,它会在目标处收集监控数据,并暴露出一个HTTP
接口供Prometheus server查询,Prometheus通过基于HTTP的pull的方式来周期性的采集数据。
2.任何被监控的目标都需要事先纳入到监控系统中才能进行时序数据采集、存储、告警和展示,监控目标可以通过配置信息以静
态形式指定,也可以让Prometheus通过服务发现的机制进行动态管理。
3.Prometheus 能够直接把API Server作为服务发现系统使用,进而动态发现和监控集群中的所有可被监控的对象。
什么是 Grafana
grafana是用于可视化大型测量数据的开源程序,他提供了强大和优雅的方式去创建、共享、浏览数据。
dashboard中显示了你不同metric数据源中的数据。
Grafana 官方还对 Grafana 的适用场景以及基本特征作了介绍:
grafana最常用于因特网基础设施和应用分析,但在其他领域也有机会用到,比如:工业传感器、家庭自动化、过程控制等等。
grafana有热插拔控制面板和可扩展的数据源,目前已经支持Graphite、InfluxDB、OpenTSDB、Elasticsearch。
安装部署 Prometheus & Grafana
下载所需镜像
docker pull prom/prometheus
docker pull grafana/grafana
修改orderer、peer节点
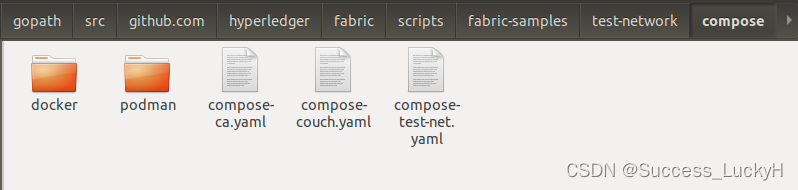
…/test-network/compose 路径下修改 compose-test-net.yaml 文件 更改配置信息
# Copyright IBM Corp. All Rights Reserved.
#
# SPDX-License-Identifier: Apache-2.0
#

version: '3.7'

volumes:
  orderer.example.com:
  peer0.org1.example.com:
  peer0.org2.example.com:

networks:
  test:
    name: fabric_test

services:

  orderer.example.com:
    container_name: orderer.example.com
    image: hyperledger/fabric-orderer:latest
    labels:
      service: hyperledger-fabric
    environment:
      - FABRIC_LOGGING_SPEC=INFO
      - ORDERER_GENERAL_LISTENADDRESS=0.0.0.0
      - ORDERER_GENERAL_LISTENPORT=7050
      - ORDERER_GENERAL_LOCALMSPID=OrdererMSP
      - ORDERER_GENERAL_LOCALMSPDIR=/var/hyperledger/orderer/msp
      # enabled TLS
      - ORDERER_GENERAL_TLS_ENABLED=true
      - ORDERER_GENERAL_TLS_PRIVATEKEY=/var/hyperledger/orderer/tls/server.key
      - ORDERER_GENERAL_TLS_CERTIFICATE=/var/hyperledger/orderer/tls/server.crt
      - ORDERER_GENERAL_TLS_ROOTCAS=[/var/hyperledger/orderer/tls/ca.crt]
      - ORDERER_GENERAL_CLUSTER_CLIENTCERTIFICATE=/var/hyperledger/orderer/tls/server.crt
      - ORDERER_GENERAL_CLUSTER_CLIENTPRIVATEKEY=/var/hyperledger/orderer/tls/server.key
      - ORDERER_GENERAL_CLUSTER_ROOTCAS=[/var/hyperledger/orderer/tls/ca.crt]
      - ORDERER_GENERAL_BOOTSTRAPMETHOD=none
      - ORDERER_CHANNELPARTICIPATION_ENABLED=true
      - ORDERER_ADMIN_TLS_ENABLED=true
      - ORDERER_ADMIN_TLS_CERTIFICATE=/var/hyperledger/orderer/tls/server.crt
      - ORDERER_ADMIN_TLS_PRIVATEKEY=/var/hyperledger/orderer/tls/server.key
      - ORDERER_ADMIN_TLS_ROOTCAS=[/var/hyperledger/orderer/tls/ca.crt]
      - ORDERER_ADMIN_TLS_CLIENTROOTCAS=[/var/hyperledger/orderer/tls/ca.crt]
      - ORDERER_ADMIN_LISTENADDRESS=0.0.0.0:7053
      - ORDERER_OPERATIONS_LISTENADDRESS=orderer.example.com:9443
      - ORDERER_METRICS_PROVIDER=prometheus
    working_dir: /root
    command: orderer
    volumes:
        - ../organizations/ordererOrganizations/example.com/orderers/orderer.example.com/msp:/var/hyperledger/orderer/msp
        - ../organizations/ordererOrganizations/example.com/orderers/orderer.example.com/tls/:/var/hyperledger/orderer/tls
        - orderer.example.com:/var/hyperledger/production/orderer
    ports:
      - 7050:7050
      - 7053:7053
      - 9443:9443
    networks:
      - test

  peer0.org1.example.com:
    container_name: peer0.org1.example.com
    image: hyperledger/fabric-peer:latest
    labels:
      service: hyperledger-fabric
    environment:
      - FABRIC_CFG_PATH=/etc/hyperledger/peercfg
      - FABRIC_LOGGING_SPEC=INFO
      #- FABRIC_LOGGING_SPEC=DEBUG
      - CORE_PEER_TLS_ENABLED=true
      - CORE_PEER_PROFILE_ENABLED=false
      - CORE_PEER_TLS_CERT_FILE=/etc/hyperledger/fabric/tls/server.crt
      - CORE_PEER_TLS_KEY_FILE=/etc/hyperledger/fabric/tls/server.key
      - CORE_PEER_TLS_ROOTCERT_FILE=/etc/hyperledger/fabric/tls/ca.crt
      # Peer specific variables
      - CORE_PEER_ID=peer0.org1.example.com
      - CORE_PEER_ADDRESS=peer0.org1.example.com:7051
      - CORE_PEER_LISTENADDRESS=0.0.0.0:7051
      - CORE_PEER_CHAINCODEADDRESS=peer0.org1.example.com:7052
      - CORE_PEER_CHAINCODELISTENADDRESS=0.0.0.0:7052
      - CORE_PEER_GOSSIP_BOOTSTRAP=peer0.org1.example.com:7051
      - CORE_PEER_GOSSIP_EXTERNALENDPOINT=peer0.org1.example.com:7051
      - CORE_PEER_LOCALMSPID=Org1MSP
      - CORE_PEER_MSPCONFIGPATH=/etc/hyperledger/fabric/msp
      - CORE_OPERATIONS_LISTENADDRESS=peer0.org1.example.com:9444
      - CORE_METRICS_PROVIDER=prometheus
      - CHAINCODE_AS_A_SERVICE_BUILDER_CONFIG={

    "peername":"peer0org1"}
      - CORE_CHAINCODE_EXECUTETIMEOUT=300s
    volumes:
        - ../organizations/peerOrganizations/org1.example.com/peers/peer0.org1.example.com:/etc/hyperledger/fabric
        - peer0.org1.example.com:/var/hyperledger/production
    working_dir: /root
    command: peer node start
    ports:
      - 7051:7051
      - 9444:9444
    networks:
      - test

  peer0.org2.example.com:
    container_name: peer0.org2.example.com
    image: hyperledger/fabric-peer:latest
    labels:
      service: hyperledger-fabric
    environment:
      - FABRIC_CFG_PATH=/etc/hyperledger/peercfg
      - FABRIC_LOGGING_SPEC=INFO
      #- FABRIC_LOGGING_SPEC=DEBUG
      - CORE_PEER_TLS_ENABLED=true
      - CORE_PEER_PROFILE_ENABLED=false
      - CORE_PEER_TLS_CERT_FILE=/etc/hyperledger/fabric/tls/server.crt
      - CORE_PEER_TLS_KEY_FILE=/etc/hyperledger/fabric/tls/server.key
      - CORE_PEER_TLS_ROOTCERT_FILE=/etc/hyperledger/fabric/tls/ca.crt
      # Peer specific variables
      - CORE_PEER_ID=peer0.org2.example.com
      - CORE_PEER_ADDRESS=peer0.org2.example.com:9051
      - CORE_PEER_LISTENADDRESS=0.0.0.0:9051
      - CORE_PEER_CHAINCODEADDRESS=peer0.org2.example.com:9052
      - CORE_PEER_CHAINCODELISTENADDRESS=0.0.0.0:9052
      - CORE_PEER_GOSSIP_EXTERNALENDPOINT=peer0.org2.example.com:9051
      - CORE_PEER_GOSSIP_BOOTSTRAP=peer0.org2.example.com:9051
      - CORE_PEER_LOCALMSPID=Org2MSP
      - CORE_PEER_MSPCONFIGPATH=/etc/hyperledger/fabric/msp
      - CORE_OPERATIONS_LISTENADDRESS=peer0.org2.example.com:9445
      - CORE_METRICS_PROVIDER=prometheus
      - CHAINCODE_AS_A_SERVICE_BUILDER_CONFIG={

    "peername":"peer0org2"}
      - CORE_CHAINCODE_EXECUTETIMEOUT=300s
    volumes:
        - ../organizations/peerOrganizations/org2.example.com/peers/peer0.org2.example.com:/etc/hyperledger/fabric
        - peer0.org2.example.com:/var/hyperledger/production
    working_dir: /root
    command: peer node start
    ports:
      - 9051:9051
      - 9445:9445
    networks:
      - test

  cli:
    container_name: cli
    image: hyperledger/fabric-tools:latest
    labels:
      service: hyperledger-fabric
    tty: true
    stdin_open: true
    environment:
      - GOPATH=/opt/gopath
      - FABRIC_LOGGING_SPEC=INFO
      - FABRIC_CFG_PATH=/etc/hyperledger/peercfg
      #- FABRIC_LOGGING_SPEC=DEBUG
    working_dir: /opt/gopath/src/github.com/hyperledger/fabric/peer
    command: /bin/bash
    volumes:
        - ../organizations:/opt/gopath/src/github.com/hyperledger/fabric/peer/organizations
        - ../scripts:/opt/gopath/src/github.com/hyperledger/fabric/peer/scripts/
    depends_on:
      - peer0.org1.example.com
      - peer0.org2.example.com
    networks:
      - test
编写 prometheus.yml 文件
global:
scrape_interval: 15s
evaluation_interval: 15s
external_labels:
monitor: 'devopsage-monitor'
scrape_configs:
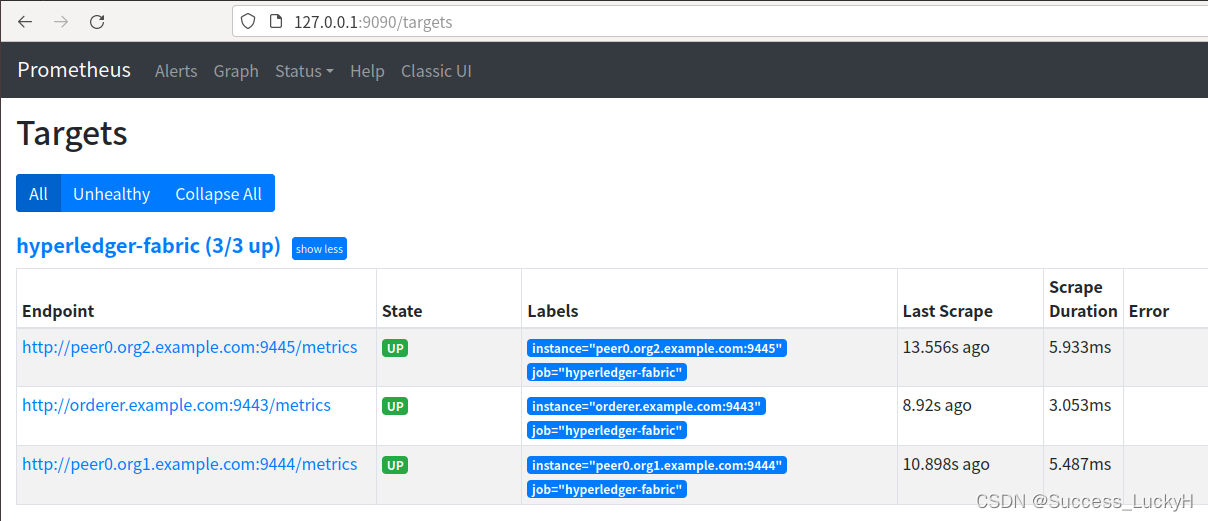
- job_name: 'hyperledger-fabric'
static_configs:
- targets: ['orderer.example.com:9443','peer0.org1.example.com:9444','peer0.org2.example.com:9445']
编写 docker-compose-prometheus.yaml 文件
version: '2.0'

services:

  prometheus:
    image: prom/prometheus:latest
    restart: always
    container_name: prometheus
    ports:
      - 9090:9090
    extra_hosts:
      - "orderer.example.com:192.168.239.133"
      - "peer0.org1.example.com:192.168.239.133"
      - "peer0.org2.example.com:192.168.239.133"
    volumes:
      - ./prometheus.yml:/etc/prometheus/prometheus.yml

  grafana:
    image: grafana/grafana:latest
    restart: always
    container_name: grafana
    ports:
      - 3000:3000
    depends_on:
      - prometheus
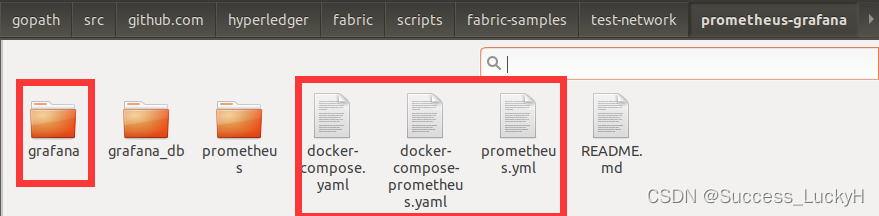
完整目录结构
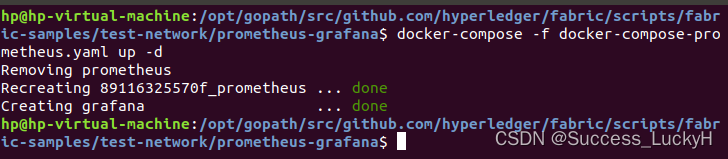
启动 prometheus
docker-compose -f docker-compose-prometheus.yaml up -d
访问 prometheus 地址
http://192.168.0.105:9999/targets
访问 grafana 地址
http://127.0.0.1:3000/
打开 Grafana 界面
输入账号密码:
默认账号:admin
默认密码:admin
之后会让你设置新密码,设置完成之后登录即可
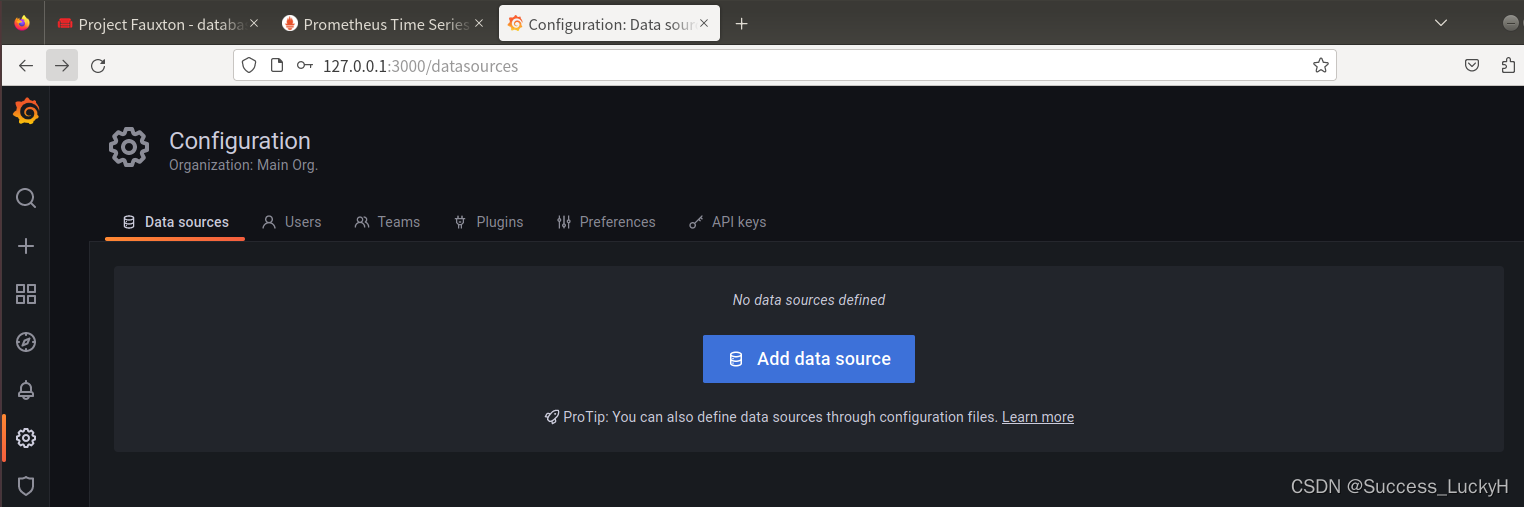
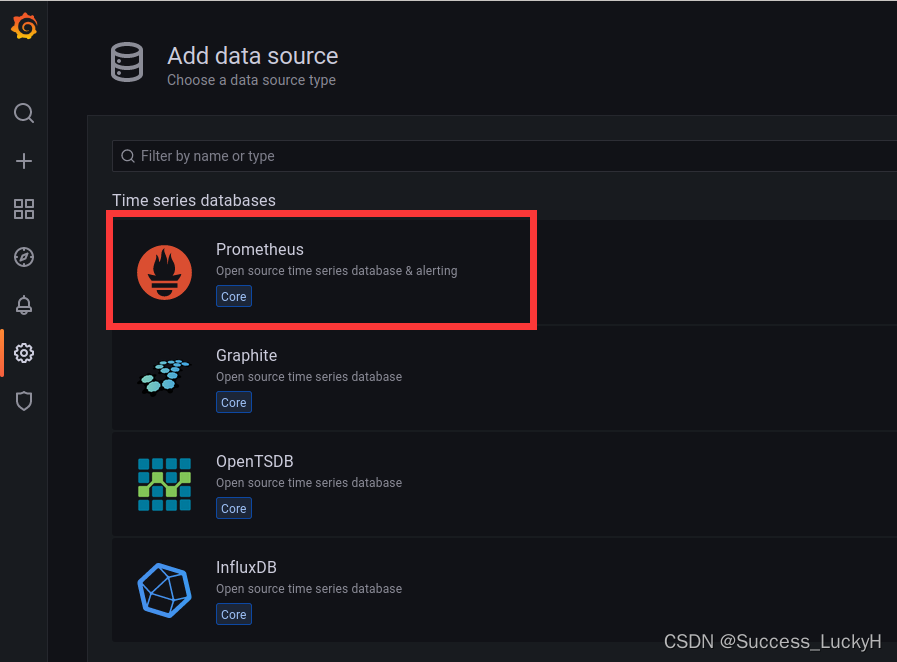
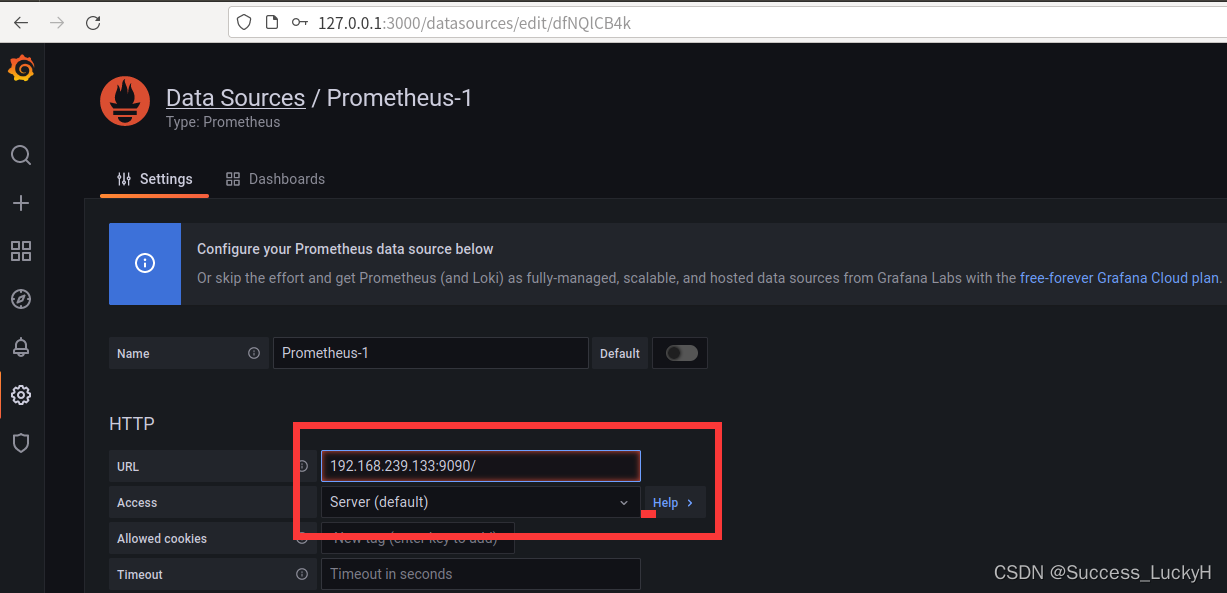
添加prometheus数据源
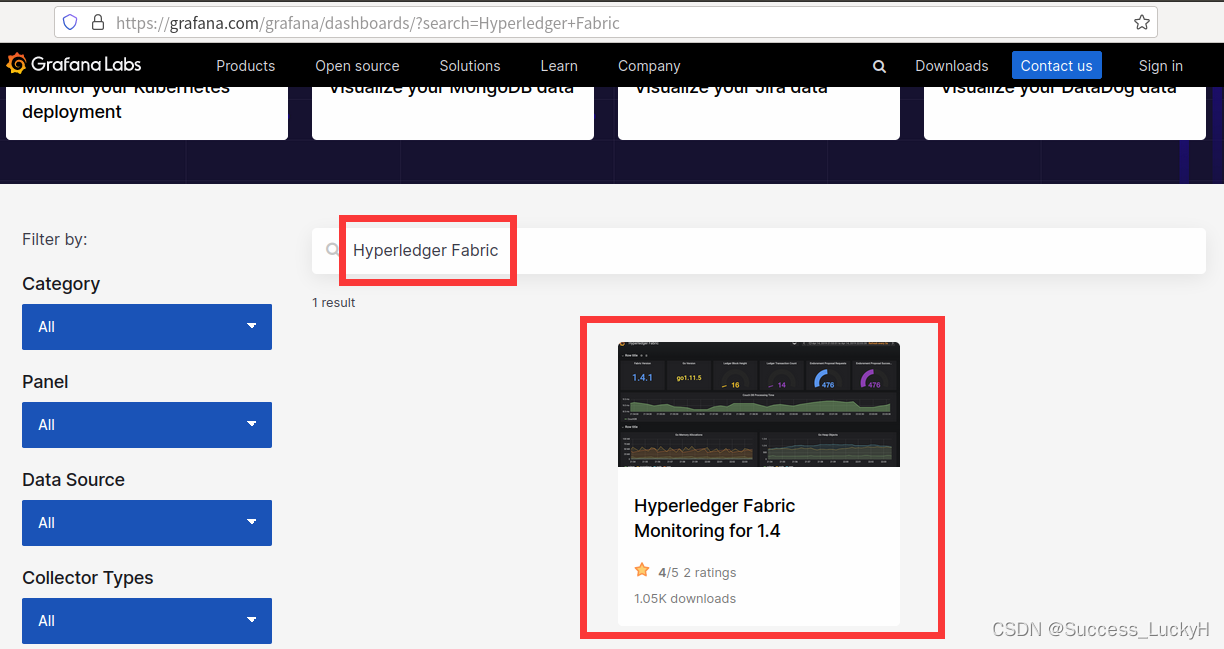
访问 https://grafana.com/grafana/dashboards/ 搜索需要监控组件的 dashboards 文件
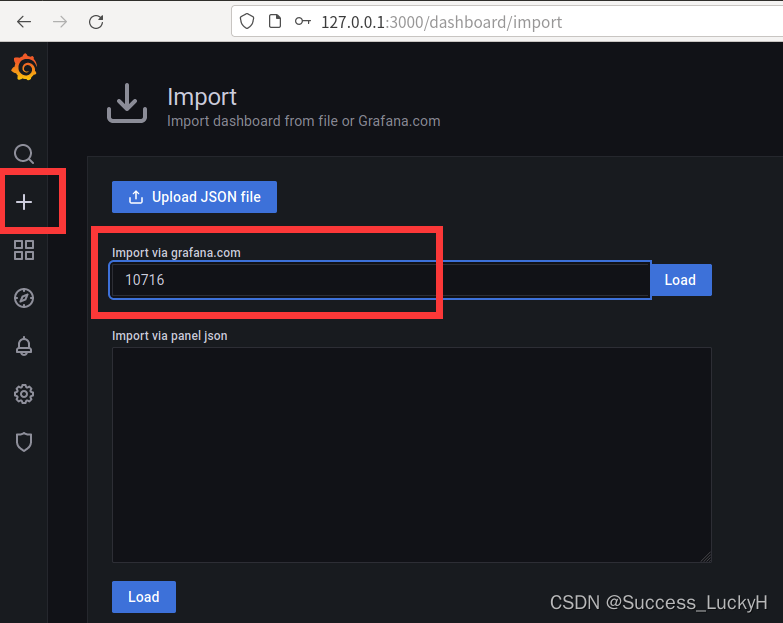
复制这个 dashboard id 添加fabric dashboard
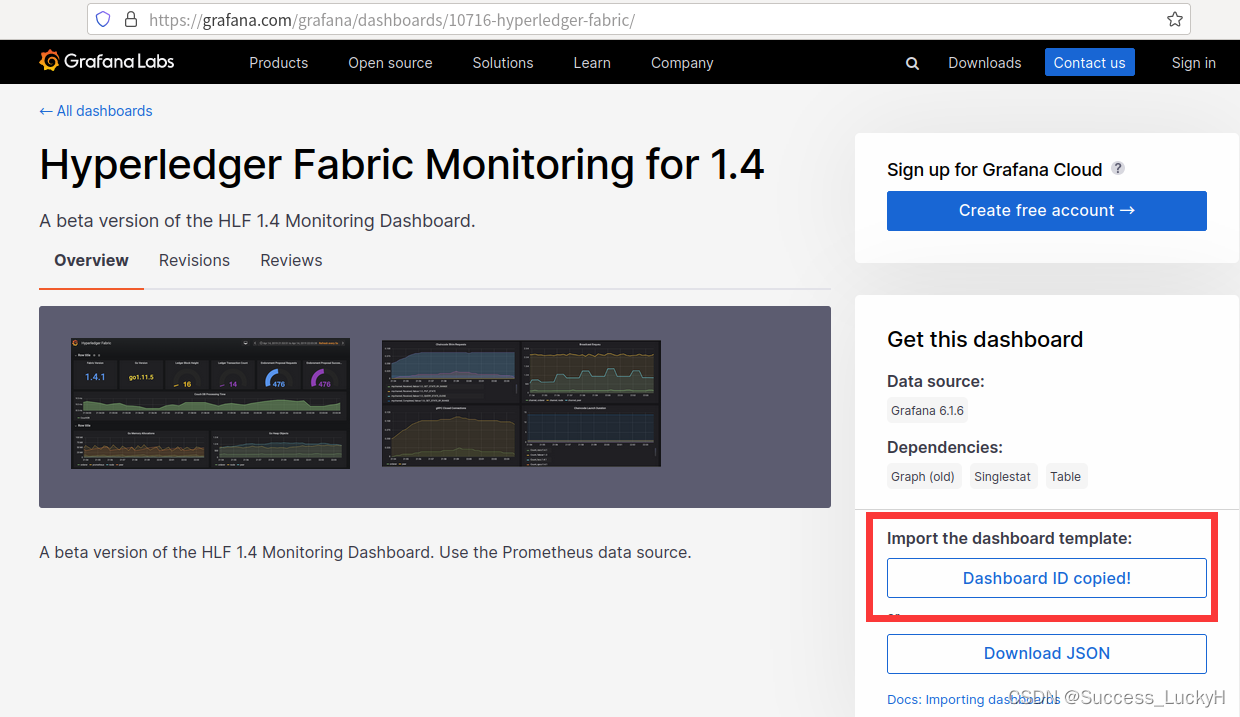
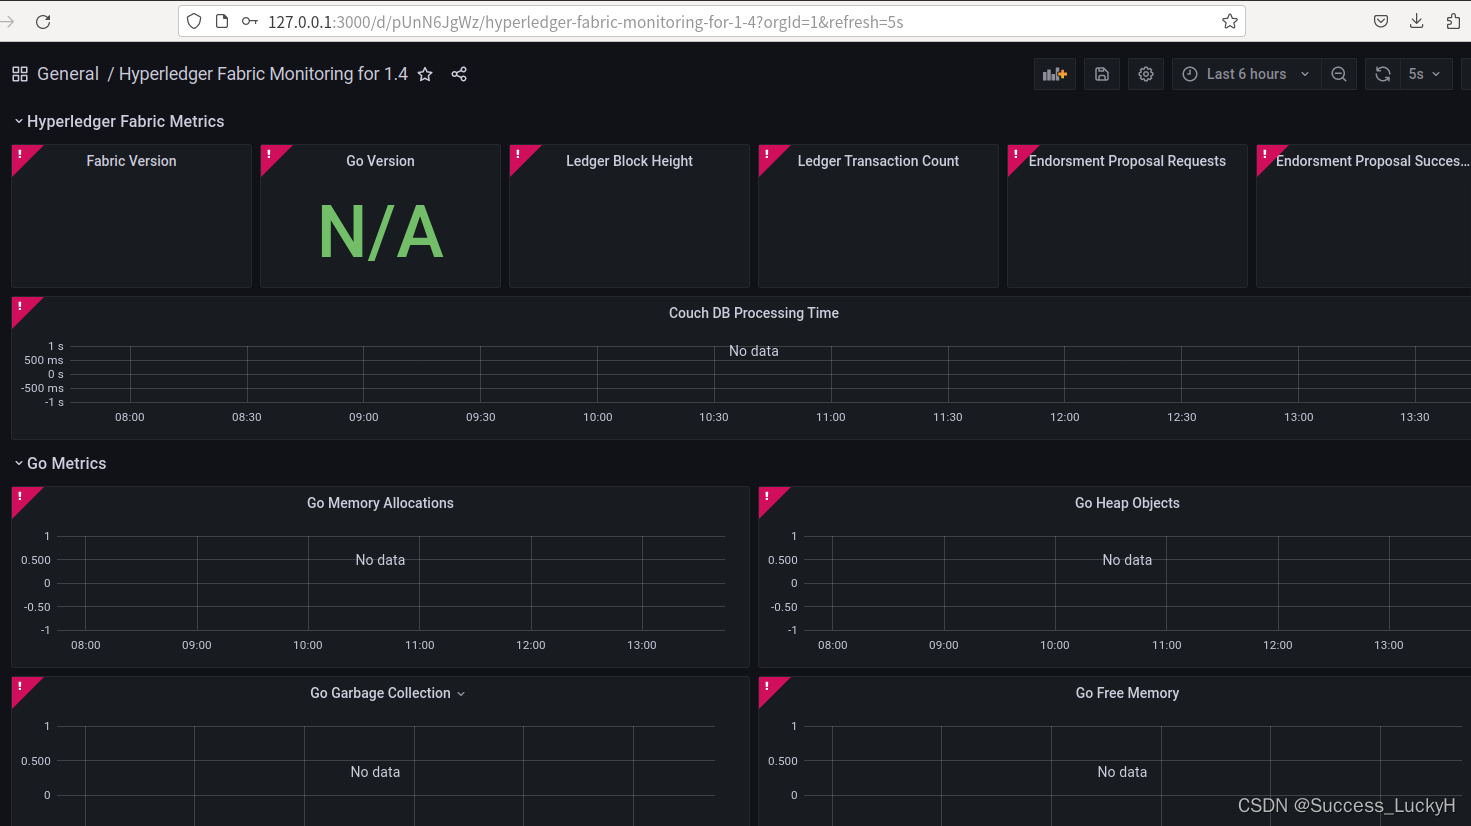
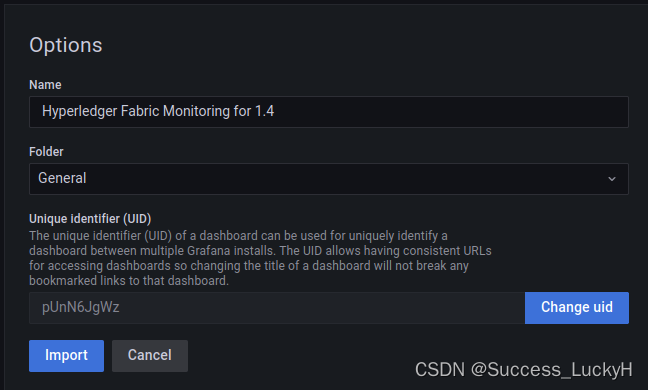
添加fabric dashboard
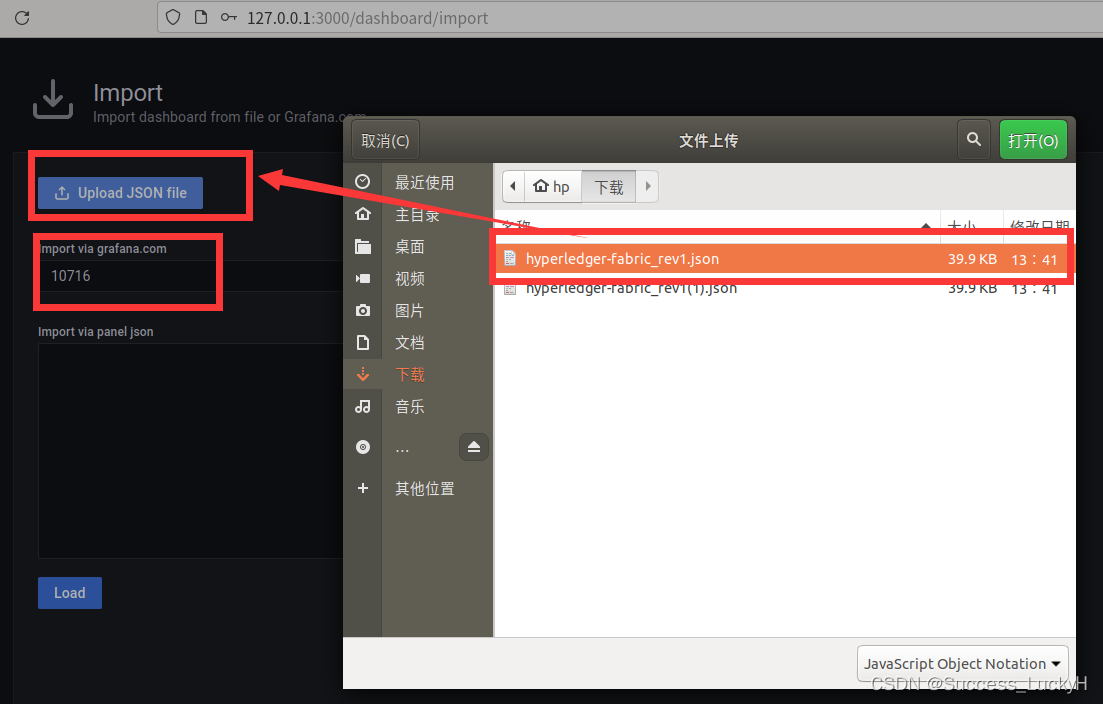
导入JSON file
效果如下,界面还是很炫酷的!