机器学习分类实例——SVM(修改)/Decision Tree/Naive Bayes
20180427-28笔记、30总结
已经5月了,毕设告一段落了,该准备论文了。前天开会老师说,希望我以后做关于语义分析那一块内容,会议期间还讨论了学姐的知识图谱的知识推理内容,感觉也挺有趣的,但是感觉应该会比较复杂。有时间的话希望对这块了解一下。其实吧,具体怎么展示我还是不太清楚。。。
 大概就是图表那个样子。我先做一个出来,让老师看看,两个礼拜写论文。24/25答辩,6月就可以去浪哈哈哈哈哈哈。
一、工作
工作主要是三个部分——修改SVM部分的代码(精简)、绘制图表、修改DT和NBY的代码
1.修改SVM部分的代码
由于需要将预测三个标签的分数,一次打印出来。所以需要分别训练三个模型并一次将预测文本输入三个模型进行预测。
那么就是:
    x = vec[:,:-3]
    y = vec[:,-3]
    y2=vec[:,-2]
    y3=vec[:,-1]

    f = open("examout.txt","r")
    newl =f.read()
    newl=list(map(str,newl.strip().split(',')))
    newv = np.array(newl)
    new_test_x = newv[:]

#    模型1
    train_x,test_x,train_y,test_y = train_test_split(x,y,test_size=0.2)
    clf1 = SVC(kernel='linear',C=0.4)
    clf1.fit(train_x,train_y)
    pred_y = clf1.predict(test_x)
    new_pred_y1 = clf1.predict(new_test_x.reshape(1,-1))
    npy1=int(new_pred_y1[0])

#   模型2
    train_x2,test_x2,train_y2,test_y2 = train_test_split(x,y2,test_size=0.2)
    clf2= SVC(kernel='linear',C=0.4)
    clf2.fit(train_x2,train_y2)
    pred_y2 = clf2.predict(test_x2)
    new_pred_y2 = clf2.predict(new_test_x.reshape(1,-1))
    npy2=int(new_pred_y2[0])

#   模型3
    train_x3,test_x3,train_y3,test_y3 = train_test_split(x,y3,test_size=0.2)
    clf3= SVC(kernel='linear',C=0.4)
    clf3.fit(train_x3,train_y3)
    pred_y3 = clf3.predict(test_x3)
    new_pred_y3 = clf3.predict(new_test_x.reshape(1,-1))
    npy3=int(new_pred_y3[0])
这样就得到了3个模型。
在上次代码中,我们通过函数classification_report(test_y,pred_y)可以得到模型的精确率、召回率及F1值。
             (precision    recall  f1-score)   support

          1       0.88      0.93      0.90       187
          2       0.00      0.00      0.00        11
          3       0.15      0.18      0.17        11
          4       0.00      0.00      0.00         7
          5       0.00      0.00      0.00         2

avg / total       0.76      0.81      0.78       218
在这里,三个模型分别对应不同的(precision、recall、f1-score),我们希望获取上表最后一排的值,最后绘制成一张表,就像这样:
那么问题来了,如何获得classification_report()中的值呢。有两种办法:
- (1)将内容输出到文本,然后再从文本读取
- (2)读取print输出流
两种办法我都试过了,第一种方法比较熟悉,所以一下就写完了:
    ff = open("crout.txt","w")
    ff.write(classification_report(test_y,pred_y))
    ff.close()
    ff2=open("crout.txt","r")
    cr=[]
    for line in ff2.readlines():
        cr.append(list(map(str,line.strip().split(','))))
    ss =str(cr[8]) #把最后一列整列打印出来['avg / total       0.89      0.92      0.90       218']

    #运用正则表达式找出小数
    fs1=[]
    for i in range(3):
        s = re.findall("\d+(\.\d+)?",ss)[i]
        s='0'+s
        s=float(s)
        fs1.append(s)
print (fs1)很明显,上面3个模型,就需要3个文本,写来写去的,感觉又麻烦又low...所以这种方式看看就好。这时候我们用print输出流,来解决获取数值的问题。我通过百度,在百度知道中看到了答案——如何获取python print语句打印到console的值
把原来的代码精简一些,用函数表示,别写在程序主体位置
class TextArea(object):
    def __init__(self):
        self.buffer = []
    def write(self, *args, **kwargs):
        self.buffer.append(args)

def mf(L=[]):
    for i in range(90):
        s = re.findall("\d+(\.\d+)?",l)[i]
        s='0'+s
        s=float(s)
        #通过观察,在正则表达式获取的小数中,所需要三个模型的P/R/F值分别位于26~28、56~58、86~88位置上,将其加入L中即可
        if i>=26 and i<=28 or i>=56 and i<=58 or i>=86 and i<=88:
            L.append(s)
    return L
再写函数主体:
    stdout = sys.stdout
    sys.stdout = TextArea()
    print(classification_report(test_y,pred_y))
    print(classification_report(test_y2,pred_y2))
    print(classification_report(test_y3,pred_y3))

    text_area, sys.stdout = sys.stdout, stdout

    l=str(text_area.buffer)
    L=[]
    L=mf(L)
    #结果L=[0.76, 0.81, 0.78, 0.91, 0.94, 0.92, 0.73, 0.75, 0.74]
    fs1=[]
    fs2=[]
    fs3=[]
    LL=range(9)
    for i in LL[:9:3]:
        fs1.append(L[i])
        fs2.append(L[i+1])
        fs3.append(L[i+2])
2.绘制图表
在这里我们得到了每个模型的precision、recall、f1-score值(分别存在fs1,fs2,fs3中),以及预测文本的预测结果npy1、npy2、npy3三个分数。
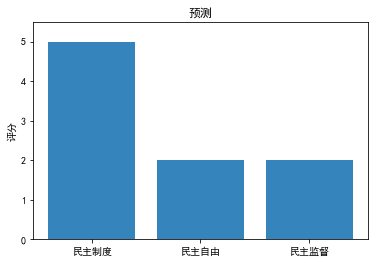
(1)预测图表
x = np.arange(3)
data = [npy1, npy2, npy3]

labels = ['民主制度', '民主自由', '民主监督']
plt.ylim(ymax=5.5, ymin=0)
plt.ylabel("评分")
plt.title("预测")
plt.bar(x, data,alpha=0.9,tick_label=labels)
plt.show()
结果:
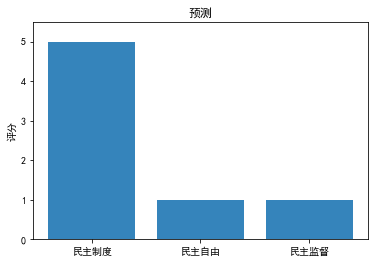
这样直观多了,上回是只给了一个“5”的评分,这样三个都能得到了。
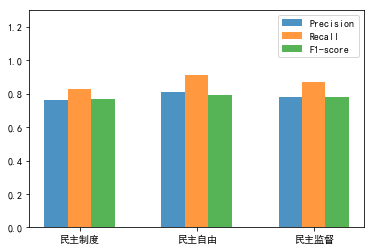
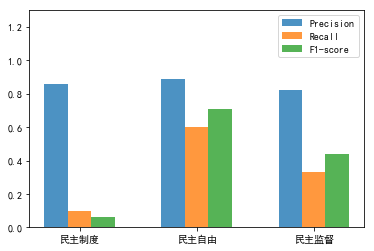
(2)precision、recall、f1-score值模型对比
total_width, n = 0.6, 3
x = np.arange(n)
width = total_width / n
x = x - (total_width - width) / 2
plt.ylim(ymax=1.3, ymin=0)
plt.bar(x, fs1,alpha=0.8, width=width, label='Precision')
plt.bar(x + width, fs2,alpha=0.8, width=width, label='Recall',tick_label = labels)
plt.bar(x + 2 * width, fs3, alpha=0.8,width=width, label='F1-score')
plt.legend()
plt.show()
得到如下结果:
3.修改DT和NBY的代码
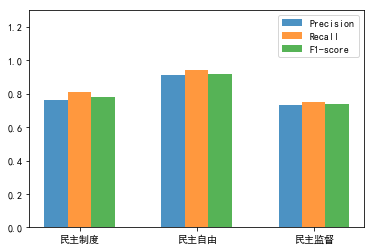
(1) Decision Tree
决策树的代码和SVM完全一样的,就是函数名字不一样。在这里直接看结果就好了:

嗯...准确率挺高不错。
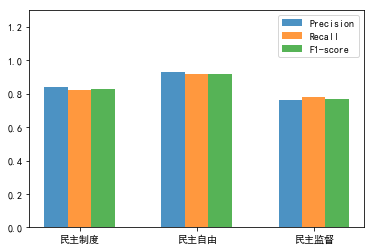
(2) Naive Bayes
朴素贝叶斯在代码上,和SVM也是一样的,但是在预测的时候,有个地方报错了
new_pred_y1 = clf.predict(new_test_x.reshape(1,-1))报错:
TypeError: ufunc 'subtract' did not contain a loop with signature matching types dtype('<U32') dtype('<U32') dtype('<U32')怎么回事呢,原来是需要将new_test_x转为float64.
参考python TypeError: ufunc 'subtract' did not contain a loop with signature matching typesdtype('S32')
只要在原来的代码加上一句转换就可以了:
    new_test_x = new_test_x.astype('float64')
    new_pred_y1 = clf.predict(new_test_x.reshape(1,-1))
那么我们来看看结果:
贝叶斯效果就比较差了。。。民主制度的准确率最低,预测效果最不好。但是给的文本,对民主制度的评分还是最高,预测效果还行。
二、总结反思
- 改进了代码,原来写的有点乱七八糟。
- 学习了图表的绘制,遇到了matplotlib的图表不能显示中文的问题。就是图表中的中文都变成了框框,怎么解决呢?参考Python中,matplotlib绘图无法显示中文的问题
三、接下来的任务
- 人工选取一些测试集,测试在评分误差为±1的情况下,准确率是多少。之前测了一些,是在训练集中选取的一些帖子,准确率达到了95%,虽然很高但是不准。
- 学习论文撰写。