边缘i检测虽然能够检测出边缘,但是边缘是不连续的。图像轮廓可以将边缘连接起来形成一个整体,其中包括目标的大小、位置、方向等信息。
1. 查找轮廓:findContours()
格式:contours, hierarchy = findCountours ( image, mode, method )
- 返回值 contours:找到的轮廓
- contours下面包括若干个contours[i], 每个contours[i]代表一个轮廓,表示一个numpy.ndarray类型。
- 获取总轮廓数:len(contours)
- 获取当前轮廓的总像素点个数:len(contours[i])
- 返回值 hierarchy:组织层次。
- 表述轮廓之间的位置嵌套关系。
- 返回4个索引编号[NEXT,BEFORE,FIRST,ROOT] 默认没有嵌套关系时为-1。
- 这个编号由参数 mode 中的提取方式而决定。
- 参数 image:输入图像,必须是8位单通道的二值图像,必须是白色对象黑色背景。
- 参数 mode:决定轮廓的提取方式:
- cv2.RETR_EXTERNAL 只检测外轮廓。
- cv2.RETR_LIST 对查找的轮廓不建立等级关系。
- cv2.RETR_CCOMP 只建立2个等级轮廓。
- cv2.RETR_TREE 建立等级树。
- 参数 method:决定了如何表达轮廓:
- cv2.CHAIN_APPROX_NONE: 保留所有的点,相邻不大于1像素。
- cv2.CHAIN_APPROX_SIMPLE: 只保留方向上的终点坐标。

2. 绘制轮廓: drawContours()
格式:image = drawContours (image, contours, contourIdx, color, thickness)
- 返回值 image:结果图像,也可以写成没有返回值 image 的形式。
- 参数 contours:需要绘制的轮廓。
- 参数 contourIdx: 需要绘制的轮廓索引。
- 参数 color:绘制的线条颜色。
- 参数 thickness:绘制的线条的宽度。
上代码:
import cv2
import numpy as np
import matplotlib.pyplot as plt

o = cv2.imread('contours.bmp')

plt.figure(figsize=(10,10),dpi=100)
plt.subplot(1,4,1)
plt.title("O")
plt.imshow(o),plt.axis('off')

# 转换为8位灰度图
gray = cv2.cvtColor(o,cv2.COLOR_BGR2GRAY)

# 二值化图像
ret, binary = cv2.threshold(gray,127,255,cv2.THRESH_BINARY)

# 提取轮廓
contours, hierarchy = cv2.findContours(binary,
                                cv2.RETR_TREE, # 建立等级树
                      cv2.CHAIN_APPROX_SIMPLE) # 保留关键点
n=len(contours) # 获取轮廓个数
contoursImg=[] # 创建一个填充轮廓的元组

for i in range(n):
    temp=np.zeros(o.shape,np.uint8) # 创建一个所有元素为0的矩阵
    contoursImg.append(temp) # 添加画布
    contoursImg[i]=cv2.drawContours(contoursImg[i], # 传入画布
                                          contours, # 提取当前的轮廓集合
                                                 i, # 第i个轮廓
                                         (0,0,255), # RGB通道选择B
                                                 5) # 线条宽度5
    # 显示
    plt.subplot(1,4,i+2)
    plt.title("Contours"+str(i))
    plt.imshow(contoursImg[i]),plt.axis('off')

print(hierarchy) # 打印组织层次
运行:
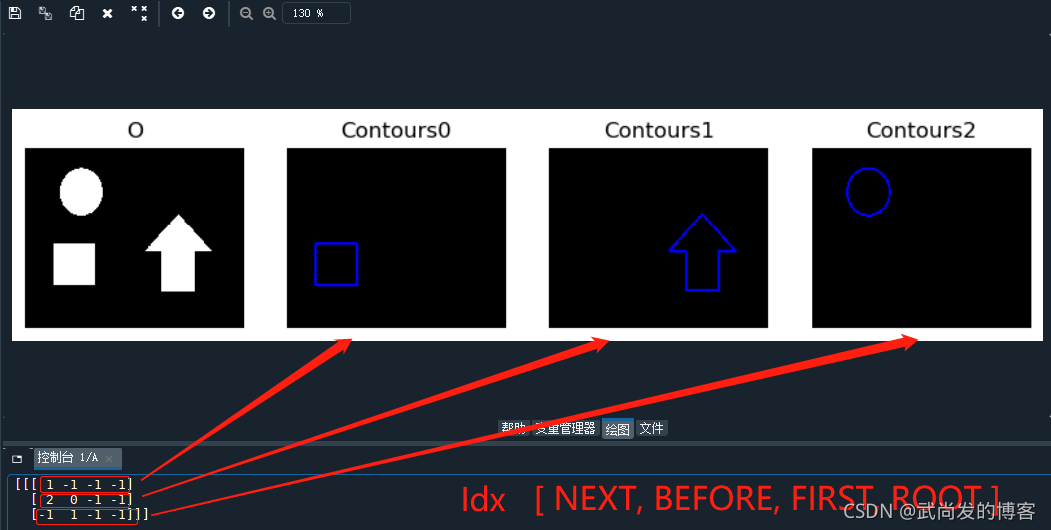
这里打印出来的层级组织:hierarchy表示的二维数组,有必要说明一下:
按照【后轮廓Index,前轮廓Index,子轮廓Index,父轮廓Index】这个顺序,首先第一数组中[1,-1,-1,-1]就表示Contours0的后轮廓索引为1,前轮廓不存在没有所以是-1,子轮廓不存在所以是-1,父轮廓不存在所以是-1。
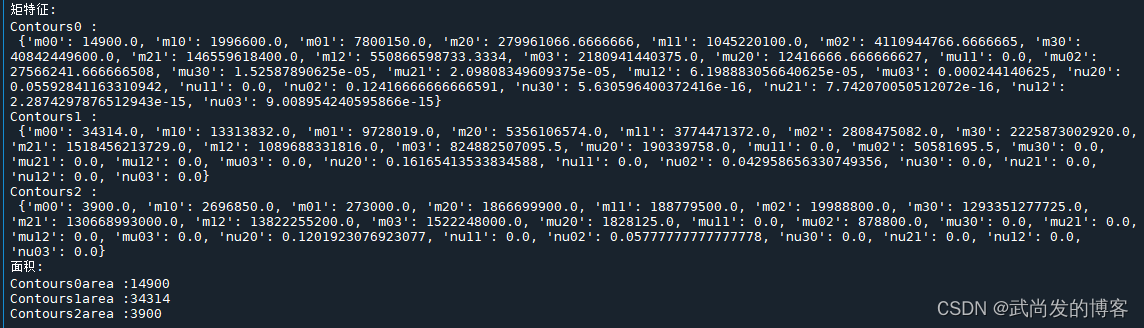
3. 矩特征:moments
比较两个图像的最简单的方式,就是比较矩特征。简单理解就是使用一组矩阵数据表示轮廓的:大小、位置、角度、形状等,当对比的矩阵数据完全相同时,这两个轮廓也相同。
-
空间矩: m00表示对象面积。
零阶矩:m00
一阶矩:m10,m01
二阶矩:m20,m11,m02
三阶矩:m30,m21,m12,m03 -
中心矩: 用来解决不同位置上两个对象的一致性对比。
二阶中心矩:mu20,mu11,mu02
三阶中心矩:mu30,mu21,mu12,mu03 -
归一化中心矩: 解决平移缩放后的两个对象的一致性对比。
二阶Hu矩:nu20,nu11,nu02
三阶Hu矩:nu30,nu21,nu12,nu03
上代码:
import cv2
import numpy as np

o = cv2.imread('moments.bmp')
cv2.imshow("original",o)
gray = cv2.cvtColor(o,cv2.COLOR_BGR2GRAY)
ret, binary = cv2.threshold(gray,127,255,cv2.THRESH_BINARY)
contours, hierarchy = cv2.findContours(binary,
                                             cv2.RETR_LIST,
                                             cv2.CHAIN_APPROX_SIMPLE)
n=len(contours)
contoursImg=[]
for i in range(n):
    temp=np.zeros(o.shape,np.uint8)
    contoursImg.append(temp)
    contoursImg[i]=cv2.drawContours(contoursImg[i],contours,i,255,3) # 绘制轮廓
    cv2.imshow("contours[" + str(i)+"]",contoursImg[i])

print("矩特征:")
for i in range(n):
    print("Contours"+str(i)+" :\n",cv2.moments(contours[i])) # 打印矩特征

print("面积:")
for i in range(n):
    print("Contours"+str(i)+"area :%d" %cv2.moments(contours[i])['m00']) # 打印轮廓面积

cv2.waitKey()
cv2.destroyAllWindows()
结果:
4. 获取轮廓的面积和周长:contourArea / arcLength
cv2.contoursArea(contours[0]) # 获取轮廓面积
cv2.arcLength(contours[0],closed) # 获取轮廓周长(closed为Ture表示轮廓是封闭的,反之。。)
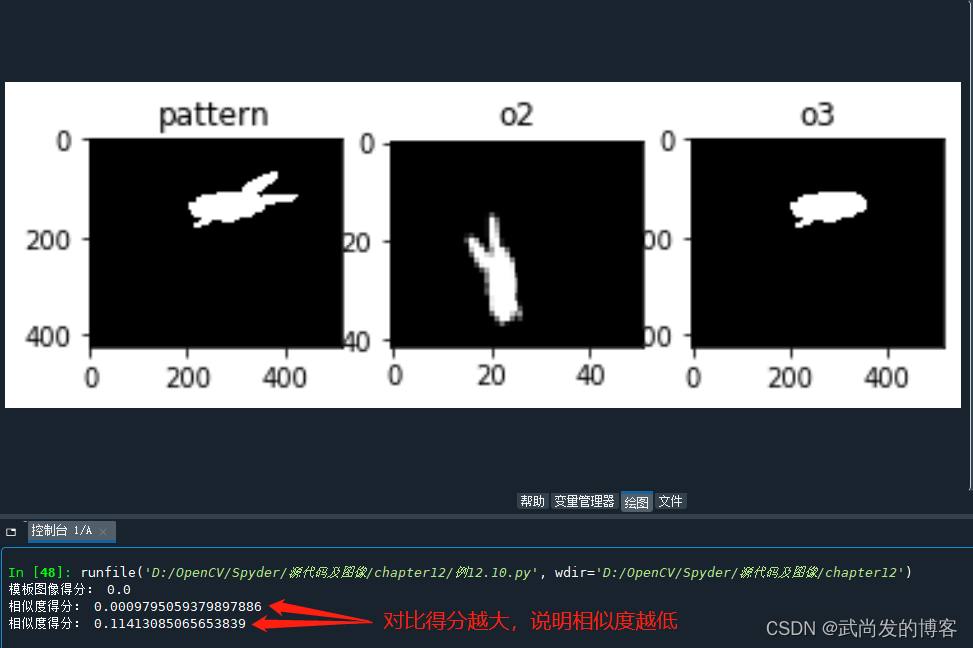
5. 形状匹配:matchShapes
score = cv2.matchShapes(灰度图像1,灰度图像2,比较Hu的方式,0)
返回一个float类型的匹配得分。
上代码:
import cv2
from matplotlib import pyplot as plt

#--------------读取3幅原始图像--------------------
o1 = cv2.imread('cs1.bmp')
o2 = cv2.imread('cs2.bmp')
o3 = cv2.imread('cc.bmp')

#--------------色彩空间转换--------------------
gray1 = cv2.cvtColor(o1,cv2.COLOR_BGR2GRAY)
gray2 = cv2.cvtColor(o2,cv2.COLOR_BGR2GRAY)
gray3 = cv2.cvtColor(o3,cv2.COLOR_BGR2GRAY)

#-------------进行Hu矩匹配--------------------
ret0 = cv2.matchShapes(gray1,gray1,2,0)
ret1 = cv2.matchShapes(gray1,gray2,2,0)
ret2 = cv2.matchShapes(gray1,gray3,2,0)
#--------------打印差值--------------------
print("模板图像得分:",ret0)
print("相似度得分:",ret1)
print("相似度得分:",ret2)

plt.subplot(131)
plt.imshow(o1)
plt.title("pattern")

plt.subplot(132)
plt.imshow(o2)
plt.title("o2")

plt.subplot(133)
plt.imshow(o3)
plt.title("o3")

cv2.waitKey()
cv2.destroyAllWindows()
运行结果:
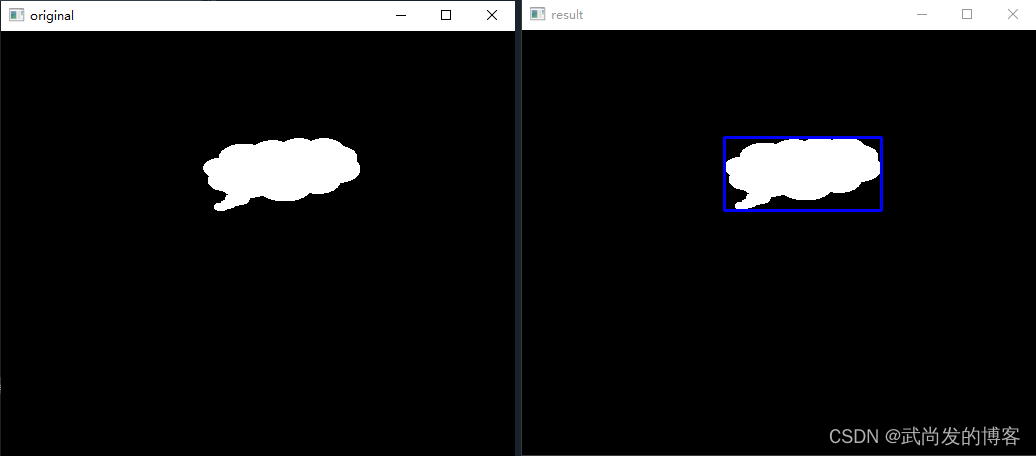
6. 矩形外围框:boundingRect
x,y,w,h = cv2.boundingRect(contours[0])
返回一个轮廓的外围框左上角的x、y、x方向长度w、y方向长度h。
上代码:
import cv2
import numpy as np

#---------------读取并显示原始图像------------------
o = cv2.imread('cc.bmp')
cv2.imshow("original",o)

#---------------提取图像轮廓------------------
gray = cv2.cvtColor(o,cv2.COLOR_BGR2GRAY)
ret, binary = cv2.threshold(gray,127,255,cv2.THRESH_BINARY)
contours, hierarchy = cv2.findContours(binary,
                                       cv2.RETR_LIST,
                                       cv2.CHAIN_APPROX_SIMPLE)

#---------------构造矩形边界------------------
x,y,w,h = cv2.boundingRect(contours[0])
rect = np.array([[[x, y]], [[x+w, y]], [[x+w, y+h]], [[x, y+h]]])
# 注意:这里的rect是一个list类型,应该以[]的方式出现
cv2.drawContours(o, [rect], -1, (255, 0,0), 2)

#---------------显示矩形边界------------------
cv2.imshow("result",o)
cv2.waitKey()
cv2.destroyAllWindows()
运行结果:
总结:关于轮廓的几何绘制方式有很多种,这里就不一一列举了,今天就先分享到这里,希望能帮到你。。。