1. 模板匹配
模板匹配就是在图像A中寻找与图像B最相似的部分,一般将图像A称为输入图像,图像B称为模板图像。操作方式是B在A图像上从左到右自上而下滑动,遍历所有的像素。
模板匹配函数:
result = cv2.matchTemplate( image, temp1, mothod[,mask] )
-
iamge::原始图像,必须为8bit或者32bit浮点图像。
-
temp1:模板图像,必须与原图同类型,并且尺寸小于等于原图。
-
method:匹配方法,有6种可能。
cv2.TM_SQDIFF :方差匹配。匹配为 0,否则数值较大。
cv2.TM_SQDIFF_NORMED:归一化平方差匹配。匹配为 0,否则数值较大。
cv2.TM_CCORR:相关性匹配,数值越 大 匹配度越高,反之。
cv2.TM_CCORR_NORMED:归一化相关匹配。数值越 大 匹配度越高,反之。
cv2.TM_CCOEFF:相关系数匹配。 1 表示完美匹配、-1表示不好的匹配、0表示没有相关性。
cv2.TM_CCOEFF_NORMED:标准归一化相关系数匹配。数值越 大 匹配度越高,反之。 -
mask:模板图像掩模,必须与temp1尺寸、类型相同。只支持 cv2.TM_SQDIFF和cv2.TM_CCORR_NORMED。
-
result:由每个位置的比较结果组合所构成的结果集(类型是32bit浮点型)。
-
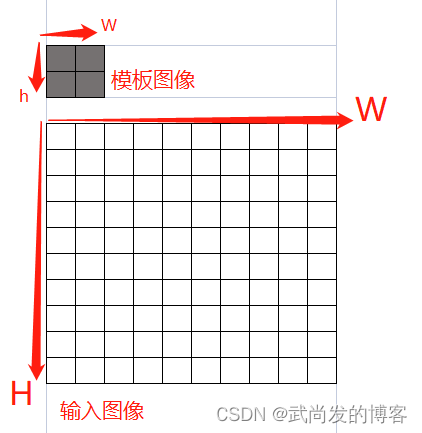
水平方向尺寸:W-w+1 .。。。。。。。。垂直方向尺寸:H-h+1
最大最小值、所在位置查找函数:
minVal, maxVal, minLoc, maxLoc = cv2.minMaxLoc(src,[,mask])
- src:单通道数组。
- minVal:最小值,否则NULL。
- maxVal:最大值,否则为NULL。
- minLoc:最小值的位置,否则NULL。
- maxLoc:最大值的位置,否则为NULL。
- mask:可以用来选取掩模的子集。
确定一个模板的左上角、右下角的位置,method为 cv2.TM_SQDIFF,所以需要用min的loc,这里topLeft 和 bottomRight 分别为:
minVal, maxVal, minLoc, maxLoc = cv2.minMaxLoc(cv2.matchTemplate函数的返回值)
topLeft = minLoc # 左上角
bottomRight = (topLeft[0]+w, topLeft[1]+h ) # 右下角(w和h分别表示模板图像的宽和高)
绘制矩形函数:
Img = cv2.rectangle(img, pt1, pt2, color[,thickness])
- img:标记的图像。
- pt1:左上角点。
- pt2:右下角点。
- color:绘制的颜色。
- thickness:边线的宽度。
上代码:
import cv2
import numpy as np
from matplotlib import pyplot as plt
img = cv2.imread('lena512g.bmp',0)
img2 = img.copy()
template = cv2.imread('temp.bmp',0) # 模板图
th, tw = template.shape[::] # 获取分辨率
img = img2.copy() # 复制原图,后面的操作都是在副本上进行
rv = cv2.matchTemplate(img,template,cv2.TM_SQDIFF) # 模板匹配
minVal, maxVal, minLoc, maxLoc = cv2.minMaxLoc(rv) # 查找匹配信息
topLeft = minLoc # 左上角点
bottomRight = (topLeft[0] + tw, topLeft[1] + th) # 右下角点
cv2.rectangle(img,topLeft, bottomRight, 255, 2) # 绘制矩形
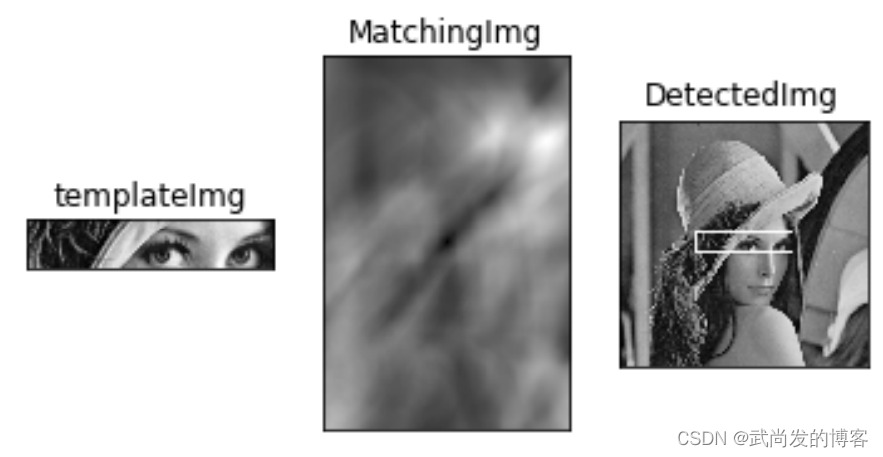
plt.subplot(131),plt.imshow(template,cmap = 'gray')
plt.title('templateImg'), plt.xticks([]), plt.yticks([])
plt.subplot(132),plt.imshow(rv,cmap = 'gray')
plt.title('MatchingImg'), plt.xticks([]), plt.yticks([])
plt.subplot(133),plt.imshow(img,cmap = 'gray')
plt.title('DetectedImg'), plt.xticks([]), plt.yticks([])
plt.show()
运行:
2. Numpy常用操作:
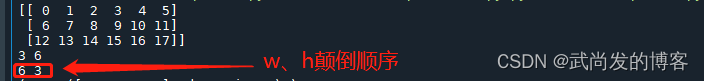
# 定义一个3行6列的图像
list2d=np.arange(18).reshape(3,6)
print(list2d)


# 获取水平、垂直方向的像素个数
w,h=list2d.shape[::]
print(w,h)

# 获取水平、垂直方向的像素个数,然后颠倒顺序
w,h=list2d.shape[::-1]
print(w,h)
运行:
where查找:
# 定义数组
a=np.array([5,9,4,56,35,15,0,3,4])
# 寻找可以整除5的元素的索引
b=np.where(a%5==0)
print(b)
运行:返回对应的索引值

二维数组检索:
am=np.array([[3,8,5,4,7],[6,12,84,32,20],[12,32,5,1,65]])
b=np.where(am>5)
print(b)
运行:

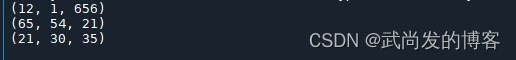
ZIP打包多数组:
# zip打包多个数组
x=[12,65,21]
y=[1,54,30]
z=[656,21,35]
t=[x,y,z]

for i in zip(*t):
    print(i)
运行:
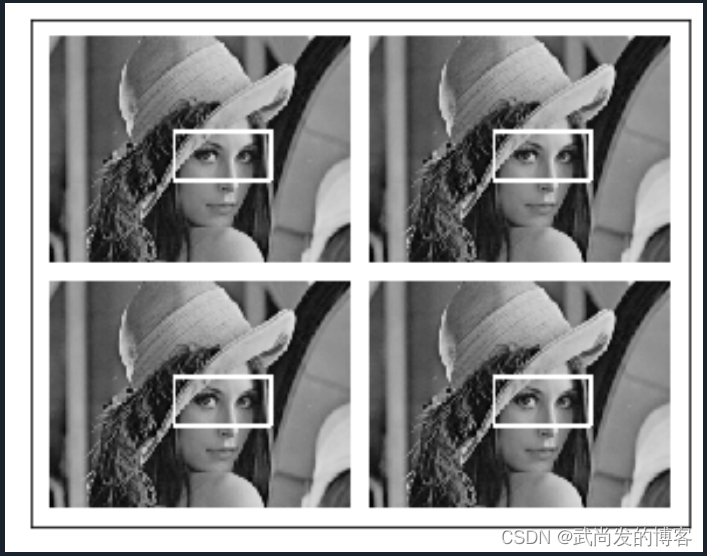
3. 多模板匹配:
获取到满足阈值的匹配结果集之后,遍历此结果集合,得到每一个的左上右下的两个点,进行绘制。
上代码:
import cv2
import numpy as np
from matplotlib import pyplot as plt

img = cv2.imread('lena4.bmp',0)
template = cv2.imread('lena4Temp.bmp',0)
w, h = template.shape[::-1]
res = cv2.matchTemplate(img,template,cv2.TM_CCOEFF_NORMED)
threshold = 0.9 # 定义阈值

# 检索匹配值大于等于阈值的图像块,生成一个新的多维数组
loc = np.where( res >= threshold)

# 遍历这些结果集,得到每一个的左上右下顶点,并绘制
for pt in zip(*loc[::-1]):
    cv2.rectangle(img, pt, (pt[0] + w, pt[1] + h), 255, 1)

plt.imshow(img,cmap = 'gray')
plt.xticks([]), plt.yticks([])
运行:
感谢观看,走过路过,点个关注,谢谢。。。