Python: scipy.signal.coherence的用法及代码示例
1. scipy.signal.coherence 用法
Python 中
scipy.signal.coherence的作用为:使用 Welch’s 方法评估离散时间信号 X X X 与 Y Y Y 的幅度平方相关估计 (MSC, Magnitude Squared Coherence Estimation) C x y C_{xy} Cxy。 C x y = ∣ P x y ∣ 2 / ( P x x × P y y ) C_{xy} = |P_{xy}|^{2/(P_{xx} \times P_{yy})} Cxy=∣Pxy∣2/(Pxx×Pyy),其中 P x x P_{xx} Pxx 与 P y y P_{yy} Pyy 为 X X X 与 Y Y Y 的功率普密度估计值 (PSD, Power Spectral Density Esitmation), P x y P_{xy} Pxy 为 X X X 与 Y Y Y 的交叉谱密度估计 (CSD, Cross Spectral Density Estimation)。
用法 API
scipy.signal.coherence(
		x,					# (array_like) 测量值的时间序列
		y,					# (array_like) 测量值的时间序列
		fs=1.0,				# (float) x 与 y 时间序列的采样率
		windows='hann',		# (str, tuple 或 数组) 窗口
		nperseg=None,		# (int) 每个段的长度,如果为 str 或 tuple,则设置为256
		noverlap=None,		# (int) 段之间重叠的点数
		nfft=None,			# (int) 如果需要用 0 填充 FFT,则使用 FFT 的长度
		detrend='constant',	# (str) 制定如何去除每段的趋势
		axis=-1				# (int) 计算相关性的轴
)
返回值
- (1)
f: ndarray:采样频率组数; - (2)
Cxy: ndarray: x x x 与 y y y 的幅度平方相关性。
2. 示例
from scipy import signal
import numpy as np
import matplotlib.pyplot as plt
# 下面代码生成两个具有一共同特征的测试信号
fs = 16000 # 采样频率
N = 1e5 # 采样点数
amp = 50 # 信号幅值
freq = 1000 # 信号的特征频率
noise_power = 0.001 * fs / 2 # 信号的噪声功率
time = np.arange(N) / fs # 信号的时间轴
b, a = signal.butter(2, 0.25, 'low') # 构造 butter 滤波器
x = np.random.normal(scale=np.sqrt(noise_power), size=time.shape)
y = signal.lfilter(b, a, x)
x += amp*np.sin(2*np.pi*freq*time)
y += np.random.normal(scale=0.1*np.sqrt(noise_power), size=time.shape)
# 计算 x 与 y 的幅度平方相关估计
f, Cxy = signal.coherence(x, y, fs, nperseg=1024)
# 使用 welch 方法分别计算 x 与 y 各自的功率谱密度估计
f, Pxx = signal.welch(x, fs, nperseg=1024)
f, Pyy = signal.welch(y, fs, nperseg=1024)
# 下面绘制结果
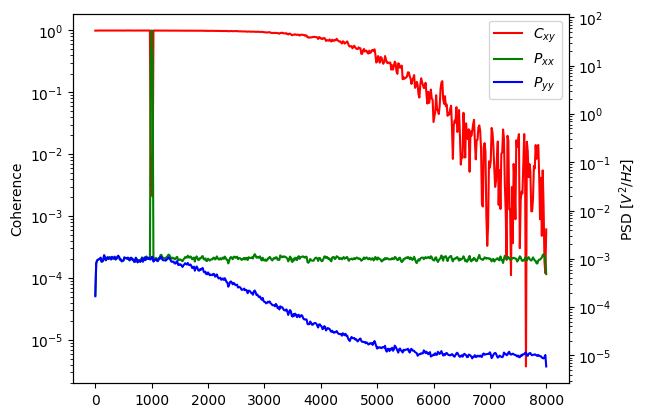
lnxy = plt.semilogy(f, Cxy, color='r', label='$C_{xy}$')
plt.ylabel('Coherence')
# 绘制第二个 y 轴,用于标注 x 与 y 的功率谱密度估计
plt.twinx()
lnx = plt.semilogy(f, Pxx, color='g', label="$P_{xx}$")
lny = plt.semilogy(f, Pyy, color='b', label="$P_{yy}$")
plt.ylabel('PSD [$V^2/Hz$]')
plt.xlabel('frequency [Hz]')
# 绘制图例
lns = lnxy + lnx + lny
labs = [l.get_label() for l in lns]
plt.legend(lns, labs)
plt.show()
代码执行结果如下图所示: