本文章将带你手摸手教学手写一个时间轴组件,小白也能学会的那种!!!
先看效果 https://live.csdn.net/v/277150
功能描述:拖拽时间轴 , 鼠标缩小放大刻度 , 随播放的视频改变刻度时间等等
开发框架:vue2.x (因为项目上用的vue2.x , 当然其他框架微改一下就能用)
要求:对canvas有基本的了解, 最好了解 , 便于代码理解 不了解也不影响, 本人开发这个项目前也只是听说过,并不了解 挂个canvas文档 Canvas - Web API 接口参考 | MDN
思路: 得有中间刻度不是? 得有时间刻度不是? 得有日期/时间不是? 得拖拽移动不是? 得有缩放功能不是? 得根据视频播放进度移动时间轴不是? 带着自己的目标一步一步实现 ,一开始想想的是利用dom操作实现时间轴功能,(固定宽度,循环刻度,显示隐藏方式切换实现缩放) 写了大概两天, 再添加移动时间后滚动效果很不丝滑,一度陷入了沉思... 终于后来找到一篇文档是利用canvas实现:手摸手带你实现一个时间轴组件 - 掘金
本文章基本思路是参考该文章,加了一些功能,也舍弃一些功能,看个人实际需求,话不多说直接开撸..
安装 moment 依赖 ( 项目中会用到该时间组件依赖 )
npm install momentvue页面引入
import moment from "moment";vue页面html部分
<template>
  <div class="timeLineContainer" ref="timeLineContainer">
    <canvas
      ref="canvas"
      @mousemove="onMousemove"
      @mousedown="onMousedown"
      @mousewheel="onMouseweel"
      @mouseup="onMouseup"
      @mouseout="onMouseout"
    ></canvas>
  </div>
</template>
vue页面data数据
 data() {
    return {
      //时间分辨对应的层级
      currentZoomIndex: 0,
      // 中间刻度的当前时间 (默认为当天的0点减12小时,即昨天中午12点,若有操作时间则为操作后的时间)
      currentTime: new Date(moment().format("YYYY-MM-DD 00:00:00")).getTime(),
      // 时间轴左侧起点所代表的时间,默认为当天的0点减12小时,即昨天中午12点
      startTimestamp:
        new Date(moment().format("YYYY-MM-DD 00:00:00")).getTime() -
        12 * ONE_HOUR_STAMP +
        15 * 60 * 1000,
      width: null, //画布容器宽度
      height: null, //画布容器高度
      mousedown: false, // 移动开关
      ctx: null, //画布容器
      mousedownX: null, // 鼠标相当于时间轴左侧的距离
      //时间段数据
      timeSegments: [
        {
          beginTime: new Date("2023-02-18 02:30:00").getTime(),
          endTime: new Date("2023-02-18 11:20:00").getTime(),
          style: {
            background: "#5881CF",
          },
        },
      ],
      timer: null,//定时器
    };
  },
methods中初始化方法 获取到canvas容器注册好长宽
温馨提示:调用init方法时,需要再dom注册之后 建议在this.$nextTick()中调用
init() {
      // 获取外层宽高
      let { width, height } = this.$refs.timeLineContainer.getBoundingClientRect();
      this.width = width;
      this.height = height;
      // 设置画布宽高为外层元素宽高
      this.$refs.canvas.width = width;
      this.$refs.canvas.height = height;
      // 获取画图上下文
      this.ctx = this.$refs.canvas.getContext("2d");
      //绘制
      this.draw();
    },
draw方法
 draw() {
      this.drawScaleLine();//绘制时间刻度
      this.drawTimeSegments(); //绘制时间段
      this.drawMiddleLine();//绘制中线  绘制原则  想要谁的层级再最上面的随后绘制 前提是层级一样的时候
    },
首先先绘制出中线 执行drawMiddleLine方法 因频繁用到canvas的绘制划线 固将划线方法封装为
drawLine('起始x轴',起始"y轴",'内容x轴','内容y轴',"内容宽度","内容颜色") 参数目前只用到五个(自定义)
    // 画中间的白色竖线
    drawMiddleLine() {
      //中线的宽度
      let lineWidth = 2;
      // 线的x坐标是时间轴的中点,y坐标即时间轴的高度
      let x = this.width / 2;
      //划线
      this.drawLine(x, 0, x, this.height, lineWidth, "#fff");
    },
drawLine方法 尽量看懂 看不懂就当是划线的方法
  // 画线段方法
    drawLine(x1, y1, x2, y2, lineWidth, color) {
      // 开始一段新路径
      this.ctx.beginPath();
      // 设置线段颜色
      this.ctx.strokeStyle =color || "#fff";
      // 设置线段宽度
      this.ctx.lineWidth = lineWidth || 1;
      // 将路径起点移到x1,y1
      this.ctx.moveTo(x1, y1);
      // 将路径移动到x2,y2
      this.ctx.lineTo(x2, y2);
      // 把路径画出来
      this.ctx.stroke();
    },
到目前为止 就能再我们的容器最中间中看到一条白线(颜色可自定义) 如下图所示

当然距离最终目的还差了十万八千里,但至少到现在能确保代码不报错 说明你已经成功了百分之***
继续明确目的 绘制刻度 绘制时间 具有事件交互才算完
定义两个全局变量控制缩放及计算
// 一小时的毫秒数
const ONE_HOUR_STAMP = 60 * 60 * 1000;
// 时间分辨率
const ZOOM = [0.5, 1, 2, 6, 12, 24];
最重要的部分来了,本段代码建议将所有业务全部完后反复阅读理解 , 先看代码再说
   //画刻度
    drawScaleLine() {
      // 时间分辨率对应的每格小时数
      const ZOOM_HOUR_GRID = [1 / 60, 1 / 60, 2 / 60, 1 / 6, 0.25, 0.5];

      // 一共可以绘制的格数,时间轴的时间范围小时数除以每格代表的小时数,24/0.5=48
      let gridNum =
        ZOOM[this.currentZoomIndex] / ZOOM_HOUR_GRID[this.currentZoomIndex];

      // 一格多少毫秒,将每格代表的小时数转成毫秒数就可以了  ;
      let msPerGrid = ZOOM_HOUR_GRID[this.currentZoomIndex] * ONE_HOUR_STAMP;

      // 每格宽度,时间轴的宽度除以总格数
      let pxPerGrid = this.width / gridNum;

      // 时间偏移量,初始时间除每格时间取余数,
      let msOffset = msPerGrid - (this.startTimestamp % msPerGrid);
      // 距离偏移量,时间偏移量和每格时间比例乘每格像素
      let pxOffset = (msOffset / msPerGrid) * pxPerGrid;

      // 时间分辨率对应的时间显示判断条件
      const ZOOM_DATE_SHOW_RULE = [
        () => {
          // 全都显示
          return true;
        },
        (date) => {
          // 每五分钟显示
          return date.getMinutes() % 5 === 0;
        },
        (date) => {
          // 显示10、20、30...分钟数
          return date.getMinutes() % 10 === 0;
        },
        (date) => {
          // 显示整点和半点小时
          return date.getMinutes() === 0 || date.getMinutes() === 30;
        },
        (date) => {
          // 显示整点小时
          return date.getMinutes() === 0;
        },
        (date) => {
          // 显示2、4、6...整点小时
          return date.getHours() % 2 === 0 && date.getMinutes() === 0;
        },
      ];

      for (let i = 0; i < gridNum; i++) {
        // 横坐标就是当前索引乘每格宽度
        let x = pxOffset + i * pxPerGrid;
        // 当前刻度的时间,时间轴起始时间加上当前格子数乘每格代表的毫秒数
        let graduationTime = this.startTimestamp + msOffset + i * msPerGrid;
        // 时间刻度高度  根据刻/时/月展示高度不同  具体可以自己去定义
        let h = 0;
        let date = new Date(graduationTime);
        if (date.getHours() === 0 && date.getMinutes() === 0) {
          // 其他根据判断条件来显示
          h = this.height * 0.3;
          // 刻度线颜色
          this.ctx.fillStyle = "rgba(151,158,167,1)";
          // 显示时间
          this.ctx.fillText(
            this.graduationTitle(graduationTime),
            x - 13,// 向左平移一半
            h + 15 // 加上行高
          );
        } else if (ZOOM_DATE_SHOW_RULE[this.currentZoomIndex](date)) {
          h = this.height * 0.2;
          this.ctx.fillStyle = "rgba(151,158,167,1)";
          this.ctx.fillText(
            this.graduationTitle(graduationTime),
            x - 13,
            h + 15
          );
        } else {
          // 其他不显示时间
          h = this.height * 0.15;
        }
        this.drawLine(x, 0, x, h, 1, "#fff");
      }
    },
其中用到一个graduationTitle方法其作用是用于再0点时候显示的是日期 方法内容如下
   //格式时间的,在0点时显示日期而不是时间
    graduationTitle(datetime) {
      let time = moment(datetime);
      // 0点则显示当天日期
      if (
        time.hours() === 0 &&
        time.minutes() === 0 &&
        time.milliseconds() === 0
      ) {
        return time.format("MM-DD");
      } else {
        // 否则显示小时和分钟
        return time.format("HH:mm");
      }
    },
现在我们就能再页面上清除的看到我们的刻度了,,但是刻度存在并无实质性交互,

按照思路执行 鼠标点击拖拽时候实现滚动 移动展示时间 鼠标离开拖拽时候获取到中线时间用于通知回放视频应该回放的时间点 . 说干就干
首先记录鼠标点击下时候的时间 onMousedown方法
  //鼠标按下的操作
    onMousedown(e) {
      let { left } = this.$refs.canvas.getBoundingClientRect();
      // 也是计算鼠标相当于时间轴左侧的距离
      this.mousedownX = e.clientX - left;
      // 设置一下标志位
      this.mousedown = true;
      // 缓存一下鼠标按下时的起始时间点
      this.mousedownCacheStartTimestamp = this.startTimestamp;
    },
移动事件 onMousemove 分点击移动跟非点击移动 点击移动为拖拽 非点击移动为平移
    // 鼠标移动事件
    onMousemove(e) {
      // 计算出相对画布的位置
      let { left } = this.$refs.canvas.getBoundingClientRect();
      let x = e.clientX - left;
      // 计算出时间轴上每毫秒多少像素
      const PX_PER_MS =
        this.width / (ZOOM[this.currentZoomIndex] * ONE_HOUR_STAMP); // px/ms
       //拖拽时候
      if (this.mousedown) {
        // 计算鼠标当前相当于鼠标按下那个点的距离
        let diffX = x - this.mousedownX;
        // 用鼠标按下时的起始时间点减去拖动过程中的偏移量,往左拖是负值,减减得正,时间就是在增加,往右拖时间就是在减少
        this.startTimestamp =
          this.mousedownCacheStartTimestamp - Math.round(diffX / PX_PER_MS);
        // 不断刷新重绘就ok了
        this.ctx.clearRect(0, 0, this.width, this.height);
        this.draw();
      } else {
        // 计算所在位置的时间  平移时候
        let time = this.startTimestamp + x / PX_PER_MS;
        // 清除画布
        this.ctx.clearRect(0, 0, this.width, this.height);
        this.draw();
        // 绘制实时的竖线及时间
        this.drawLine(x, 0, x, this.height * 0.3, "#fff", 1);
        this.ctx.fillStyle = "#fff";
        this.ctx.fillText(
          moment(time).format("YYYY-MM-DD HH:mm:ss"),
          x - 20,
          this.height * 0.3 + 20
        );
      }
    },
鼠标松开时候 触发获取中间刻度的时间 onMouseup 得到的是时间戳存到 currentTime中
//鼠标起来的操作
    onMouseup() {
      // 设置一下标志位 移动取消
      this.mousedown = false;
      //中间刻度距离左侧画布左侧距离
      let x = this.width / 2;
      // 计算出时间轴上每毫秒多少像素
      const PX_PER_MS =
        this.width / (ZOOM[this.currentZoomIndex] * ONE_HOUR_STAMP); // px/ms
      // 计算中间位置刻度的时间位置的时间
      this.currentTime = this.startTimestamp + x / PX_PER_MS;
    },
鼠标移出容器时候清除平移的日期时间 onMouseout事件
   //鼠标移出事件
    onMouseout() {
      // 清除画布
      this.ctx.clearRect(0, 0, this.width, this.height);
      //重新绘制画布
      this.draw();
    },
到目前位置时间轴基本功能大致已经差不多完成 看下效果

之前有说到鼠标滚轮滚动时候能缩放时间刻度效果 onMouseweel事件 事件中的currentTime一定要为正线的时间刻度,否者再缩放时候 时间刻度会变动 (第一点再初始化时候给currentTime一个值,第二点在拖拽后计算出中线刻度时间)
  //鼠标滚动事件
    onMouseweel(event) {
      let e = window.event || event;
      let delta = Math.max(-1, Math.min(1, e.wheelDelta || -e.detail));
      if (delta < 0) {
        // 缩小
        if (this.currentZoomIndex + 1 >= ZOOM.length - 1) {
          this.currentZoomIndex = ZOOM.length - 1;
        } else {
          this.currentZoomIndex++;
        }
      } else if (delta > 0) {
        // 放大
        if (this.currentZoomIndex - 1 <= 0) {
          this.currentZoomIndex = 0;
        } else {
          this.currentZoomIndex--;
        }
      }
      this.ctx.clearRect(0, 0, this.width, this.height);
      // 重新计算起始时间点,当前时间-新的时间范围的一半
      this.startTimestamp =
        this.currentTime - (ZOOM[this.currentZoomIndex] * ONE_HOUR_STAMP) / 2;
      this.draw();
    },
展示图:省略 自行测试 用鼠标滚动可以缩放改变时间刻度即可
想想最后只剩下时间轴自己移动(定时器) 具体业务根据实际情况 我这里是拿到中间播放时间去请求回放视频流,再视频播放后有一个play回调,再回调中直接执行 在暂停 pause 回调中清除定时器
play()与pause()要根据每个人播放器不同而定
 //播放
play(){
    this.timer = setInterval(() => {
      //项目中我设置的是1秒钟移动一下刻度,结合实际情况分析  需要考虑跟播放速度 我本地项目不涉及到播放速度暂未考虑
      this.startTimestamp += 1000;
      //记录中间位置刻度 否者滚动之后中间刻度位置丢失
      this.onMouseup()
      // 不断刷新重绘就ok了
      this.ctx.clearRect(0, 0, this.width, this.height);
      this.draw();
    }, 1000);
}
//暂停
pause(){
    clearInterval(this.timer);
}
一定再页面销毁时候清除定时器
  beforeDestroy() {
    clearInterval(this.timer);
  },
大功告成了~~~
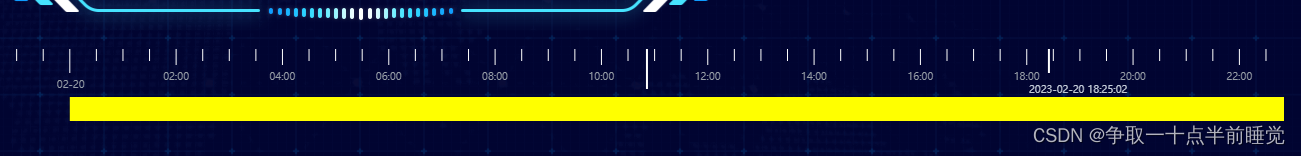
拓展在canvas中展示一个自定义时间段(直白点说我要展示2023年2月20一整天到时间轴中标记出来)
在draw方法中调用一个drawTimeSegments方法 方法中的timeSegments对象有格式要求 可以参考data中timeSegments的格式 颜色/样式都可以自定义
距离timeSegments参数:
timeSegments: [
        {
          beginTime: new Date("2023-02-20 00:00:00").getTime(),
          endTime: new Date("2023-02-20 23:59:59").getTime(),
          style: {
            background: "#ffff00",
          },
        },
      ],
//绘制时间段 开始到结束时都在
drawTimeSegments() {
const PX_PER_MS =
this.width / (ZOOM[this.currentZoomIndex] * ONE_HOUR_STAMP); // px/ms
this.timeSegments.forEach((item) => {
if (
item.beginTime <=
this.startTimestamp +
ZOOM[this.currentZoomIndex] * ONE_HOUR_STAMP &&
item.endTime >= this.startTimestamp
) {
let x = (item.beginTime - this.startTimestamp) * PX_PER_MS;
let w;
if (x < 0) {
x = 0;
w = (item.endTime - this.startTimestamp) * PX_PER_MS;
} else {
w = (item.endTime - item.beginTime) * PX_PER_MS;
}
this.ctx.fillStyle = item.style.background;
this.ctx.fillRect(x, this.height * 0.6, w, this.height * 0.3);
}
});
},
终于结束了..... 如有不足请留言斧正