“ 本文的核心内容均取于官网,配置文件也大致参考官网 ”
what prometheus
“想要了解一门技术,最好的开始就是看它的官网”。
Prometheus官网:https://prometheus.io/(推荐)

prometheus中文技术文档:Introduction · Prometheus中文技术文档
Prometheus 是一款基于时序数据库的开源监控告警系统,非常适合Kubernetes集群的监控。
Prometheus将其指标收集并存储为时间序列数据,即指标信息与记录它的时间戳一起存储,以及称为标签的可选键值对。(架构大致如下图)

prometheus有很多比较细的知识点,这里首先知道分为三部分:采集、存储计算、应用。
Installing prometheus
进入Prometheus官网,点击GET STARTED,再点击 Download the latest release。


prometheus核心组服务,做采集和存储分析计算,根据电脑的操作系统安装:

若本地为Windows系统,还需上传到虚拟机:

# 使用命令tar xvfz prometheus-*.tar.gzcd prometheus-*
then result ↓

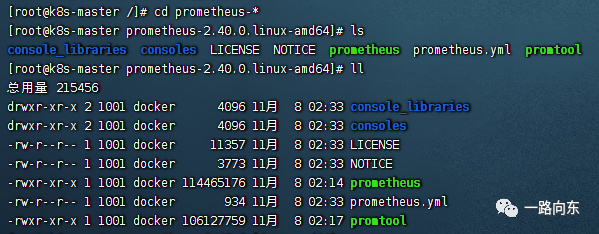
把prometheus.yml打开就能看到和官网上prometheus自身配置文件差不多的样式内容。可以通过这个配置文件启动prometheus(命令如下)。
./prometheus --config.file=prometheus.yml如果在云服务器上运行,那么可以(对应机器上运行)localhost:9090。本地访问机器就需要“机器IP:9090”或在hosts文件下配置好域名再访问9090端口,如果本地访问不到,可能是安全组9090端口没打开。然后会自动跳转到prometheus访问界面:

根据官网的提示(接下来相当于prometheus自己采集自己的指标),通过在Expression输入 Prometheus_target_interval_length_seconds(度量名称),然后点击Execute可以看到prometheus采集到自己的数据指标(返回多个不同的时间序列,相同的度量名但标签不同):

可以使用不同的查询来实现不同的功能。例如:第99百分位延迟
prometheus_target_interval_length_seconds{quantile="0.99"}统计返回的时间序列数
count(prometheus_target_interval_length_seconds)self-scraped Prometheus每秒中创建块的速率
rate(prometheus_tsdb_head_chunks_created_total[1m])Additional metrics
这里参考官网,用node_exporter为目标。先下载安装。

tar -xzvf node_exporter-*.*.tar.gzcd node_exporter-*.*# Start 3 example targets in separate terminals:./node_exporter --web.listen-address 127.0.0.1:8080./node_exporter --web.listen-address 127.0.0.1:8081./node_exporter --web.listen-address 127.0.0.1:8082# 如果要Windows本机服务部署在云服务器上的,用环回地址是访问不通的,改成0.0.0.0就可以看到了# 这里是用一台机器运行起来三个,在不同的终端是就能达成目的


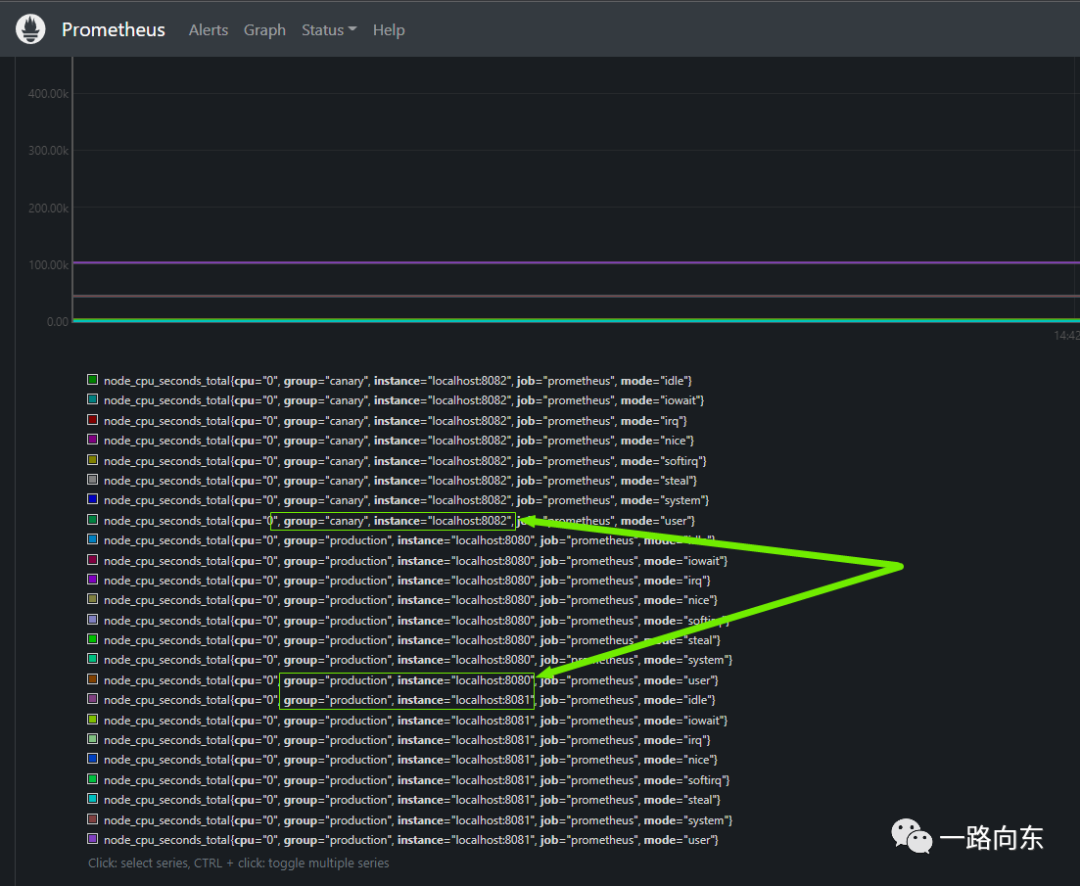
现在我们将配置 Prometheus 来清除这些新目标。让我们将所有三个端点分组到一个名为 node 的 job 中。重启 Prometheus 。

可以在访问刚刚的prometheus仪表盘,输入node_cpu_seconds_total并执行。
Advanced configuration
为了提高效率,我们还可以提前在 Prometheus 中配置一些规则。
比如指令:
5分钟的窗口内测量的在每个实例的所有cpu上平均的每秒cpu时间速率(node_cpu_seconds_total)(但保留job, instance and mode维度)
avg by (job, instance, mode) (rate(node_cpu_seconds_total[5m]))创建在prometheus的安装目录下与prometheus.yml同级prometheus.rules.yml
groups:- name: cpu-noderules:- record: job_instance_mode:node_cpu_seconds:avg_rate5mexpr: avg by (job, instance, mode) (rate(node_cpu_seconds_total[5m]))
修改 prometheus.yml:

重新运行Prometheus结果:
