python读取OpenFOAM VTK结果
发现很多CFDer都有很多后处理的需求,而Paraiew虽然强大,之前也写过用paraview自带的pvpython编写后处理脚本的教程,但用户编程方面还是差点意思。最近找到了直接用python的meshio库读取vtk文件的方法,理论上可以实现任意后处理需求,在此记录。
meshio库
https://github.com/nschloe/meshio/
有多种网格格式可用于表示非结构化网格,meshio 可以读写或转换以下所有内容 :Abaqus(.inp)、ANSYSmsh(.msh)、AVS-UCD(.AVS)、CGNS(.CGNS)、DOLFIN XML(.XML)、Exodus(.e,.exo)、FLAC3D(.f3grid)、H5M(.H5M)、Kratos/MDPA(.MDPA)、Medit(.mesh,.meshb)、MED/Solome(.MED)、Nastran(bulk data,.bdf,.fem,.nas)、Netgen(.vol,.vol.gz),Neuroglancer预计算格式,Gmsh(格式版本2.2、4.0和4.1,.msh)、OBJ(.OBJ)、OFF(.OFF)、PERMAS(.post、.post.gz、.dato、.dato.gz)、PLY(.PLY)、STL(.STL)、Tecplot.dat、TetGen.node/。ele、SVG(仅2D输出)(.SVG)、SU2(.SU2)、UGRID(.UGRID)、VTK(.VTK)、VTU(.VTU)、WKT(TIN)(.WKT)、XDMF(.XDMF、.xmf)。
安装:
pip install meshio[all]
conda install -c conda-forge meshio
拉入所有可选的依赖项。默认情况下,meshio只使用numpy。)然后可以使用命令行工具
meshio convert    input.msh output.vtk   # convert between two formats

meshio info       input.xdmf             # show some info about the mesh

meshio compress   input.vtu              # compress the mesh file
meshio decompress input.vtu              # decompress the mesh file

meshio binary     input.msh              # convert to binary format
meshio ascii      input.msh              # convert to ASCII format
读文件
import meshio

mesh = meshio.read(
    filename,  # string, os.PathLike, or a buffer/open file
    # file_format="stl",  # optional if filename is a path; inferred from extension
    # see meshio-convert -h for all possible formats
)
# mesh.points, mesh.cells, mesh.cells_dict, ...

# mesh.vtk.read() is also possible
OpenFOAM生成VTK文件
将OpenFOAM文件生成vtk结果
reconstructPar
foamToVTK
paraview ./VTK/cfd_1.vtk
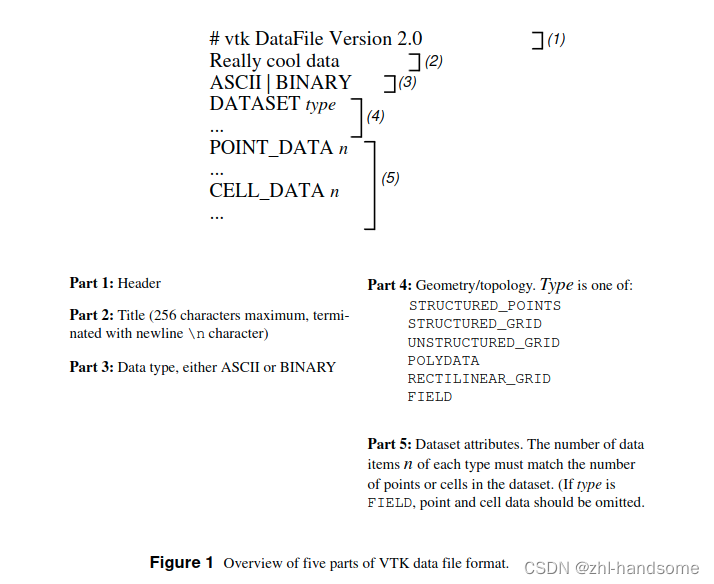
VTK文件结构
参考文件 https://vtk.org/wp-content/uploads/2015/04/file-formats.pdf
python 读取vtk文件
import meshio
import numpy as np
import matplotlib.pyplot as plt
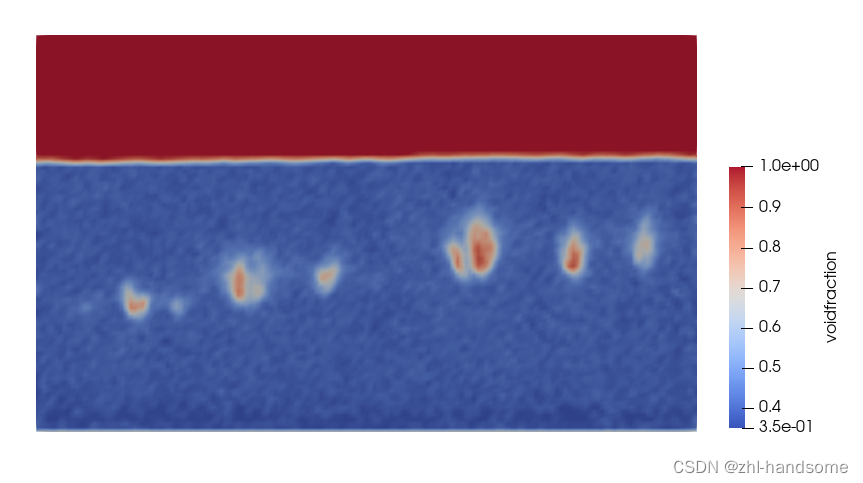
mesh = meshio.read("bubble.vtk")
# 0.4 * 0.015 * 0.24 = Nx * Ny * Nz = 160 * 6 *96
# print(mesh)
vf_cell = mesh.cell_data['voidfraction'][0]
Nx = 160
Ny = 6
Nz = 96
Lx = 160
Ly = 96
vf_all = np.reshape(mesh.cell_data['voidfraction'][0], (Nz, Ny, Nx))
# 这里小细节一定要反过来写顺序,vtk文件格式决定的
slice1 = vf_all[:,3,:]
# 上下翻转
slice1 = np.flip(slice1, axis=0)
color = plt.get_cmap("bwr", 100)(matrix)
fig = plt.figure()
# ax = fig.add_subplot(111, projection='3d')
ax = fig.add_subplot(111)
ax.set_xticks(np.arange(0, Lx, 1))
ax.set_yticks(np.arange(0, Ly, 1))
ax.set_xticklabels([' ']*Lx)
ax.set_yticklabels([' ']*Ly)
ax.set_xticks(np.arange(-.5, Lx, 1), minor=True)
ax.set_yticks(np.arange(-.6, Ly, 1), minor=True)
ax.grid(which='minor', color='black', linestyle='-', linewidth=0.5)
ax.imshow(slice1,cmap='bwr')
plt.show()
后面想做什么操作可以都在python里进行了。