转载请注明出处:小锋学长生活大爆炸[xfxuezhang.cn]
目录
安装库
# check scikit-learn version
import sklearn
print(sklearn.__version__)
创建数据集(如果你有数据就跳过这步)
分类数据:
# test classification dataset
from sklearn.datasets import make_classification
# define dataset
X, y = make_classification(n_samples=1000, n_features=10, n_informative=5, n_redundant=5, random_state=1)
# summarize the dataset
print(X.shape, y.shape)
回归数据:
# test regression dataset
from sklearn.datasets import make_regression
# define dataset
X, y = make_regression(n_samples=1000, n_features=10, n_informative=5, random_state=1)
# summarize the dataset
print(X.shape, y.shape)
线性回归特征重要性
# linear regression feature importance
from sklearn.datasets import make_regression
from sklearn.linear_model import LinearRegression
from matplotlib import pyplot
# define dataset
X, y = make_regression(n_samples=1000, n_features=10, n_informative=5, random_state=1)
# define the model
model = LinearRegression()
# fit the model
model.fit(X, y)
# get importance
importance = model.coef_
# summarize feature importance
for i,v in enumerate(importance):
 print('Feature: %0d, Score: %.5f' % (i,v))
# plot feature importance
pyplot.bar([x for x in range(len(importance))], importance)
pyplot.show()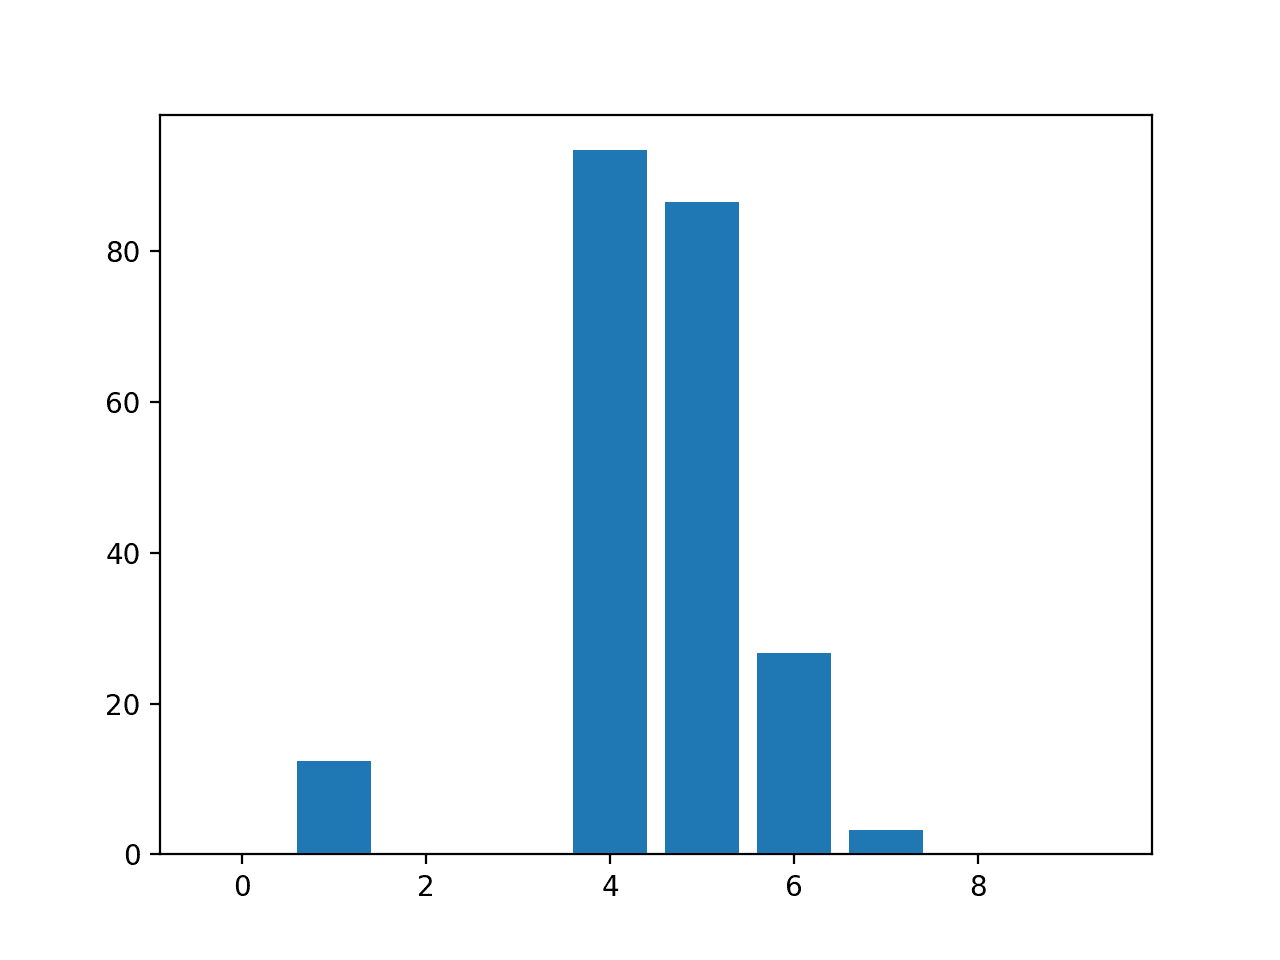
逻辑回归特征重要性
# logistic regression for feature importance
from sklearn.datasets import make_classification
from sklearn.linear_model import LogisticRegression
from matplotlib import pyplot
# define dataset
X, y = make_classification(n_samples=1000, n_features=10, n_informative=5, n_redundant=5, random_state=1)
# define the model
model = LogisticRegression()
# fit the model
model.fit(X, y)
# get importance
importance = model.coef_[0]
# summarize feature importance
for i,v in enumerate(importance):
	print('Feature: %0d, Score: %.5f' % (i,v))
# plot feature importance
pyplot.bar([x for x in range(len(importance))], importance)
pyplot.show()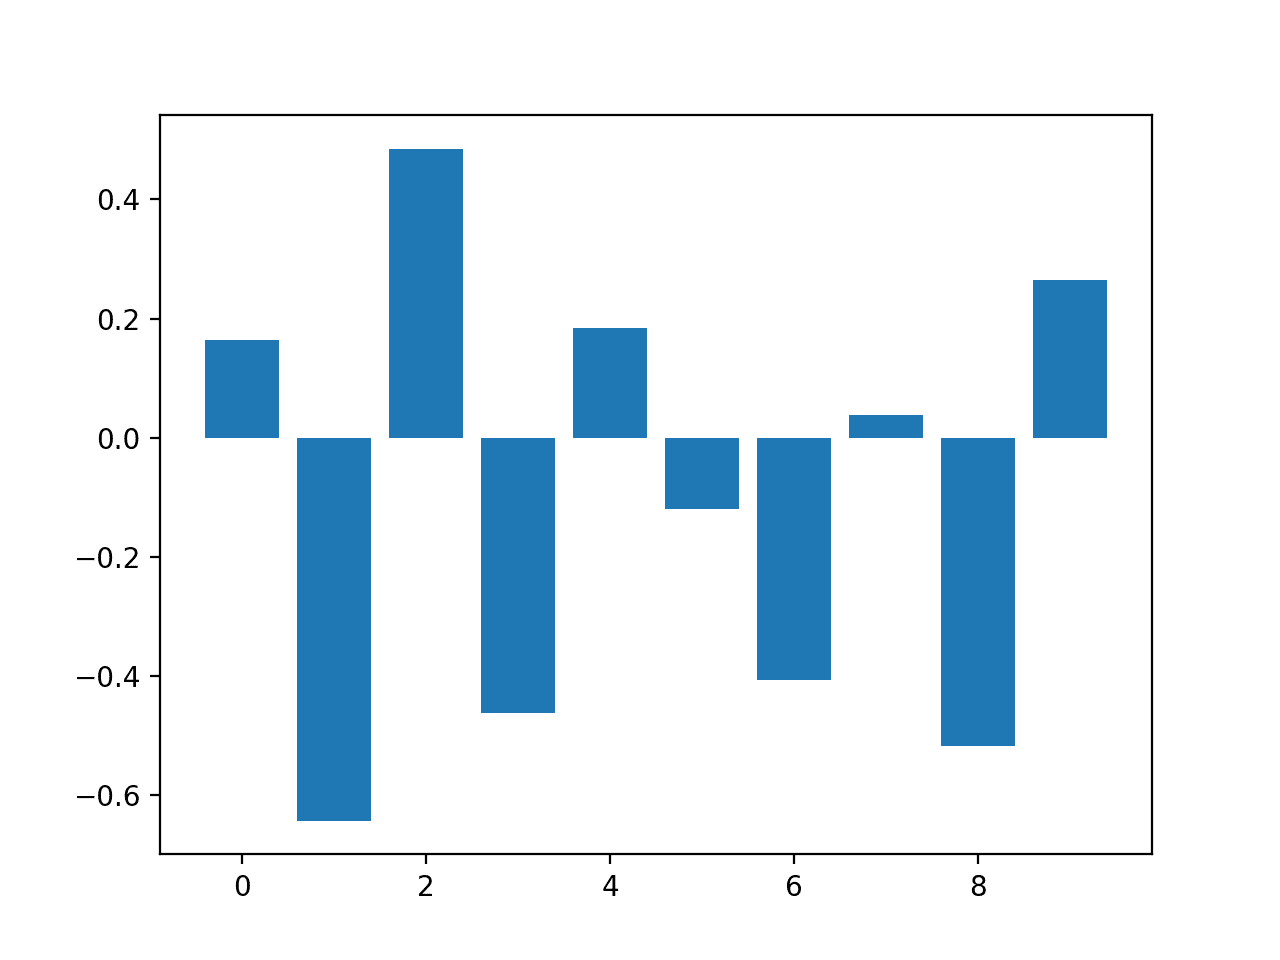
决策树特征重要性
CART 回归特征重要性
# decision tree for feature importance on a regression problem
from sklearn.datasets import make_regression
from sklearn.tree import DecisionTreeRegressor
from matplotlib import pyplot
# define dataset
X, y = make_regression(n_samples=1000, n_features=10, n_informative=5, random_state=1)
# define the model
model = DecisionTreeRegressor()
# fit the model
model.fit(X, y)
# get importance
importance = model.feature_importances_
# summarize feature importance
for i,v in enumerate(importance):
	print('Feature: %0d, Score: %.5f' % (i,v))
# plot feature importance
pyplot.bar([x for x in range(len(importance))], importance)
pyplot.show()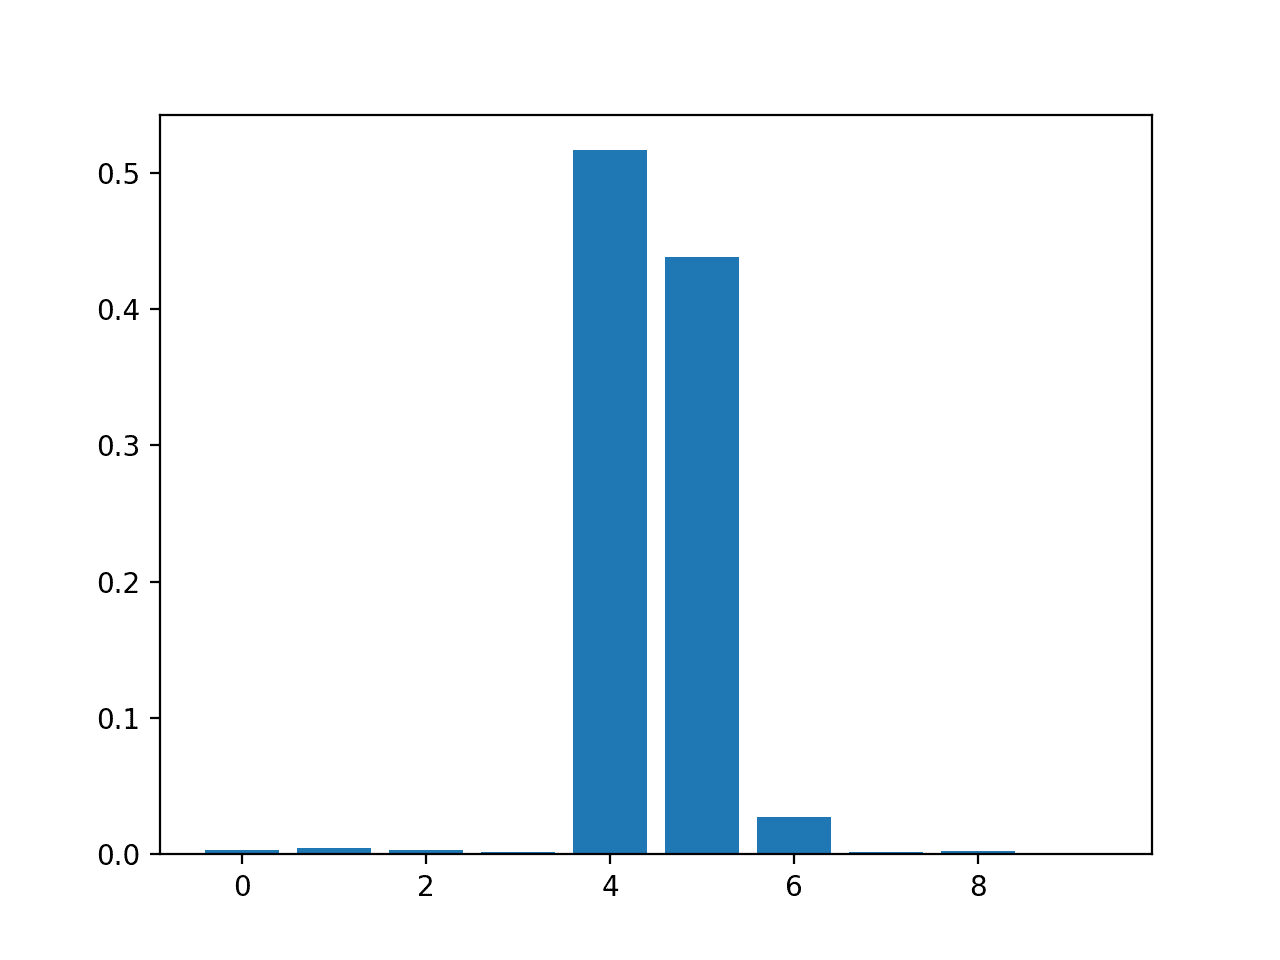
CART 分类特征重要性
# decision tree for feature importance on a classification problem
from sklearn.datasets import make_classification
from sklearn.tree import DecisionTreeClassifier
from matplotlib import pyplot
# define dataset
X, y = make_classification(n_samples=1000, n_features=10, n_informative=5, n_redundant=5, random_state=1)
# define the model
model = DecisionTreeClassifier()
# fit the model
model.fit(X, y)
# get importance
importance = model.feature_importances_
# summarize feature importance
for i,v in enumerate(importance):
	print('Feature: %0d, Score: %.5f' % (i,v))
# plot feature importance
pyplot.bar([x for x in range(len(importance))], importance)
pyplot.show()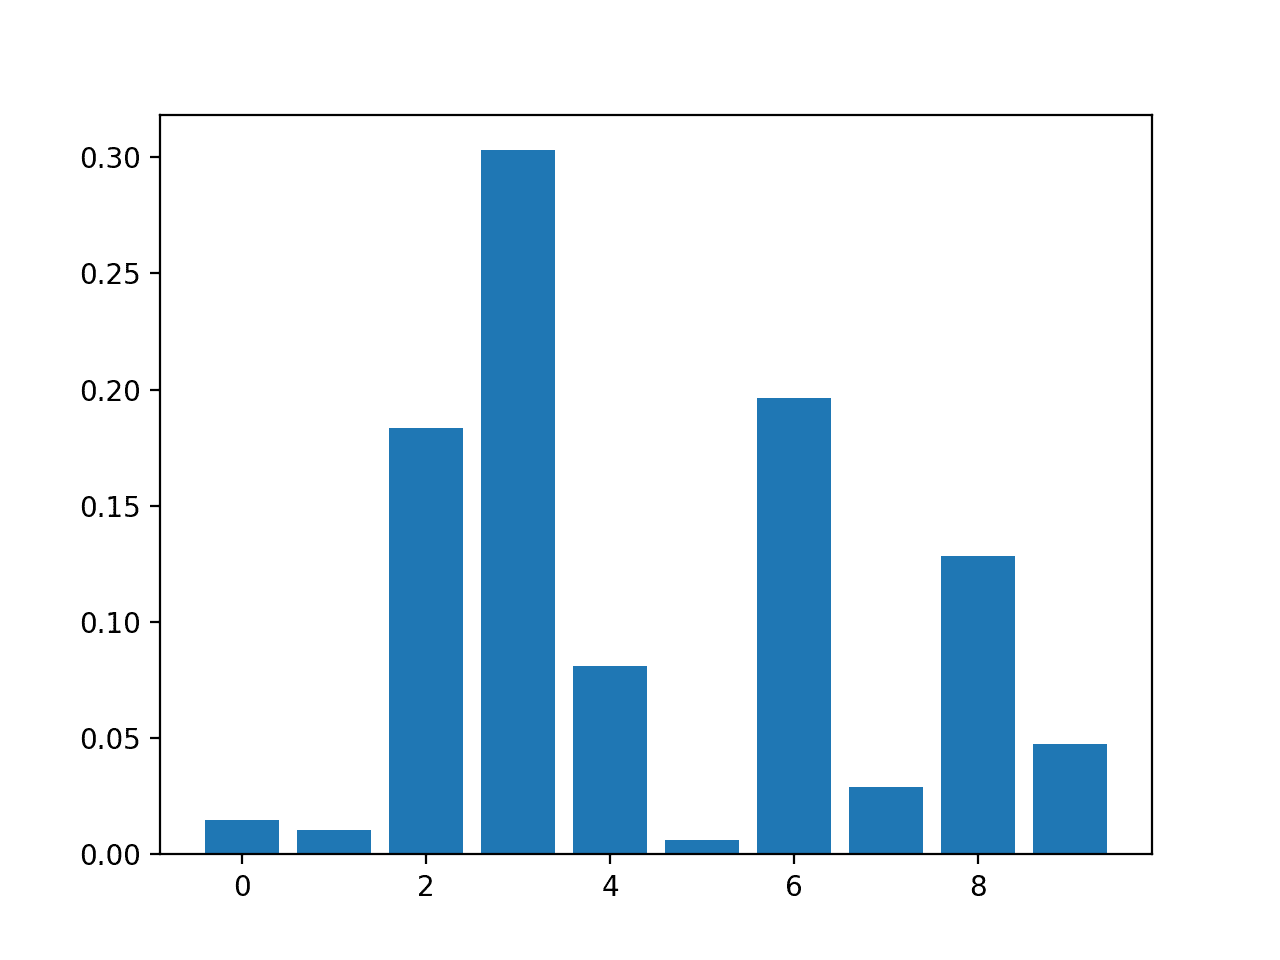
随机森林特征重要性
随机森林回归特征重要性
# random forest for feature importance on a regression problem
from sklearn.datasets import make_regression
from sklearn.ensemble import RandomForestRegressor
from matplotlib import pyplot
# define dataset
X, y = make_regression(n_samples=1000, n_features=10, n_informative=5, random_state=1)
# define the model
model = RandomForestRegressor()
# fit the model
model.fit(X, y)
# get importance
importance = model.feature_importances_
# summarize feature importance
for i,v in enumerate(importance):
	print('Feature: %0d, Score: %.5f' % (i,v))
# plot feature importance
pyplot.bar([x for x in range(len(importance))], importance)
pyplot.show()
随机森林分类特征重要性
# random forest for feature importance on a classification problem
from sklearn.datasets import make_classification
from sklearn.ensemble import RandomForestClassifier
from matplotlib import pyplot
# define dataset
X, y = make_classification(n_samples=1000, n_features=10, n_informative=5, n_redundant=5, random_state=1)
# define the model
model = RandomForestClassifier()
# fit the model
model.fit(X, y)
# get importance
importance = model.feature_importances_
# summarize feature importance
for i,v in enumerate(importance):
	print('Feature: %0d, Score: %.5f' % (i,v))
# plot feature importance
pyplot.bar([x for x in range(len(importance))], importance)
pyplot.show()
XGBoost 特征重要性
XGBoost 回归特征重要性
# xgboost for feature importance on a regression problem
from sklearn.datasets import make_regression
from xgboost import XGBRegressor
from matplotlib import pyplot
# define dataset
X, y = make_regression(n_samples=1000, n_features=10, n_informative=5, random_state=1)
# define the model
model = XGBRegressor()
# fit the model
model.fit(X, y)
# get importance
importance = model.feature_importances_
# summarize feature importance
for i,v in enumerate(importance):
	print('Feature: %0d, Score: %.5f' % (i,v))
# plot feature importance
pyplot.bar([x for x in range(len(importance))], importance)
pyplot.show()
XGBoost 分类特征重要性
# xgboost for feature importance on a classification problem
from sklearn.datasets import make_classification
from xgboost import XGBClassifier
from matplotlib import pyplot
# define dataset
X, y = make_classification(n_samples=1000, n_features=10, n_informative=5, n_redundant=5, random_state=1)
# define the model
model = XGBClassifier()
# fit the model
model.fit(X, y)
# get importance
importance = model.feature_importances_
# summarize feature importance
for i,v in enumerate(importance):
	print('Feature: %0d, Score: %.5f' % (i,v))
# plot feature importance
pyplot.bar([x for x in range(len(importance))], importance)
pyplot.show()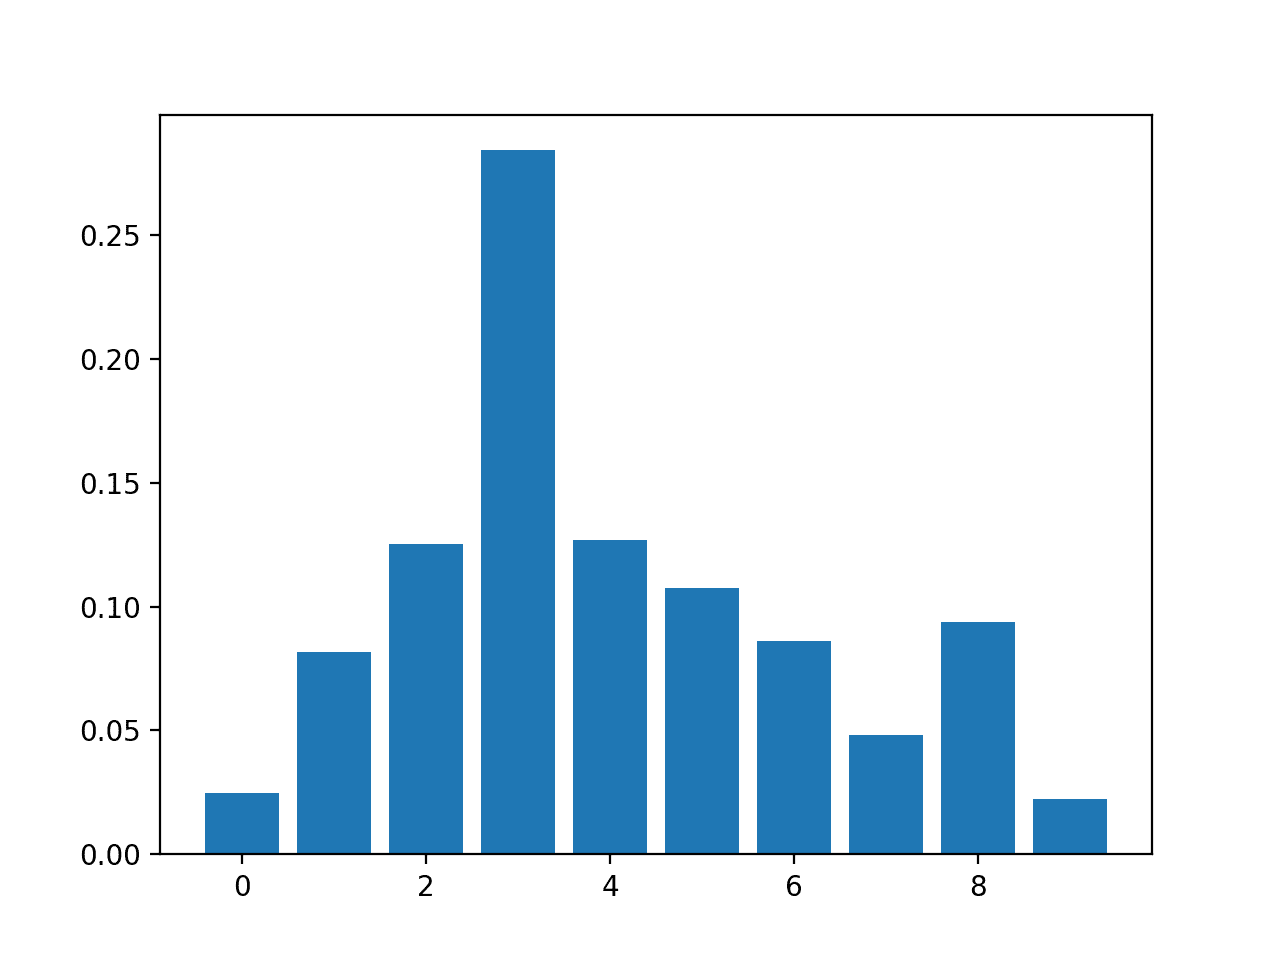
排列特征重要性
回归的排列特征重要性
# permutation feature importance with knn for regression
from sklearn.datasets import make_regression
from sklearn.neighbors import KNeighborsRegressor
from sklearn.inspection import permutation_importance
from matplotlib import pyplot
# define dataset
X, y = make_regression(n_samples=1000, n_features=10, n_informative=5, random_state=1)
# define the model
model = KNeighborsRegressor()
# fit the model
model.fit(X, y)
# perform permutation importance
results = permutation_importance(model, X, y, scoring='neg_mean_squared_error')
# get importance
importance = results.importances_mean
# summarize feature importance
for i,v in enumerate(importance):
	print('Feature: %0d, Score: %.5f' % (i,v))
# plot feature importance
pyplot.bar([x for x in range(len(importance))], importance)
pyplot.show()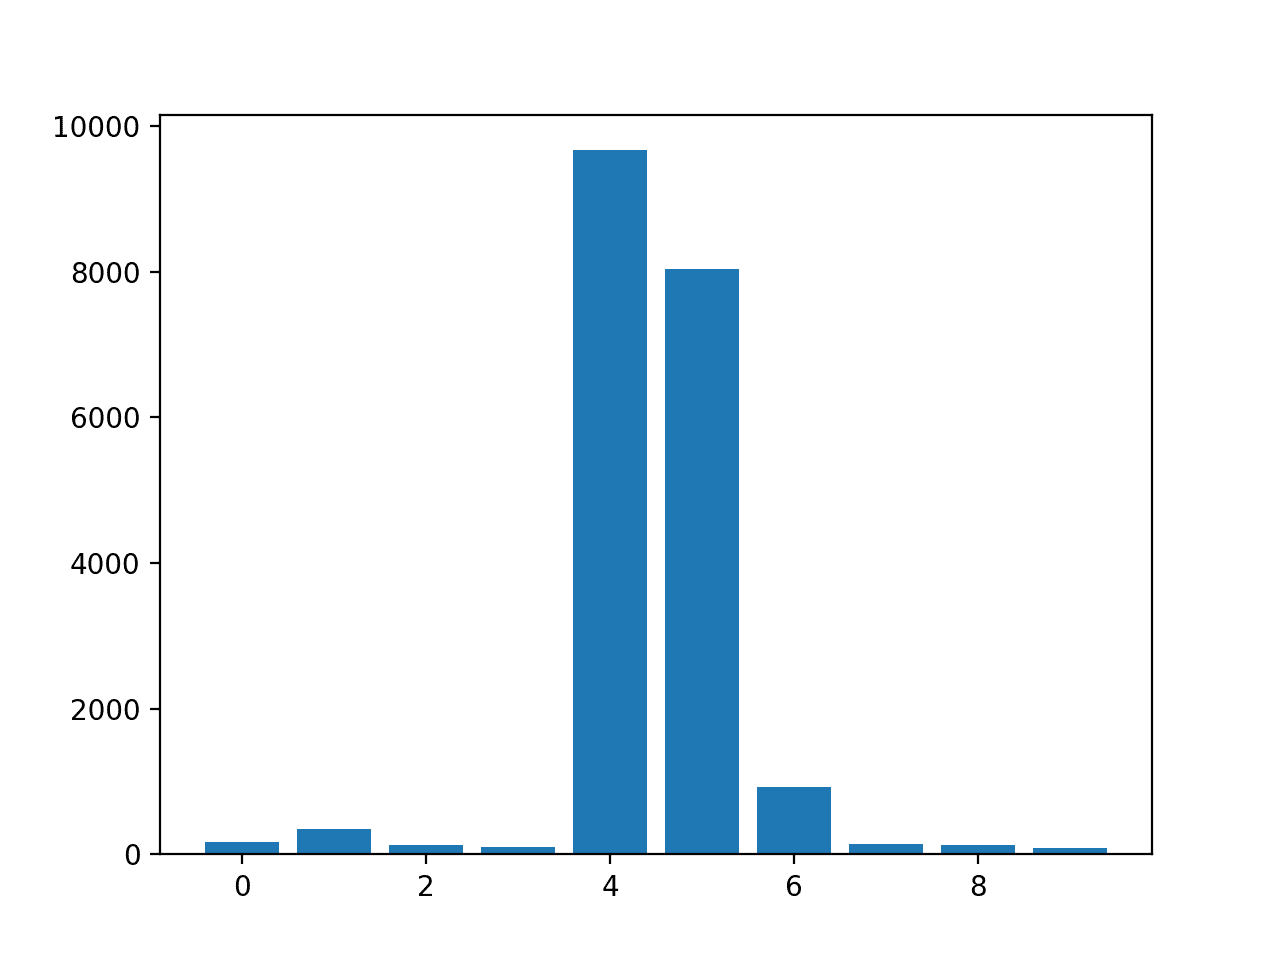
排列特征对分类的重要性
# permutation feature importance with knn for classification
from sklearn.datasets import make_classification
from sklearn.neighbors import KNeighborsClassifier
from sklearn.inspection import permutation_importance
from matplotlib import pyplot
# define dataset
X, y = make_classification(n_samples=1000, n_features=10, n_informative=5, n_redundant=5, random_state=1)
# define the model
model = KNeighborsClassifier()
# fit the model
model.fit(X, y)
# perform permutation importance
results = permutation_importance(model, X, y, scoring='accuracy')
# get importance
importance = results.importances_mean
# summarize feature importance
for i,v in enumerate(importance):
	print('Feature: %0d, Score: %.5f' % (i,v))
# plot feature importance
pyplot.bar([x for x in range(len(importance))], importance)
pyplot.show()
具有重要性的特征选择
# evaluation of a model using 5 features chosen with random forest importance
from sklearn.datasets import make_classification
from sklearn.model_selection import train_test_split
from sklearn.feature_selection import SelectFromModel
from sklearn.ensemble import RandomForestClassifier
from sklearn.linear_model import LogisticRegression
from sklearn.metrics import accuracy_score

# feature selection
def select_features(X_train, y_train, X_test):
	# configure to select a subset of features
	fs = SelectFromModel(RandomForestClassifier(n_estimators=1000), max_features=5)
	# learn relationship from training data
	fs.fit(X_train, y_train)
	# transform train input data
	X_train_fs = fs.transform(X_train)
	# transform test input data
	X_test_fs = fs.transform(X_test)
	return X_train_fs, X_test_fs, fs

# define the dataset
X, y = make_classification(n_samples=1000, n_features=10, n_informative=5, n_redundant=5, random_state=1)
# split into train and test sets
X_train, X_test, y_train, y_test = train_test_split(X, y, test_size=0.33, random_state=1)
# feature selection
X_train_fs, X_test_fs, fs = select_features(X_train, y_train, X_test)
# fit the model
model = LogisticRegression(solver='liblinear')
model.fit(X_train_fs, y_train)
# evaluate the model
yhat = model.predict(X_test_fs)
# evaluate predictions
accuracy = accuracy_score(y_test, yhat)
print('Accuracy: %.2f' % (accuracy*100))
Bar Chart of Linear Regression Coefficients as Feature Importance Scores 图像 小部件