目录
前言
博主之前刚刚被学弟邀请参与了2023美赛,这也是第一次正式接触数学建模竞赛,现在已经提交等待结果了,希望能拿一个不错的成绩。
在参与过程中我们涉及到了数据分析,我来记录和分享一下我们使用的分析算法。
目的
联合国(UN)已经制定了17个可持续发展目标(SDGs)。实现这些目标最终将改善世界各地许多人的生活。这些目标并不是相互独立的。因此,通常在某些目标中获得的积极收益会对其他目标产生影响(积极的或消极的,有时两者都有)。这种相互联系使实现所有目标成为一个流动的过程,可以考虑资金限制和其他国家和国际优先事项。此外,技术进步、全球大流行病、气候变化、区域战争和难民流动的影响也对许多目标产生了严重影响。
现在给定了17个可持续发展目标在每个年份中对应的分数,需要分析每个目标之间的相关性,要求使用Pearson, Spearman, Kendall三种分析方法(皮尔森分析/斯皮尔曼系数/肯达尔系数)
思路
1. 循环遍历整个SDGs列,两两拿到数据
2. 调用pandas库函数直接进行分析
代码实现
1. 循环遍历整个SDGs列,两两拿到数据
老样子,依然是先导包,导入pandas库和numpy,如果没有的去控制台pip install pandas,这里就不赘述了。
import pandas as pd
import numpy as np
随后用format方法把所有数据都改为精度为两位小数的浮点数:
# dt = pd.read_excel(r'./World-Scores-2000-2022.xlsx')  # 'r'是转义字符,避免路径中的'\'被转译

# 文本格式设置
formatter = "{0:.02f}".format
要拿数据,首先要读取execl,这里要提前装openpyxl才能正常读取:
x = pd.read_excel(r'./World-Scores-2000-2022.xlsx', dtype=object, usecols=[h + 2])然后应用文本格式,全部改为两位小数,并转化为数组:
x = x.applymap(formatter)
x_li = x.values.tolist()
最后放入循环里面执行:
for h in range(17):
    x = pd.read_excel(r'./World-Scores-2000-2022.xlsx', dtype=object, usecols=[h + 2])
    x = x.applymap(formatter)
    x_li = x.values.tolist()
    result_x = []
    for item in x_li:
        result_x.append(float(item[0]))
嵌套循环,达到两两匹配的效果,很基础了,握手问题:
for h in range(17):
    x = pd.read_excel(r'./World-Scores-2000-2022.xlsx', dtype=object, usecols=[h + 2])
    x = x.applymap(formatter)
    x_li = x.values.tolist()
    result_x = []
    for item in x_li:
        result_x.append(float(item[0]))
    for i in range(h+1, 17):
        y = pd.read_excel(r'./World-Scores-2000-2022.xlsx', dtype=object, usecols=[i + 2])
        y = y.applymap(formatter)
        y_li = y.values.tolist()
        result_y = []
        for item in y_li:
            result_y.append(float(item[0]))
2. 调用pandas库函数直接进行分析
把两列起名为varX和varY,这样就可以在每一次循环执行的时候都进行一次计算:
varX = pd.Series(result_x)
varY = pd.Series(result_y)
# 建立Kendall因果模型
# print(i + 1, result_x, result_y)
# TODO: method可选项:pearson, spearman, kendall
result = varX.corr(varY, method="spearman")
# 输出检验结果
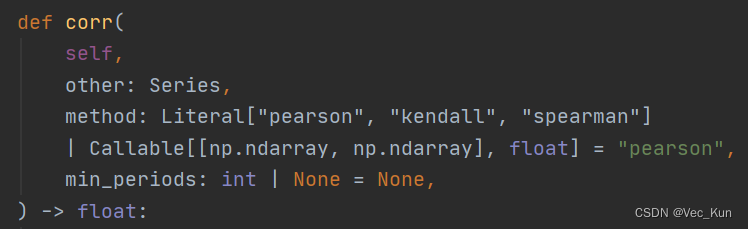
print(f'Goal{h+1}&Goal{i+1}的相关性为:', result)我们要实现算法,直接调用pandas库中corr函数,计算相关性,method可以使用三种,spearman,kendall,pearson。
可以看一下这个函数源代码:
最后print结果就好了,完整代码如下:
完整源码
import pandas as pd
import numpy as np

# dt = pd.read_excel(r'./World-Scores-2000-2022.xlsx')  # 'r'是转义字符,避免路径中的'\'被转译

# 文本格式设置
formatter = "{0:.02f}".format

for h in range(17):
    x = pd.read_excel(r'./World-Scores-2000-2022.xlsx', dtype=object, usecols=[h + 2])
    x = x.applymap(formatter)
    x_li = x.values.tolist()
    result_x = []
    for item in x_li:
        result_x.append(float(item[0]))
    for i in range(h+1, 17):
        y = pd.read_excel(r'./World-Scores-2000-2022.xlsx', dtype=object, usecols=[i + 2])
        y = y.applymap(formatter)
        y_li = y.values.tolist()
        result_y = []
        for item in y_li:
            result_y.append(float(item[0]))
            # data = pd.DataFrame({'x': result_x, 'y': result_y})
        varX = pd.Series(result_x)
        varY = pd.Series(result_y)

        # 建立Kendall因果模型
        # print(i + 1, result_x, result_y)
        # TODO: method可选项:pearson, spearman, kendall
        result = varX.corr(varY, method="spearman")

        # 输出检验结果
        print(f'Goal{h+1}&Goal{i+1}的相关性为:', result)
运行效果
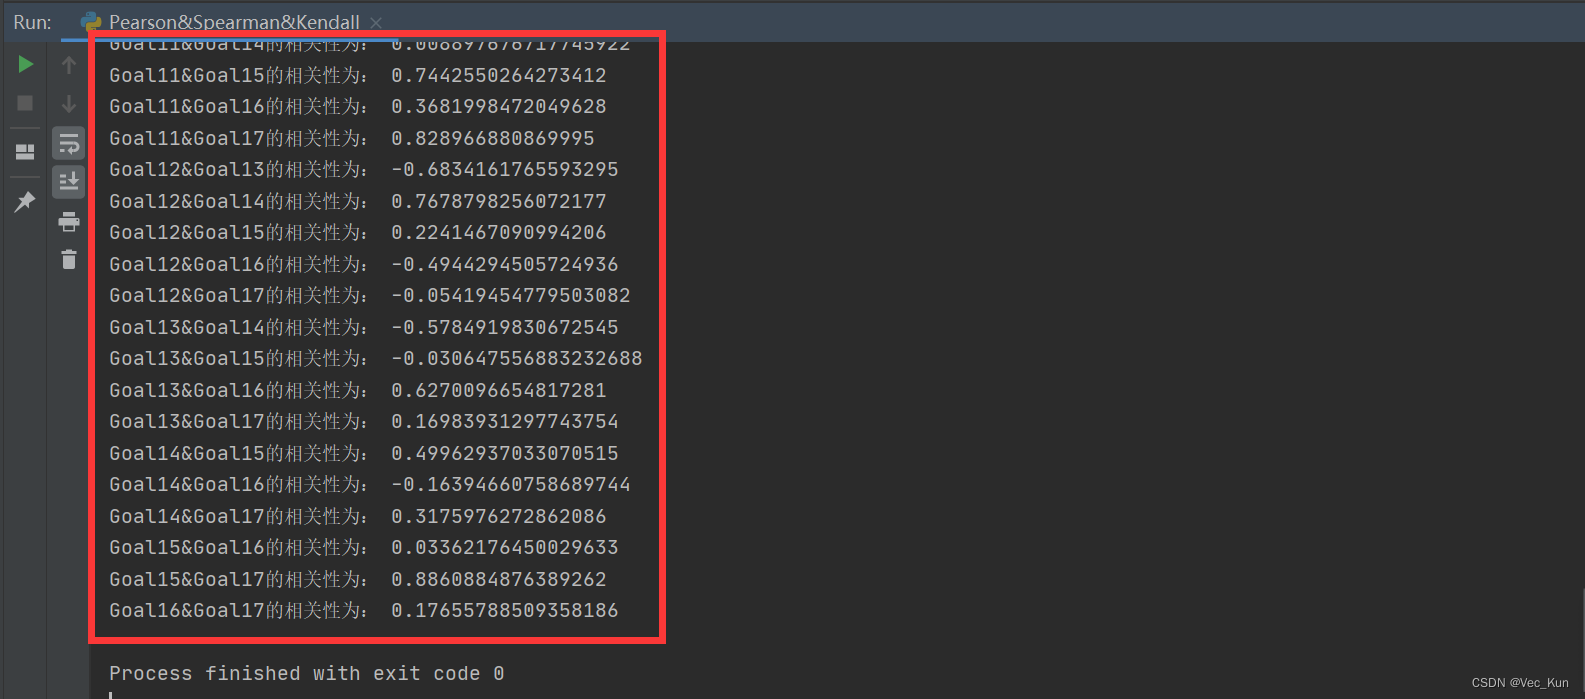
可以看到已经按顺序分析出来并输出结果,非常的好用。
后续还可以自动存入一个excel什么的,大家自己探索吧,我就不写了,在之前的文章里讲过很多次的。
总结
本文用一个例子讲了pandas计算相关性的方法,分别使用spearman,pearson,kendall三种方法。