文章目录
Multi-Camera Color Correction via Hybrid Histogram Matching
这是一篇直方图匹配的论文,通过直方图匹配达到颜色转换的目的。
主要分为2个步骤:
1个是全局的直方图匹配
2是局部颜色的调整(把累计直方图的直角展开)
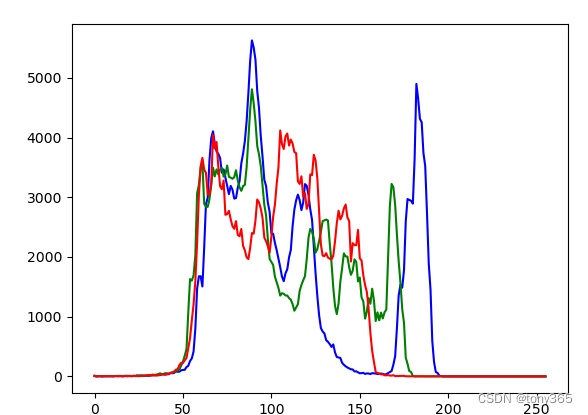
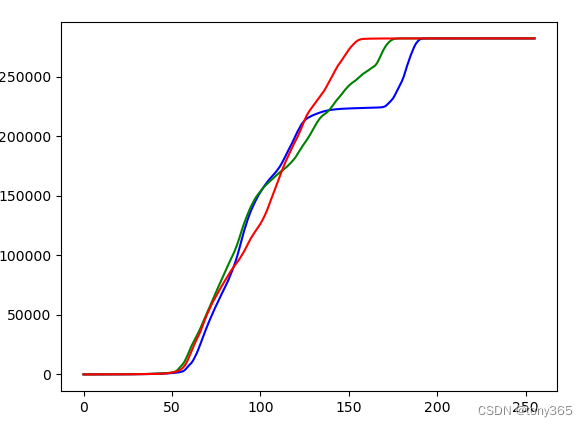
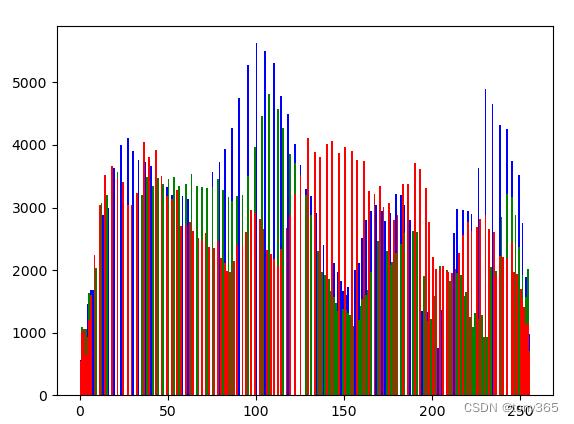
1. 计算直方图, 累计直方图, 直方图均衡化
直方图
累计直方图
直方图均衡化后的直方图
import cv2
import numpy as np
from matplotlib import pyplot as plt


def cal_hist(img):
    '''

    :param img: single channel image
    :return: hist
    '''
    hist, hist_edge = np.histogram(img, bins=256, range=[0, 256])
    # for i in range(256):
    #     hist[i] = np.count_nonzero(img==i)
    # print(hist_edge)
    return hist
def cal_cum_hist(hist):
    cum_hist = np.zeros_like(hist)
    for i in np.arange(1, 256):
        cum_hist[i] = cum_hist[i-1] + hist[i]
    return cum_hist

def cal_hist_equalize(img):
    '''

    :param img: single channel image
    :return:
    '''
    h, w = img.shape
    hist = cal_hist(img)
    cum_hist = cal_cum_hist(hist)
    lut = 255 * cum_hist / (h * w)
    lut = (lut + 0.5).astype(np.uint8)

    out = lut[img]
    return out, lut
2. 直方图规定化,直方图映射。
即将图像一 的直方图 映射为 图像二的直方图,使图像一的色彩接近图像二
def cal_hist_map(img, tgt_img):
    out1, lut1 = cal_hist_equalize(img)

    out2, lut2 = cal_hist_equalize(tgt_img)
    lut_invert = np.zeros_like(lut2)

    # 反转
    lut_invert = np.ones_like(lut2) * -1
    for i in range(0, 256):
        i = 255 - i # lut2[i]可能对应很多重复的i, 赋值为最小的一个。
        lut_invert[lut2[i]] = i
    # lut_invert 可能会有一些空缺点, 通过插值填充。
    if lut_invert[0] == -1:
        lut_invert[0] = lut_invert.min()
    if lut_invert[255] == -1:
        lut_invert[255] = lut_invert.max()
    xx = []
    yy = []
    xxx = []
    for i in range(0, 256):
        if lut_invert[i] != -1:
            xx.append(i)
            yy.append( lut_invert[i])
        else:
            xxx.append(i)

    lut_invert[lut_invert==-1] = np.interp(xxx, xx, yy)
    # 通过插值填充 或这 直接赋值
    # for i in range(1, 256):
    #     if lut_invert[i] == -1:
    #         lut_invert[i] = lut_invert[i-1]


    lut = np.zeros_like(lut1)
    for i in range(256):
        lut[i] = lut_invert[lut1[i]]

    out = lut[img]
    return out, lut
3. 实验环节
3.1 输入图像
来源:原论文仓库
3.2 均衡化效果
直方图均衡化本文代码和opencv效果对比,基本一致:
3.3 映射效果
直方图映射效果:看起来还行
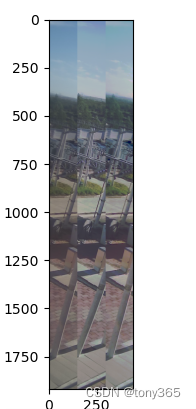
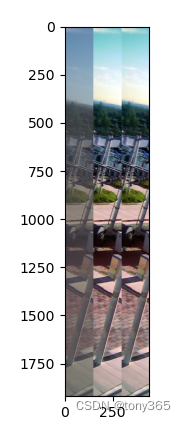
实际应用到大图的时候出现伪影:
4. 针对3实验环节的伪影 做处理和优化,就是HMM这篇论文的目的
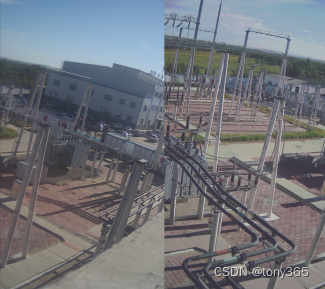
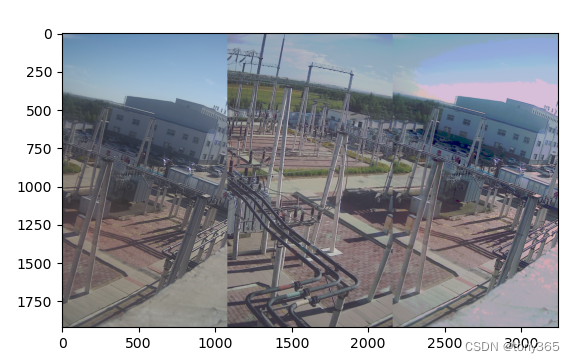
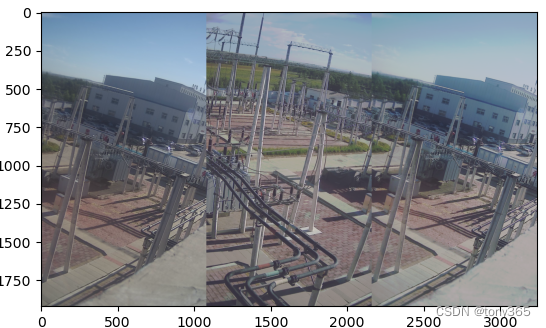
复现的效果:
左中右分别为, 图1,图2,映射后的图1(色调接近图2)
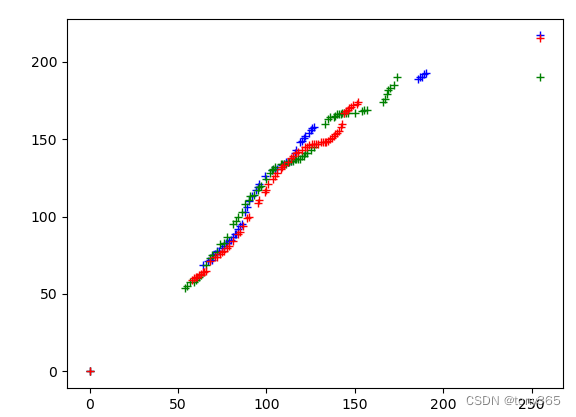
过滤噪声(数目比较少的值,累计直方图可能出现横线的地方)后,插值前的查找表:
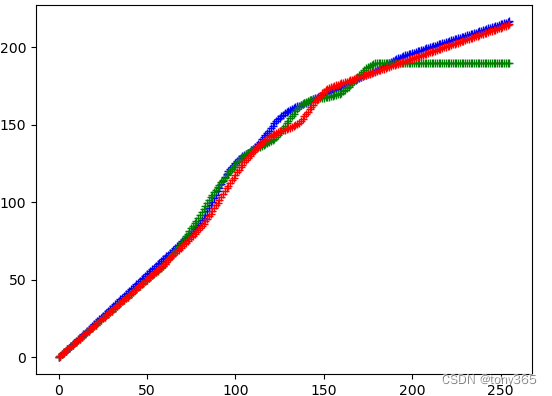
插值后:
更多实验图像可以运行下面的代码:
import cv2
import numpy as np
from matplotlib import pyplot as plt
from scipy.signal import savgol_filter

from python.hist_equalize import cal_hist_equalize, cal_hist, cal_cum_hist


def cal_noisy_index(hist1, h1, w1):
    '''找出 噪声的 index,这些值需要重新插值'''
    ts = [] # remove noise index

    sort_index = np.argsort(hist1)
    #print('sort value:', hist1[sort_index])
    s = 0
    for i in range(len(sort_index)):
        t = sort_index[i]
        s += hist1[t]
        if s < 0.05 * (h1 * w1):
            ts.append(t)
    #print('ts num:', len(ts))
    return ts
def cal_hist_map2(img, tgt_img):
    h1, w1 = img.shape
    h2, w2 = tgt_img.shape

    hist1 = cal_hist(img)
    cum_hist1 = cal_cum_hist(hist1)

    hist2 = cal_hist(tgt_img)
    cum_hist2 = cal_cum_hist(hist2)

    lut1 = 255 * cum_hist1 / (h1 * w1)
    lut1 = (lut1 + 0.5).astype(np.uint8)
    lut2 = 255 * cum_hist2 / (h2 * w2)
    lut2 = (lut2 + 0.5).astype(np.uint8)

    print('lut2:', lut2)
    lut_invert = np.ones_like(lut2) * -1
    for i in range(0, 256):
        i = 255 - i # lut2[i]可能对应很多重复的i, 赋值为第一个。
        lut_invert[lut2[i]] = i
    # lut_invert 可能会有一些空缺点, 通过插值填充。
    if lut_invert[0] == -1:
        lut_invert[0] = lut_invert.min()
    if lut_invert[255] == -1:
        lut_invert[255] = lut_invert.max()
    xx = []
    yy = []
    xxx = []
    for i in range(0, 256):
        if lut_invert[i] != -1:
            xx.append(i)
            yy.append(lut_invert[i])
        else:
            xxx.append(i)
    lut_invert[lut_invert == -1] = np.interp(xxx, xx, yy)
    # 通过插值填充 或这 直接赋值
    # for i in range(1, 256):
    #     if lut_invert[i] == -1:
    #         lut_invert[i] = lut_invert[i-1]

    lut = np.zeros_like(lut1)
    for i in range(256):
        lut[i] = lut_invert[lut1[i]]

    # min_val = tgt_img.min()
    # max_val = tgt_img.max()
    # lut = np.clip(lut, min_val, max_val)


    '''找出 噪声的 index,这些值需要重新插值'''
    ts = cal_noisy_index(hist1, h1, w1)
    ts += cal_noisy_index(hist2, h2, w2)
    ts = np.unique(ts)

    xx = []
    yy = []
    xx.append(0)
    yy.append(lut[0]) # xx, yy的选择也很重要, 可以设为0
    lut_ret = lut.copy()
    for i in range(1, 255):
        if i not in ts:
            xx.append(i)
            yy.append(lut[i])
    xx.append(255)
    yy.append(lut[-1])  # xx, yy的选择也很重要, 也可以设为255看下效果

    lut_ret[ts] = np.interp(ts, xx, yy )
    lut_ret2 = (np.array(lut_ret).astype(np.int16) + np.array(lut)) / 2 + 0.5
    lut_ret = lut_ret.astype(np.uint8)
    for i in range(len(lut)):
        print(lut[i], lut_ret[i])
    plt.figure()
    x = range(256)
    plt.title('origin lut and interp lut')
    plt.plot(x, lut, 'r.', x, lut_ret, 'b-', x, ((lut_ret.astype(np.int16) + lut) / 2), 'y')
    plt.show()
    # smooth with savgol_filter
    lut_ret = savgol_filter(lut_ret, 15, 1)

    out = lut_ret[img]

    return out, lut_ret, xx, yy

def process(file1, file2, file3, file4):
    # file1 = r'D:\code_color\HHM-master\6to7\6to7.png'
    # file2 = r'D:\code_color\HHM-master\6to7\7to6.png'
    img1 = cv2.imread(file1, 1)
    img = img1.copy()
    img2 = cv2.imread(file2, 1)
    out, lut0, xx0, yy0 = cal_hist_map2(img1[..., 0], img2[..., 0])
    out, lut1, xx1, yy1 = cal_hist_map2(img1[..., 1], img2[..., 1])
    out, lut2, xx2, yy2 = cal_hist_map2(img1[..., 2], img2[..., 2])

    plt.figure()
    x = np.arange(256)
    plt.plot(x, lut0, 'b+')
    plt.plot(x, lut1, 'g+')
    plt.plot(x, lut2, 'r+')
    plt.show()
    plt.figure()
    plt.plot(xx0, yy0, 'b+')
    plt.plot(xx1, yy1, 'g+')
    plt.plot(xx2, yy2, 'r+')
    plt.show()

    # file3 = r'D:\code_color\HHM-master\6to7\6.png'
    # file4 = r'D:\code_color\HHM-master\6to7\7.png'
    img1 = cv2.imread(file3, 1)
    img = img1.copy()
    img2 = cv2.imread(file4, 1)
    img1[..., 0] = lut0[img1[..., 0]]
    img1[..., 1] = lut1[img1[..., 1]]
    img1[..., 2] = lut2[img1[..., 2]]
    cv2.imwrite(file3[:-4] + '_my.png', img1)
    plt.figure()
    plt.imshow(np.hstack((img, img2, img1))[..., ::-1])
    plt.show()
if __name__ == "__main__":
    file2 = r'D:\code_color\HHM-master\data1\4to5.png'
    file1 = r'D:\code_color\HHM-master\data1\5to4.png'
    file4 = r'D:\code_color\HHM-master\data1\4.png'
    file3 = r'D:\code_color\HHM-master\data1\5.png'

    # file2 = r'D:\code\3dlut\lut1.png'
    # file1 = r'D:\code\3dlut\lut2.png'
    # file4 = r'D:\code\3dlut\lut1.png'
    # file3 = r'D:\code\3dlut\lut2.png'

    file2 = r'D:\code_color\HHM-master\6to7\6to7.png'
    file1 = r'D:\code_color\HHM-master\6to7\7to6.png'
    file4 = r'D:\code_color\HHM-master\6to7\6.png'
    file3 = r'D:\code_color\HHM-master\6to7\7.png'
    process(file1, file2, file3, file4)